
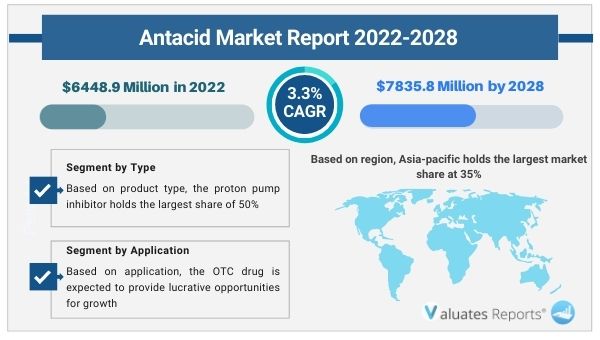
The global antacids market size is estimated to be worth US$ 6448.9 million in 2022 and is projected to reach US$ 7835.8 million by 2028 with a CAGR of 3.3% during the forecast period. Key drivers of the antacids market include the growing cases of Gastro-Esophageal Reflux Diseases(GERD) across the globe.
Moreover, poor lifestyle choices and the increasing prevalence of obesity, acid reflux, heartburn are all expected to contribute to the growth of the antacids market. The increasing penetration of eCommerce and the side effects of non-steroidal anti-inflammatory drugs is driving the growth of the market.
Gastro-Esophageal Reflux disease is a common condition that causes reflux of stomach contents into the esophagus causing acidity, irritation, pain, and other gastric problems. This situation is more prevalent among the elderly population. Antacids give fast relief as they neutralize the acids and clear out the esophagus lining thereby protecting it against gastric acids. Thus increasing cases of GERD especially among the elderly population will drive the growth of the antacids market during the forecast period.
Improper sleep patterns, lack of exercise, poor diet, and deskbound jobs are all contributing to sedentary lifestyles. This increases obesity which in turn leads to recurring acid reflux, heartburn, and indigestion problems. In fact, these common conditions have increased significantly over the last decade. Thus poor lifestyles choices and increasing prevalence of obesity, acid reflux is leading to increasing demand for antacids ultimately driving the growth of the antacids market during the forecast period.
The increasing penetration of e-commerce has led to a spurt in the growth of online medicine providers. Antacids are easily available via online retail channels. Anti-inflammatory drugs or painkillers cause several side effects in the form of stomach upsets and other gastric problems. These drugs can be taken with antacids in order to ease the pain. Thus increasing e-Commerce penetration and the growing side effects of NSAIDs will accelerate the growth of the antacids market during the forecast period.
Based on region, Asia-pacific holds the largest market share at 35% and will provide lucrative opportunities for growth in the antacids market share due to the presence of key market players, rising income levels, consumer awareness, and expanding medical infrastructure. North and Europe together hold a total share of 55%.
Based on product type, the proton pump inhibitor holds the largest share of 50% and will provide lucrative opportunities for growth in the antacids market share during the forecast period.
Based on application, the OTC drug is expected to provide lucrative opportunities for growth in the antacids market share.
In this segment of the report, the specialists have delved into the key growth opportunities that are likely to emerge. This will aid the key players to simplify complex issues related to business and frame future strategies to compete in this competitive environment. This section will certainly assist the players to boldly position their business.
|
Report Metric |
Details |
|
Base Year: |
2021 |
|
Market Size in 2022: |
USD 6448.9 Million |
|
Forecast Period: |
2022 to 2028 |
|
Forecast Period 2022 to 2028 CAGR: |
3.3% |
|
2028 Value Projection: |
USD 7835.8 Million |
|
Fastest Growing Market |
North America |
|
Largest Market |
Asia Pacific |
|
No. of Pages: |
107 |
|
Tables & Figures |
144 |
|
Segments covered: |
Type, Application, Region |
Ans. The market size of antacids surpassed USD 6448.9 million in 2022 and will witness a Compound Annual Growth Rate (CAGR) of over 3.3% through 2028.
Ans. Key drivers of the antacids market include the growing cases of Gastro-Esophageal Reflux Diseases(GERD) across the globe.
Ans. Based on product type, the proton pump inhibitor holds the largest share of 50% and will provide lucrative opportunities for growth in the antacids market share during the forecast period.
Ans. Based on region, Asia-pacific holds the largest market share at 35% and will provide lucrative opportunities for growth in the antacids market share due to the presence of key market players
Ans. The forecast period in the Antacid market report is from 2022 to 2028
Ans. The sample report for the Antacid Market can be obtained on demand from the website. Also, the 24*7 chat support & direct call services are provided to procure the sample report.
1 Study Coverage
1.1 Antacid Product Introduction
1.2 Market by Type
1.2.1 Global Antacid Market Size Growth Rate by Type, 2017 VS 2021 VS 2028
1.2.2 Proton Pump Inhibitor
1.2.3 H2 Antagonist
1.2.4 Acid Neutralizers
1.3 Market by Application
1.3.1 Global Antacid Market Size Growth Rate by Application, 2017 VS 2021 VS 2028
1.3.2 OTC Drug
1.3.3 Rx Drug
1.4 Study Objectives
1.5 Years Considered
2 Executive Summary
2.1 Global Antacid Sales Estimates and Forecasts 2017-2028
2.2 Global Antacid Revenue Estimates and Forecasts 2017-2028
2.3 Global Antacid Revenue by Region: 2017 VS 2021 VS 2028
2.4 Global Antacid Sales by Region
2.4.1 Global Antacid Sales by Region (2017-2022)
2.4.2 Global Sales Antacid by Region (2023-2028)
2.5 Global Antacid Revenue by Region
2.5.1 Global Antacid Revenue by Region (2017-2022)
2.5.2 Global Antacid Revenue by Region (2023-2028)
2.6 North America
2.7 Europe
2.8 Asia-Pacific
2.9 Latin America
2.10 Middle East & Africa
3 Competition by Manufacturers
3.1 Global Antacid Sales by Manufacturers
3.1.1 Global Top Antacid Manufacturers by Sales (2017-2022)
3.1.2 Global Antacid Sales Market Share by Manufacturers (2017-2022)
3.1.3 Global Top 10 and Top 5 Largest Manufacturers of Antacid in 2021
3.2 Global Antacid Revenue by Manufacturers
3.2.1 Global Antacid Revenue by Manufacturers (2017-2022)
3.2.2 Global Antacid Revenue Market Share by Manufacturers (2017-2022)
3.2.3 Global Top 10 and Top 5 Companies by Antacid Revenue in 2021
3.3 Global Antacid Sales Price by Manufacturers (2017-2022)
3.4 Analysis of Competitive Landscape
3.4.1 Manufacturers Market Concentration Ratio (CR5 and HHI)
3.4.2 Global Antacid Market Share by Company Type (Tier 1, Tier 2, and Tier 3)
3.4.3 Global Antacid Manufacturers Geographical Distribution
3.5 Mergers & Acquisitions, Expansion Plans
4 Market Size by Type
4.1 Global Antacid Sales by Type
4.1.1 Global Antacid Historical Sales by Type (2017-2022)
4.1.2 Global Antacid Forecasted Sales by Type (2023-2028)
4.1.3 Global Antacid Sales Market Share by Type (2017-2028)
4.2 Global Antacid Revenue by Type
4.2.1 Global Antacid Historical Revenue by Type (2017-2022)
4.2.2 Global Antacid Forecasted Revenue by Type (2023-2028)
4.2.3 Global Antacid Revenue Market Share by Type (2017-2028)
4.3 Global Antacid Price by Type
4.3.1 Global Antacid Price by Type (2017-2022)
4.3.2 Global Antacid Price Forecast by Type (2023-2028)
5 Market Size by Application
5.1 Global Antacid Sales by Application
5.1.1 Global Antacid Historical Sales by Application (2017-2022)
5.1.2 Global Antacid Forecasted Sales by Application (2023-2028)
5.1.3 Global Antacid Sales Market Share by Application (2017-2028)
5.2 Global Antacid Revenue by Application
5.2.1 Global Antacid Historical Revenue by Application (2017-2022)
5.2.2 Global Antacid Forecasted Revenue by Application (2023-2028)
5.2.3 Global Antacid Revenue Market Share by Application (2017-2028)
5.3 Global Antacid Price by Application
5.3.1 Global Antacid Price by Application (2017-2022)
5.3.2 Global Antacid Price Forecast by Application (2023-2028)
6 North America
6.1 North America Antacid Market Size by Type
6.1.1 North America Antacid Sales by Type (2017-2028)
6.1.2 North America Antacid Revenue by Type (2017-2028)
6.2 North America Antacid Market Size by Application
6.2.1 North America Antacid Sales by Application (2017-2028)
6.2.2 North America Antacid Revenue by Application (2017-2028)
6.3 North America Antacid Market Size by Country
6.3.1 North America Antacid Sales by Country (2017-2028)
6.3.2 North America Antacid Revenue by Country (2017-2028)
6.3.3 U.S.
6.3.4 Canada
7 Europe
7.1 Europe Antacid Market Size by Type
7.1.1 Europe Antacid Sales by Type (2017-2028)
7.1.2 Europe Antacid Revenue by Type (2017-2028)
7.2 Europe Antacid Market Size by Application
7.2.1 Europe Antacid Sales by Application (2017-2028)
7.2.2 Europe Antacid Revenue by Application (2017-2028)
7.3 Europe Antacid Market Size by Country
7.3.1 Europe Antacid Sales by Country (2017-2028)
7.3.2 Europe Antacid Revenue by Country (2017-2028)
7.3.3 Germany
7.3.4 France
7.3.5 U.K.
7.3.6 Italy
7.3.7 Russia
8 Asia Pacific
8.1 Asia Pacific Antacid Market Size by Type
8.1.1 Asia Pacific Antacid Sales by Type (2017-2028)
8.1.2 Asia Pacific Antacid Revenue by Type (2017-2028)
8.2 Asia Pacific Antacid Market Size by Application
8.2.1 Asia Pacific Antacid Sales by Application (2017-2028)
8.2.2 Asia Pacific Antacid Revenue by Application (2017-2028)
8.3 Asia Pacific Antacid Market Size by Region
8.3.1 Asia Pacific Antacid Sales by Region (2017-2028)
8.3.2 Asia Pacific Antacid Revenue by Region (2017-2028)
8.3.3 China
8.3.4 Japan
8.3.5 South Korea
8.3.6 India
8.3.7 Australia
8.3.8 Taiwan
8.3.9 Indonesia
8.3.10 Thailand
8.3.11 Malaysia
8.3.12 Philippines
9 Latin America
9.1 Latin America Antacid Market Size by Type
9.1.1 Latin America Antacid Sales by Type (2017-2028)
9.1.2 Latin America Antacid Revenue by Type (2017-2028)
9.2 Latin America Antacid Market Size by Application
9.2.1 Latin America Antacid Sales by Application (2017-2028)
9.2.2 Latin America Antacid Revenue by Application (2017-2028)
9.3 Latin America Antacid Market Size by Country
9.3.1 Latin America Antacid Sales by Country (2017-2028)
9.3.2 Latin America Antacid Revenue by Country (2017-2028)
9.3.3 Mexico
9.3.4 Brazil
9.3.5 Argentina
10 Middle East and Africa
10.1 Middle East and Africa Antacid Market Size by Type
10.1.1 Middle East and Africa Antacid Sales by Type (2017-2028)
10.1.2 Middle East and Africa Antacid Revenue by Type (2017-2028)
10.2 Middle East and Africa Antacid Market Size by Application
10.2.1 Middle East and Africa Antacid Sales by Application (2017-2028)
10.2.2 Middle East and Africa Antacid Revenue by Application (2017-2028)
10.3 Middle East and Africa Antacid Market Size by Country
10.3.1 Middle East and Africa Antacid Sales by Country (2017-2028)
10.3.2 Middle East and Africa Antacid Revenue by Country (2017-2028)
10.3.3 Turkey
10.3.4 Saudi Arabia
11 Company Profiles
11.1 AstraZeneca
11.1.1 AstraZeneca Corporation Information
11.1.2 AstraZeneca Overview
11.1.3 AstraZeneca Antacid Sales, Price, Revenue and Gross Margin (2017-2022)
11.1.4 AstraZeneca Antacid Product Model Numbers, Pictures, Descriptions and Specifications
11.1.5 AstraZeneca Recent Developments
11.2 Takeda Pharmaceutical
11.2.1 Takeda Pharmaceutical Corporation Information
11.2.2 Takeda Pharmaceutical Overview
11.2.3 Takeda Pharmaceutical Antacid Sales, Price, Revenue and Gross Margin (2017-2022)
11.2.4 Takeda Pharmaceutical Antacid Product Model Numbers, Pictures, Descriptions and Specifications
11.2.5 Takeda Pharmaceutical Recent Developments
11.3 Pfizer
11.3.1 Pfizer Corporation Information
11.3.2 Pfizer Overview
11.3.3 Pfizer Antacid Sales, Price, Revenue and Gross Margin (2017-2022)
11.3.4 Pfizer Antacid Product Model Numbers, Pictures, Descriptions and Specifications
11.3.5 Pfizer Recent Developments
11.4 Reckitt Benckiser
11.4.1 Reckitt Benckiser Corporation Information
11.4.2 Reckitt Benckiser Overview
11.4.3 Reckitt Benckiser Antacid Sales, Price, Revenue and Gross Margin (2017-2022)
11.4.4 Reckitt Benckiser Antacid Product Model Numbers, Pictures, Descriptions and Specifications
11.4.5 Reckitt Benckiser Recent Developments
11.5 Bayer
11.5.1 Bayer Corporation Information
11.5.2 Bayer Overview
11.5.3 Bayer Antacid Sales, Price, Revenue and Gross Margin (2017-2022)
11.5.4 Bayer Antacid Product Model Numbers, Pictures, Descriptions and Specifications
11.5.5 Bayer Recent Developments
11.6 Procter&Gamble
11.6.1 Procter&Gamble Corporation Information
11.6.2 Procter&Gamble Overview
11.6.3 Procter&Gamble Antacid Sales, Price, Revenue and Gross Margin (2017-2022)
11.6.4 Procter&Gamble Antacid Product Model Numbers, Pictures, Descriptions and Specifications
11.6.5 Procter&Gamble Recent Developments
11.7 GlaxoSmithKline
11.7.1 GlaxoSmithKline Corporation Information
11.7.2 GlaxoSmithKline Overview
11.7.3 GlaxoSmithKline Antacid Sales, Price, Revenue and Gross Margin (2017-2022)
11.7.4 GlaxoSmithKline Antacid Product Model Numbers, Pictures, Descriptions and Specifications
11.7.5 GlaxoSmithKline Recent Developments
11.8 Johnson&Johnson
11.8.1 Johnson&Johnson Corporation Information
11.8.2 Johnson&Johnson Overview
11.8.3 Johnson&Johnson Antacid Sales, Price, Revenue and Gross Margin (2017-2022)
11.8.4 Johnson&Johnson Antacid Product Model Numbers, Pictures, Descriptions and Specifications
11.8.5 Johnson&Johnson Recent Developments
11.9 CONBA
11.9.1 CONBA Corporation Information
11.9.2 CONBA Overview
11.9.3 CONBA Antacid Sales, Price, Revenue and Gross Margin (2017-2022)
11.9.4 CONBA Antacid Product Model Numbers, Pictures, Descriptions and Specifications
11.9.5 CONBA Recent Developments
11.10 Xiuzheng Pharma
11.10.1 Xiuzheng Pharma Corporation Information
11.10.2 Xiuzheng Pharma Overview
11.10.3 Xiuzheng Pharma Antacid Sales, Price, Revenue and Gross Margin (2017-2022)
11.10.4 Xiuzheng Pharma Antacid Product Model Numbers, Pictures, Descriptions and Specifications
11.10.5 Xiuzheng Pharma Recent Developments
11.11 Sanofi
11.11.1 Sanofi Corporation Information
11.11.2 Sanofi Overview
11.11.3 Sanofi Antacid Sales, Price, Revenue and Gross Margin (2017-2022)
11.11.4 Sanofi Antacid Product Model Numbers, Pictures, Descriptions and Specifications
11.11.5 Sanofi Recent Developments
11.12 Bausch Health
11.12.1 Bausch Health Corporation Information
11.12.2 Bausch Health Overview
11.12.3 Bausch Health Antacid Sales, Price, Revenue and Gross Margin (2017-2022)
11.12.4 Bausch Health Antacid Product Model Numbers, Pictures, Descriptions and Specifications
11.12.5 Bausch Health Recent Developments
11.13 CR SANJIU
11.13.1 CR SANJIU Corporation Information
11.13.2 CR SANJIU Overview
11.13.3 CR SANJIU Antacid Sales, Price, Revenue and Gross Margin (2017-2022)
11.13.4 CR SANJIU Antacid Product Model Numbers, Pictures, Descriptions and Specifications
11.13.5 CR SANJIU Recent Developments
11.14 Reddy's Laboratories
11.14.1 Reddy's Laboratories Corporation Information
11.14.2 Reddy's Laboratories Overview
11.14.3 Reddy's Laboratories Antacid Sales, Price, Revenue and Gross Margin (2017-2022)
11.14.4 Reddy's Laboratories Antacid Product Model Numbers, Pictures, Descriptions and Specifications
11.14.5 Reddy's Laboratories Recent Developments
12 Industry Chain and Sales Channels Analysis
12.1 Antacid Industry Chain Analysis
12.2 Antacid Key Raw Materials
12.2.1 Key Raw Materials
12.2.2 Raw Materials Key Suppliers
12.3 Antacid Production Mode & Process
12.4 Antacid Sales and Marketing
12.4.1 Antacid Sales Channels
12.4.2 Antacid Distributors
12.5 Antacid Customers
13 Market Drivers, Opportunities, Challenges and Risks Factors Analysis
13.1 Antacid Industry Trends
13.2 Antacid Market Drivers
13.3 Antacid Market Challenges
13.4 Antacid Market Restraints
14 Key Findings in The Global Antacid Study
15 Appendix
15.1 Research Methodology
15.1.1 Methodology/Research Approach
15.1.2 Data Source
15.2 Author Details
15.3 Disclaimer
Table 1. Global Antacid Market Size Growth Rate by Type, 2017 VS 2021 VS 2028 (US$ Million)
Table 2. Major Manufacturers of Proton Pump Inhibitor
Table 3. Major Manufacturers of H2 Antagonist
Table 4. Major Manufacturers of Acid Neutralizers
Table 5. Global Antacid Market Size Growth Rate by Application, 2017 VS 2021 VS 2028 (US$ Million)
Table 6. Global Antacid Revenue by Region: 2017 VS 2021 VS 2028 (US$ Million)
Table 7. Global Antacid Sales by Region (2017-2022) & (M Units)
Table 8. Global Antacid Sales Market Share by Region (2017-2022)
Table 9. Global Antacid Sales by Region (2023-2028) & (M Units)
Table 10. Global Antacid Sales Market Share by Region (2023-2028)
Table 11. Global Antacid Revenue by Region (2017-2022) & (US$ Million)
Table 12. Global Antacid Revenue Market Share by Region (2017-2022)
Table 13. Global Antacid Revenue by Region (2023-2028) & (US$ Million)
Table 14. Global Antacid Revenue Market Share by Region (2023-2028)
Table 15. Global Antacid Sales by Manufacturers (2017-2022) & (M Units)
Table 16. Global Antacid Sales Share by Manufacturers (2017-2022)
Table 17. Global Antacid Revenue by Manufacturers (2017-2022) & (US$ Million)
Table 18. Global Antacid Revenue Share by Manufacturers (2017-2022)
Table 19. Antacid Price by Manufacturers (2017-2022) &(USD/Unit)
Table 20. Global Antacid Manufacturers Market Concentration Ratio (CR5 and HHI)
Table 21. Global Antacid by Company Type (Tier 1, Tier 2, and Tier 3) & (based on the Revenue in Antacid as of 2021)
Table 22. Antacid Manufacturing Base Distribution and Headquarters
Table 23. Manufacturers Antacid Product Offered
Table 24. Date of Manufacturers Enter into Antacid Market
Table 25. Mergers & Acquisitions, Expansion Plans
Table 26. Global Antacid Sales by Type (2017-2022) & (M Units)
Table 27. Global Antacid Sales by Type (2023-2028) & (M Units)
Table 28. Global Antacid Sales Share by Type (2017-2022)
Table 29. Global Antacid Sales Share by Type (2023-2028)
Table 30. Global Antacid Revenue by Type (2017-2022) & (US$ Million)
Table 31. Global Antacid Revenue by Type (2023-2028) & (US$ Million)
Table 32. Global Antacid Revenue Share by Type (2017-2022)
Table 33. Global Antacid Revenue Share by Type (2023-2028)
Table 34. Antacid Price by Type (2017-2022) & (USD/Unit)
Table 35. Global Antacid Price Forecast by Type (2023-2028) & (USD/Unit)
Table 36. Global Antacid Sales by Application (2017-2022) & (M Units)
Table 37. Global Antacid Sales by Application (2023-2028) & (M Units)
Table 38. Global Antacid Sales Share by Application (2017-2022)
Table 39. Global Antacid Sales Share by Application (2023-2028)
Table 40. Global Antacid Revenue by Application (2017-2022) & (US$ Million)
Table 41. Global Antacid Revenue by Application (2023-2028) & (US$ Million)
Table 42. Global Antacid Revenue Share by Application (2017-2022)
Table 43. Global Antacid Revenue Share by Application (2023-2028)
Table 44. Antacid Price by Application (2017-2022) & (USD/Unit)
Table 45. Global Antacid Price Forecast by Application (2023-2028) & (USD/Unit)
Table 46. North America Antacid Sales by Type (2017-2022) & (M Units)
Table 47. North America Antacid Sales by Type (2023-2028) & (M Units)
Table 48. North America Antacid Revenue by Type (2017-2022) & (US$ Million)
Table 49. North America Antacid Revenue by Type (2023-2028) & (US$ Million)
Table 50. North America Antacid Sales by Application (2017-2022) & (M Units)
Table 51. North America Antacid Sales by Application (2023-2028) & (M Units)
Table 52. North America Antacid Revenue by Application (2017-2022) & (US$ Million)
Table 53. North America Antacid Revenue by Application (2023-2028) & (US$ Million)
Table 54. North America Antacid Sales by Country (2017-2022) & (M Units)
Table 55. North America Antacid Sales by Country (2023-2028) & (M Units)
Table 56. North America Antacid Revenue by Country (2017-2022) & (US$ Million)
Table 57. North America Antacid Revenue by Country (2023-2028) & (US$ Million)
Table 58. Europe Antacid Sales by Type (2017-2022) & (M Units)
Table 59. Europe Antacid Sales by Type (2023-2028) & (M Units)
Table 60. Europe Antacid Revenue by Type (2017-2022) & (US$ Million)
Table 61. Europe Antacid Revenue by Type (2023-2028) & (US$ Million)
Table 62. Europe Antacid Sales by Application (2017-2022) & (M Units)
Table 63. Europe Antacid Sales by Application (2023-2028) & (M Units)
Table 64. Europe Antacid Revenue by Application (2017-2022) & (US$ Million)
Table 65. Europe Antacid Revenue by Application (2023-2028) & (US$ Million)
Table 66. Europe Antacid Sales by Country (2017-2022) & (M Units)
Table 67. Europe Antacid Sales by Country (2023-2028) & (M Units)
Table 68. Europe Antacid Revenue by Country (2017-2022) & (US$ Million)
Table 69. Europe Antacid Revenue by Country (2023-2028) & (US$ Million)
Table 70. Asia Pacific Antacid Sales by Type (2017-2022) & (M Units)
Table 71. Asia Pacific Antacid Sales by Type (2023-2028) & (M Units)
Table 72. Asia Pacific Antacid Revenue by Type (2017-2022) & (US$ Million)
Table 73. Asia Pacific Antacid Revenue by Type (2023-2028) & (US$ Million)
Table 74. Asia Pacific Antacid Sales by Application (2017-2022) & (M Units)
Table 75. Asia Pacific Antacid Sales by Application (2023-2028) & (M Units)
Table 76. Asia Pacific Antacid Revenue by Application (2017-2022) & (US$ Million)
Table 77. Asia Pacific Antacid Revenue by Application (2023-2028) & (US$ Million)
Table 78. Asia Pacific Antacid Sales by Region (2017-2022) & (M Units)
Table 79. Asia Pacific Antacid Sales by Region (2023-2028) & (M Units)
Table 80. Asia Pacific Antacid Revenue by Region (2017-2022) & (US$ Million)
Table 81. Asia Pacific Antacid Revenue by Region (2023-2028) & (US$ Million)
Table 82. Latin America Antacid Sales by Type (2017-2022) & (M Units)
Table 83. Latin America Antacid Sales by Type (2023-2028) & (M Units)
Table 84. Latin America Antacid Revenue by Type (2017-2022) & (US$ Million)
Table 85. Latin America Antacid Revenue by Type (2023-2028) & (US$ Million)
Table 86. Latin America Antacid Sales by Application (2017-2022) & (M Units)
Table 87. Latin America Antacid Sales by Application (2023-2028) & (M Units)
Table 88. Latin America Antacid Revenue by Application (2017-2022) & (US$ Million)
Table 89. Latin America Antacid Revenue by Application (2023-2028) & (US$ Million)
Table 90. Latin America Antacid Sales by Country (2017-2022) & (M Units)
Table 91. Latin America Antacid Sales by Country (2023-2028) & (M Units)
Table 92. Latin America Antacid Revenue by Country (2017-2022) & (US$ Million)
Table 93. Latin America Antacid Revenue by Country (2023-2028) & (US$ Million)
Table 94. Middle East and Africa Antacid Sales by Type (2017-2022) & (M Units)
Table 95. Middle East and Africa Antacid Sales by Type (2023-2028) & (M Units)
Table 96. Middle East and Africa Antacid Revenue by Type (2017-2022) & (US$ Million)
Table 97. Middle East and Africa Antacid Revenue by Type (2023-2028) & (US$ Million)
Table 98. Middle East and Africa Antacid Sales by Application (2017-2022) & (M Units)
Table 99. Middle East and Africa Antacid Sales by Application (2023-2028) & (M Units)
Table 100. Middle East and Africa Antacid Revenue by Application (2017-2022) & (US$ Million)
Table 101. Middle East and Africa Antacid Revenue by Application (2023-2028) & (US$ Million)
Table 102. Middle East and Africa Antacid Sales by Country (2017-2022) & (M Units)
Table 103. Middle East and Africa Antacid Sales by Country (2023-2028) & (M Units)
Table 104. Middle East and Africa Antacid Revenue by Country (2017-2022) & (US$ Million)
Table 105. Middle East and Africa Antacid Revenue by Country (2023-2028) & (US$ Million)
Table 106. AstraZeneca Corporation Information
Table 107. AstraZeneca Description and Major Businesses
Table 108. AstraZeneca Antacid Sales (M Units), Revenue (US$ Million), Price (USD/Unit) and Gross Margin (2017-2022)
Table 109. AstraZeneca Antacid Product Model Numbers, Pictures, Descriptions and Specifications
Table 110. AstraZeneca Recent Developments
Table 111. Takeda Pharmaceutical Corporation Information
Table 112. Takeda Pharmaceutical Description and Major Businesses
Table 113. Takeda Pharmaceutical Antacid Sales (M Units), Revenue (US$ Million), Price (USD/Unit) and Gross Margin (2017-2022)
Table 114. Takeda Pharmaceutical Antacid Product Model Numbers, Pictures, Descriptions and Specifications
Table 115. Takeda Pharmaceutical Recent Developments
Table 116. Pfizer Corporation Information
Table 117. Pfizer Description and Major Businesses
Table 118. Pfizer Antacid Sales (M Units), Revenue (US$ Million), Price (USD/Unit) and Gross Margin (2017-2022)
Table 119. Pfizer Antacid Product Model Numbers, Pictures, Descriptions and Specifications
Table 120. Pfizer Recent Developments
Table 121. Reckitt Benckiser Corporation Information
Table 122. Reckitt Benckiser Description and Major Businesses
Table 123. Reckitt Benckiser Antacid Sales (M Units), Revenue (US$ Million), Price (USD/Unit) and Gross Margin (2017-2022)
Table 124. Reckitt Benckiser Antacid Product Model Numbers, Pictures, Descriptions and Specifications
Table 125. Reckitt Benckiser Recent Developments
Table 126. Bayer Corporation Information
Table 127. Bayer Description and Major Businesses
Table 128. Bayer Antacid Sales (M Units), Revenue (US$ Million), Price (USD/Unit) and Gross Margin (2017-2022)
Table 129. Bayer Antacid Product Model Numbers, Pictures, Descriptions and Specifications
Table 130. Bayer Recent Developments
Table 131. Procter&Gamble Corporation Information
Table 132. Procter&Gamble Description and Major Businesses
Table 133. Procter&Gamble Antacid Sales (M Units), Revenue (US$ Million), Price (USD/Unit) and Gross Margin (2017-2022)
Table 134. Procter&Gamble Antacid Product Model Numbers, Pictures, Descriptions and Specifications
Table 135. Procter&Gamble Recent Developments
Table 136. GlaxoSmithKline Corporation Information
Table 137. GlaxoSmithKline Description and Major Businesses
Table 138. GlaxoSmithKline Antacid Sales (M Units), Revenue (US$ Million), Price (USD/Unit) and Gross Margin (2017-2022)
Table 139. GlaxoSmithKline Antacid Product Model Numbers, Pictures, Descriptions and Specifications
Table 140. GlaxoSmithKline Recent Developments
Table 141. Johnson&Johnson Corporation Information
Table 142. Johnson&Johnson Description and Major Businesses
Table 143. Johnson&Johnson Antacid Sales (M Units), Revenue (US$ Million), Price (USD/Unit) and Gross Margin (2017-2022)
Table 144. Johnson&Johnson Antacid Product Model Numbers, Pictures, Descriptions and Specifications
Table 145. Johnson&Johnson Recent Developments
Table 146. CONBA Corporation Information
Table 147. CONBA Description and Major Businesses
Table 148. CONBA Antacid Sales (M Units), Revenue (US$ Million), Price (USD/Unit) and Gross Margin (2017-2022)
Table 149. CONBA Antacid Product Model Numbers, Pictures, Descriptions and Specifications
Table 150. CONBA Recent Developments
Table 151. Xiuzheng Pharma Corporation Information
Table 152. Xiuzheng Pharma Description and Major Businesses
Table 153. Xiuzheng Pharma Antacid Sales (M Units), Revenue (US$ Million), Price (USD/Unit) and Gross Margin (2017-2022)
Table 154. Xiuzheng Pharma Antacid Product Model Numbers, Pictures, Descriptions and Specifications
Table 155. Xiuzheng Pharma Recent Developments
Table 156. Sanofi Corporation Information
Table 157. Sanofi Description and Major Businesses
Table 158. Sanofi Antacid Sales (M Units), Revenue (US$ Million), Price (USD/Unit) and Gross Margin (2017-2022)
Table 159. Sanofi Antacid Product Model Numbers, Pictures, Descriptions and Specifications
Table 160. Sanofi Recent Developments
Table 161. Bausch Health Corporation Information
Table 162. Bausch Health Description and Major Businesses
Table 163. Bausch Health Antacid Sales (M Units), Revenue (US$ Million), Price (USD/Unit) and Gross Margin (2017-2022)
Table 164. Bausch Health Antacid Product Model Numbers, Pictures, Descriptions and Specifications
Table 165. Bausch Health Recent Developments
Table 166. CR SANJIU Corporation Information
Table 167. CR SANJIU Description and Major Businesses
Table 168. CR SANJIU Antacid Sales (M Units), Revenue (US$ Million), Price (USD/Unit) and Gross Margin (2017-2022)
Table 169. CR SANJIU Antacid Product Model Numbers, Pictures, Descriptions and Specifications
Table 170. CR SANJIU Recent Developments
Table 171. Reddy's Laboratories Corporation Information
Table 172. Reddy's Laboratories Description and Major Businesses
Table 173. Reddy's Laboratories Antacid Sales (M Units), Revenue (US$ Million), Price (USD/Unit) and Gross Margin (2017-2022)
Table 174. Reddy's Laboratories Antacid Product Model Numbers, Pictures, Descriptions and Specifications
Table 175. Reddy's Laboratories Recent Developments
Table 176. Key Raw Materials Lists
Table 177. Raw Materials Key Suppliers Lists
Table 178. Antacid Distributors List
Table 179. Antacid Customers List
Table 180. Antacid Market Trends
Table 181. Antacid Market Drivers
Table 182. Antacid Market Challenges
Table 183. Antacid Market Restraints
Table 184. Research Programs/Design for This Report
Table 185. Key Data Information from Secondary Sources
Table 186. Key Data Information from Primary Sources
List of Figures
Figure 1. Antacid Product Picture
Figure 3. Global Antacid Market Share by Type in 2021 & 2028
Figure 3. Proton Pump Inhibitor Product Picture
Figure 4. H2 Antagonist Product Picture
Figure 5. Acid Neutralizers Product Picture
Figure 6. Global Antacid Market Share by Application in 2021 & 2028
Figure 7. OTC Drug
Figure 8. Rx Drug
Figure 9. Antacid Report Years Considered
Figure 10. Global Antacid Sales 2017-2028 (M Units)
Figure 11. Global Antacid Revenue, (US$ Million), 2017 VS 2021 VS 2028
Figure 12. Global Antacid Revenue 2017-2028 (US$ Million)
Figure 13. Global Antacid Revenue Market Share by Region in Percentage: 2021 Versus 2028
Figure 14. Global Antacid Sales Market Share by Region (2017-2022)
Figure 15. Global Antacid Sales Market Share by Region (2023-2028)
Figure 16. North America Antacid Sales YoY (2017-2028) & (M Units)
Figure 17. North America Antacid Revenue YoY (2017-2028) & (US$ Million)
Figure 18. Europe Antacid Sales YoY (2017-2028) & (M Units)
Figure 19. Europe Antacid Revenue YoY (2017-2028) & (US$ Million)
Figure 20. Asia-Pacific Antacid Sales YoY (2017-2028) & (M Units)
Figure 21. Asia-Pacific Antacid Revenue YoY (2017-2028) & (US$ Million)
Figure 22. Latin America Antacid Sales YoY (2017-2028) & (M Units)
Figure 23. Latin America Antacid Revenue YoY (2017-2028) & (US$ Million)
Figure 24. Middle East & Africa Antacid Sales YoY (2017-2028) & (M Units)
Figure 25. Middle East & Africa Antacid Revenue YoY (2017-2028) & (US$ Million)
Figure 26. The Antacid Market Share of Top 10 and Top 5 Largest Manufacturers Around the World in 2021
Figure 27. The Top 5 and 10 Largest Manufacturers of Antacid in the World: Market Share by Antacid Revenue in 2021
Figure 28. Global Antacid Market Share by Company Type (Tier 1, Tier 2, and Tier 3): 2017 VS 2021
Figure 29. Global Antacid Sales Market Share by Type (2017-2028)
Figure 30. Global Antacid Revenue Market Share by Type (2017-2028)
Figure 31. Global Antacid Sales Market Share by Application (2017-2028)
Figure 32. Global Antacid Revenue Market Share by Application (2017-2028)
Figure 33. North America Antacid Sales Market Share by Type (2017-2028)
Figure 34. North America Antacid Revenue Market Share by Type (2017-2028)
Figure 35. North America Antacid Sales Market Share by Application (2017-2028)
Figure 36. North America Antacid Revenue Market Share by Application (2017-2028)
Figure 37. North America Antacid Sales Share by Country (2017-2028)
Figure 38. North America Antacid Revenue Share by Country (2017-2028)
Figure 39. U.S. Antacid Revenue (2017-2028) & (US$ Million)
Figure 40. Canada Antacid Revenue (2017-2028) & (US$ Million)
Figure 41. Europe Antacid Sales Market Share by Type (2017-2028)
Figure 42. Europe Antacid Revenue Market Share by Type (2017-2028)
Figure 43. Europe Antacid Sales Market Share by Application (2017-2028)
Figure 44. Europe Antacid Revenue Market Share by Application (2017-2028)
Figure 45. Europe Antacid Sales Share by Country (2017-2028)
Figure 46. Europe Antacid Revenue Share by Country (2017-2028)
Figure 47. Germany Antacid Revenue (2017-2028) & (US$ Million)
Figure 48. France Antacid Revenue (2017-2028) & (US$ Million)
Figure 49. U.K. Antacid Revenue (2017-2028) & (US$ Million)
Figure 50. Italy Antacid Revenue (2017-2028) & (US$ Million)
Figure 51. Russia Antacid Revenue (2017-2028) & (US$ Million)
Figure 52. Asia Pacific Antacid Sales Market Share by Type (2017-2028)
Figure 53. Asia Pacific Antacid Revenue Market Share by Type (2017-2028)
Figure 54. Asia Pacific Antacid Sales Market Share by Application (2017-2028)
Figure 55. Asia Pacific Antacid Revenue Market Share by Application (2017-2028)
Figure 56. Asia Pacific Antacid Sales Share by Region (2017-2028)
Figure 57. Asia Pacific Antacid Revenue Share by Region (2017-2028)
Figure 58. China Antacid Revenue (2017-2028) & (US$ Million)
Figure 59. Japan Antacid Revenue (2017-2028) & (US$ Million)
Figure 60. South Korea Antacid Revenue (2017-2028) & (US$ Million)
Figure 61. India Antacid Revenue (2017-2028) & (US$ Million)
Figure 62. Australia Antacid Revenue (2017-2028) & (US$ Million)
Figure 63. Taiwan Antacid Revenue (2017-2028) & (US$ Million)
Figure 64. Indonesia Antacid Revenue (2017-2028) & (US$ Million)
Figure 65. Thailand Antacid Revenue (2017-2028) & (US$ Million)
Figure 66. Malaysia Antacid Revenue (2017-2028) & (US$ Million)
Figure 67. Philippines Antacid Revenue (2017-2028) & (US$ Million)
Figure 68. Latin America Antacid Sales Market Share by Type (2017-2028)
Figure 69. Latin America Antacid Revenue Market Share by Type (2017-2028)
Figure 70. Latin America Antacid Sales Market Share by Application (2017-2028)
Figure 71. Latin America Antacid Revenue Market Share by Application (2017-2028)
Figure 72. Latin America Antacid Sales Share by Country (2017-2028)
Figure 73. Latin America Antacid Revenue Share by Country (2017-2028)
Figure 74. Mexico Antacid Revenue (2017-2028) & (US$ Million)
Figure 75. Brazil Antacid Revenue (2017-2028) & (US$ Million)
Figure 76. Argentina Antacid Revenue (2017-2028) & (US$ Million)
Figure 77. Middle East and Africa Antacid Sales Market Share by Type (2017-2028)
Figure 78. Middle East and Africa Antacid Revenue Market Share by Type (2017-2028)
Figure 79. Middle East and Africa Antacid Sales Market Share by Application (2017-2028)
Figure 80. Middle East and Africa Antacid Revenue Market Share by Application (2017-2028)
Figure 81. Middle East and Africa Antacid Sales Share by Country (2017-2028)
Figure 82. Middle East and Africa Antacid Revenue Share by Country (2017-2028)
Figure 83. Turkey Antacid Revenue (2017-2028) & (US$ Million)
Figure 84. Saudi Arabia Antacid Revenue (2017-2028) & (US$ Million)
Figure 85. U.A.E Antacid Revenue (2017-2028) & (US$ Million)
Figure 86. Antacid Value Chain
Figure 87. Antacid Production Process
Figure 88. Channels of Distribution
Figure 89. Distributors Profiles
Figure 90. Bottom-up and Top-down Approaches for This Report
Figure 91. Data Triangulation
Figure 92. Key Executives Interviewed
$4900
$7350
$9800
