
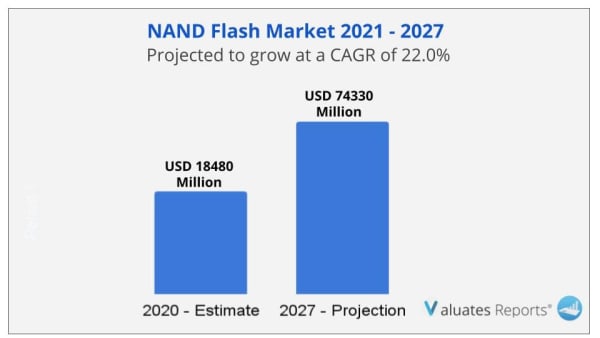
In 2020, the global NAND Flash market size was USD 18480 Million and it is expected to reach USD 74330 Million by the end of 2027, with a CAGR of 22.0% during 2021-2027.
NAND-flash memory is a form of non-linear internal macro-cell mode memory that offers an affordable and efficient method for the development of large-capacity solid-state memory. Since NAND-flash memory is capable of storing huge quantities of data and has a fast rewrite speed, it has become more extensively employed in embedded goods like digital cameras, MP3 players, and memory cards.
Data storage solutions are in high demand as a result of the exponential development in data output from different sources, including smartphones, IoT devices, cloud computing, and social media. Consumer devices, business storage systems, and data centers are just a few examples of applications that benefit greatly from NAND flash memory's high-density storage capabilities. Traditional macrocellular networks could struggle to maintain coverage and quality in crowded cities, enclosed spaces, and far-off sites. In these difficult circumstances, small cells provide a cost-effective solution by increasing network coverage and signal quality, and strength. The deployment of small-cell 5G networks is being driven by the demand for dependable and high-performance connections. This factor is expected to drive the growth of the NAND Flash Market
The demand for NAND flash memory has increased as a result of the widespread use of smartphones, tablets, wearable technology, and other consumer electronics goods. To store media files, apps, and other data on these devices, high-capacity, high-performance storage solutions are required. NAND memory offers the required storage capability, allowing developers to create cutting-edge, feature-rich gadgets. A key factor driving the NAND flash industry is the substitution of traditional hard disc drives (HDDs) with SSDs in a variety of applications, including laptops, desktops, and enterprise storage systems. NAND flash memory makes it possible for SSDs to have benefits including quicker read/write speeds, increased reliability, lower power consumption, and small form factors. This factor is expected to drive the growth of the NAND Flash Market
The demand for NAND flash memory has grown as a result of the expansion of cloud computing and data centers. High-performance storage options are needed by cloud service providers in order to manage enormous volumes of data and give clients quick, effective access. The speed and capacity requirements of cloud-based applications and services are met by NAND flash memory. The need for NAND flash memory is being driven by the expansion of Internet of Things (IoT) devices across several industries, including healthcare, automotive, industrial automation, and smart homes. Large volumes of data are generated and processed by IoT devices, necessitating dependable and large-capacity storage solutions. The requisite storage capacities for IoT applications are provided by NAND flash memory. This factor is expected to drive the growth of the NAND Flash Market
The introduction of 3D NAND and sophisticated production techniques, among other technological developments in NAND flash memory, have considerably boosted storage density and enhanced the functionality of NAND flash devices. These developments have improved NAND flash memory's affordability and dependability, which has accelerated its adoption across several sectors. NAND flash memory has become less expensive over time, giving it a more affordable storage option than competing products. Its accessibility and affordability have risen due to the lowering costs, spurring its use in a variety of applications. This factor is expected to drive the growth of the NAND Flash Market
Due to the presence of large manufacturers and the substantial demand for consumer electronics in nations like China, South Korea, Japan, and Taiwan, the Asia-Pacific region is a big market for NAND flash memory. These nations are renowned for producing high-quality smartphones, tablets, and other electronic products because of their robust manufacturing capacities. The need for NAND flash memory is also fueled by the region's explosive expansion in the cloud computing, data center, and IoT industries.
| Report Metric | Details |
| Report Name | Nand Flash Market |
| Base Year | 2020 |
| Forecasted years | 2021-2027 |
| Forecast units | USD |
| Report coverage | Revenue and volume forecast, company share, competitive landscape, growth factors and trends |
| Geographic regions covered | North America, Europe, Asia Pacific, Latin America, Middle East & Africa |
Ans. In 2020, the global NAND Flash market size was USD 18480 Million and it is expected to reach USD 74330 Million by the end of 2027, with a CAGR of 22.0% during 2021-2027.
Ans. Some of the major companies are Samsung Electronics, Toshiba/SanDisk, SK Hynix Semiconductor, Micron Technology, Intel Corporation.
1 Study Coverage
1.1 NAND Flash Product Introduction
1.2 Market by Type
1.2.1 Global NAND Flash Market Size Growth Rate by Type
1.2.2 MLC NAND
1.2.3 TLC NAND
1.3 Market by Application
1.3.1 Global NAND Flash Market Size Growth Rate by Application
1.3.2 Consumer Electronics
1.3.3 SSD (Solid State Disk)
1.4 Study Objectives
1.5 Years Considered
2 Executive Summary
2.1 Global NAND Flash Market Size Estimates and Forecasts
2.1.1 Global NAND Flash Revenue 2016-2027
2.1.2 Global NAND Flash Sales 2016-2027
2.2 NAND Flash Market Size by Region: 2021 Versus 2027
2.3 NAND Flash Sales by Region (2016-2027)
2.3.1 Global NAND Flash Sales by Region: 2016-2021
2.3.2 Global NAND Flash Sales Forecast by Region (2022-2027)
2.3.3 Global NAND Flash Sales Market Share by Region (2016-2027)
2.4 NAND Flash Market Estimates and Projections by Region (2022-2027)
2.4.1 Global NAND Flash Revenue by Region: 2016-2021
2.4.2 Global NAND Flash Revenue Forecast by Region (2022-2027)
2.4.3 Global NAND Flash Revenue Market Share by Region (2016-2027)
3 Global NAND Flash by Manufacturers
3.1 Global Top NAND Flash Manufacturers by Sales
3.1.1 Global NAND Flash Sales by Manufacturer (2016-2021)
3.1.2 Global NAND Flash Sales Market Share by Manufacturer (2016-2021)
3.2 Global Top NAND Flash Manufacturers by Revenue
3.2.1 Global NAND Flash Revenue by Manufacturer (2016-2021)
3.2.2 Global NAND Flash Revenue Share by Manufacturer (2016-2021)
3.3 Global NAND Flash Price by Manufacturer (2016-2021)
3.4 Competitive Landscape
3.4.1 Key NAND Flash Manufacturers Covered: Ranking by Revenue
3.4.2 Global NAND Flash Market Concentration Ratio (CR5 and HHI) & (2016-2021)
3.4.3 Global NAND Flash Market Share by Company Type (Tier 1, Tier 2 and Tier 3)
3.5 Global NAND Flash Manufacturing Base Distribution, Product Type
3.5.1 NAND Flash Manufacturers Manufacturing Base Distribution, Headquarters
3.5.2 Manufacturers NAND Flash Product Type
3.5.3 Date of International Manufacturers Enter into NAND Flash Market
3.6 Manufacturers Mergers & Acquisitions, Expansion Plans
4 Company Profiles
4.1 Samsung Electronics
4.1.1 Samsung Electronics Corporation Information
4.1.2 Samsung Electronics Description, Business Overview
4.1.3 Samsung Electronics NAND Flash Products Offered
4.1.4 Samsung Electronics NAND Flash Sales, Revenue and Gross Margin (2016-2021)
4.1.5 Samsung Electronics NAND Flash Revenue by Product
4.1.6 Samsung Electronics NAND Flash Revenue by Application
4.1.7 Samsung Electronics NAND Flash Revenue by Geographic Area
4.1.8 Samsung Electronics NAND Flash Revenue by Sales Channel
4.1.9 Samsung Electronics Recent Development
4.2 Toshiba/SanDisk
4.2.1 Toshiba/SanDisk Corporation Information
4.2.2 Toshiba/SanDisk Description, Business Overview
4.2.3 Toshiba/SanDisk NAND Flash Products Offered
4.2.4 Toshiba/SanDisk NAND Flash Sales, Revenue and Gross Margin (2016-2021)
4.2.5 Toshiba/SanDisk NAND Flash Revenue by Product
4.2.6 Toshiba/SanDisk NAND Flash Revenue by Application
4.2.7 Toshiba/SanDisk NAND Flash Revenue by Geographic Area
4.2.8 Toshiba/SanDisk NAND Flash Revenue by Sales Channel
4.2.9 Toshiba/SanDisk Recent Development
4.3 SK Hynix Semiconductor
4.3.1 SK Hynix Semiconductor Corporation Information
4.3.2 SK Hynix Semiconductor Description, Business Overview
4.3.3 SK Hynix Semiconductor NAND Flash Products Offered
4.3.4 SK Hynix Semiconductor NAND Flash Sales, Revenue and Gross Margin (2016-2021)
4.3.5 SK Hynix Semiconductor NAND Flash Revenue by Product
4.3.6 SK Hynix Semiconductor NAND Flash Revenue by Application
4.3.7 SK Hynix Semiconductor NAND Flash Revenue by Geographic Area
4.3.8 SK Hynix Semiconductor NAND Flash Revenue by Sales Channel
4.3.9 SK Hynix Semiconductor Recent Development
4.4 Micron Technology
4.4.1 Micron Technology Corporation Information
4.4.2 Micron Technology Description, Business Overview
4.4.3 Micron Technology NAND Flash Products Offered
4.4.4 Micron Technology NAND Flash Sales, Revenue and Gross Margin (2016-2021)
4.4.5 Micron Technology NAND Flash Revenue by Product
4.4.6 Micron Technology NAND Flash Revenue by Application
4.4.7 Micron Technology NAND Flash Revenue by Geographic Area
4.4.8 Micron Technology NAND Flash Revenue by Sales Channel
4.4.9 Micron Technology Recent Development
4.5 Intel Corporation
4.5.1 Intel Corporation Corporation Information
4.5.2 Intel Corporation Description, Business Overview
4.5.3 Intel Corporation NAND Flash Products Offered
4.5.4 Intel Corporation NAND Flash Sales, Revenue and Gross Margin (2016-2021)
4.5.5 Intel Corporation NAND Flash Revenue by Product
4.5.6 Intel Corporation NAND Flash Revenue by Application
4.5.7 Intel Corporation NAND Flash Revenue by Geographic Area
4.5.8 Intel Corporation NAND Flash Revenue by Sales Channel
4.5.9 Intel Corporation Recent Development
5 Breakdown Data by Type
5.1 Global NAND Flash Sales by Type (2016-2027)
5.1.1 Global NAND Flash Sales by Type (2016-2021)
5.1.2 Global NAND Flash Sales Forecast by Type (2022-2027)
5.1.3 Global NAND Flash Sales Market Share by Type (2016-2027)
5.2 Global NAND Flash Revenue Forecast by Type (2016-2027)
5.2.1 Global NAND Flash Revenue by Type (2016-2021)
5.2.2 Global NAND Flash Revenue Forecast by Type (2022-2027)
5.2.3 Global NAND Flash Revenue Market Share by Type (2016-2027)
5.3 NAND Flash Average Selling Price (ASP) by Type (2016-2027)
6 Breakdown Data by Application
6.1 Global NAND Flash Sales by Application (2016-2027)
6.1.1 Global NAND Flash Sales by Application (2016-2021)
6.1.2 Global NAND Flash Sales Forecast by Application (2022-2027)
6.1.3 Global NAND Flash Sales Market Share by Application (2016-2027)
6.2 Global NAND Flash Revenue Forecast by Application (2016-2027)
6.2.1 Global NAND Flash Revenue by Application (2016-2021)
6.2.2 Global NAND Flash Revenue Forecast by Application (2022-2027)
6.2.3 Global NAND Flash Revenue Market Share by Application (2016-2027)
6.3 NAND Flash Average Selling Price (ASP) by Application (2016-2027)
7 North America
7.1 North America NAND Flash Market Size YoY Growth 2016-2027
7.2 North America NAND Flash Market Facts & Figures by Country
7.2.1 North America NAND Flash Sales by Country (2016-2027)
7.2.2 North America NAND Flash Revenue by Country (2016-2027)
7.3 North America NAND Flash Sales by Type
7.4 North America NAND Flash Sales by Application
8 Asia-Pacific
8.1 Asia-Pacific NAND Flash Market Size YoY Growth 2016-2027
8.2 Asia-Pacific NAND Flash Market Facts & Figures by Region
8.2.1 Asia-Pacific NAND Flash Sales by Region (2016-2027)
8.2.2 Asia-Pacific NAND Flash Revenue by Region (2016-2027)
8.3 Asia-Pacific NAND Flash Sales by Type
8.4 Asia-Pacific NAND Flash Sales by Application
9 Europe
9.1 Europe NAND Flash Market Size YoY Growth 2016-2027
9.2 Europe NAND Flash Market Facts & Figures by Country
9.2.1 Europe NAND Flash Sales by Country (2016-2027)
9.2.2 Europe NAND Flash Revenue by Country (2016-2027)
9.3 Europe NAND Flash Sales by Type
9.4 Europe NAND Flash Sales by Application
10 Latin America
10.1 Latin America NAND Flash Market Size YoY Growth 2016-2027
10.2 Latin America NAND Flash Market Facts & Figures by Country
10.2.1 Latin America NAND Flash Sales by Country (2016-2027)
10.2.2 Latin America NAND Flash Revenue by Country (2016-2027)
10.3 Latin America NAND Flash Sales by Type
10.4 Latin America NAND Flash Sales by Application
11 Middle East and Africa
11.1 Middle East and Africa NAND Flash Market Size YoY Growth 2016-2027
11.2 Middle East and Africa NAND Flash Market Facts & Figures by Country
11.2.1 Middle East and Africa NAND Flash Sales by Country (2016-2027)
11.2.2 Middle East and Africa NAND Flash Revenue by Country (2016-2027)
11.3 Middle East and Africa NAND Flash Sales by Type
11.4 Middle East and Africa NAND Flash Sales by Application
12 Supply Chain and Sales Channel Analysis
12.1 NAND Flash Supply Chain Analysis
12.2 NAND Flash Key Raw Materials and Upstream Suppliers
12.3 NAND Flash Clients Analysis
12.4 NAND Flash Sales Channel and Sales Model Analysis
12.4.1 NAND Flash Distribution Channel Analysis: Indirect Sales VS Direct Sales
12.4.2 NAND Flash Distribution Channel Analysis: Online Sales VS Offline Sales
12.4.3 NAND Flash Distributors
13 Market Dynamics
13.1 NAND Flash Market Drivers
13.2 NAND Flash Market Opportunities
13.3 NAND Flash Market Challenges
13.4 NAND Flash Market Restraints
13.5 Porter’s Five Forces Analysis
14 Research Findings and Conclusion
15 Appendix
15.1 Research Methodology
15.1.1 Methodology/Research Approach
15.1.2 Data Source
15.2 Author Details
15.3 Disclaimer
List of Tables
Table 1. Global NAND Flash Market Size Growth Rate by Type (US$ Million): 2021 VS 2027
Table 2. Major Manufacturers of MLC NAND
Table 3. Major Manufacturers of TLC NAND
Table 4. Global NAND Flash Market Size Growth by Application (US$ Million): 2021 VS 2027
Table 5. Global NAND Flash Market Size by Region (US$ Million): 2021 VS 2027
Table 6. Global NAND Flash Sales by Region (2016-2021) & (M Units)
Table 7. Global NAND Flash Sales Forecast by Region (2022-2027) & (M Units)
Table 8. Global NAND Flash Revenue by Region (2016-2021) & (US$ Million)
Table 9. Global NAND Flash Revenue Forecast by Region (2022-2027) & (US$ Million)
Table 10. Global NAND Flash Sales by Manufacturer (2016-2021) & (M Units)
Table 11. Global NAND Flash Sales Share by Manufacturer (2016-2021)
Table 12. NAND Flash Revenue by Manufacturer (2016-2021) & (US$ Million)
Table 13. NAND Flash Revenue Share by Manufacturer (2016-2021)
Table 14. Key Manufacturers NAND Flash Price (2016-2021) & (USD/Unit)
Table 15. Ranking of Global Top NAND Flash Manufacturers by Revenue (US$ Million) in 2020
Table 16. Global NAND Flash Manufacturers Market Concentration Ratio (CR5 and HHI) & (2016-2021)
Table 17. Global NAND Flash by Company Type (Tier 1, Tier 2 and Tier 3) & (based on the Revenue in NAND Flash as of 2020)
Table 18. NAND Flash Manufacturers Manufacturing Base Distribution and Headquarters
Table 19. Manufacturers NAND Flash Product Type
Table 20. Date of International Manufacturers Enter into NAND Flash Market
Table 21. Manufacturers Mergers & Acquisitions, Expansion Plans
Table 22. Samsung Electronics Corporation Information
Table 23. Samsung Electronics Description and Business Overview
Table 24. Samsung Electronics NAND Flash Sales (M Units), Revenue (US$ Million), Price (USD/Unit) and Gross Margin (2016-2021)
Table 25. Samsung Electronics NAND Flash Product
Table 26. Samsung Electronics NAND Flash Revenue (US$ Million) and Market Share by Product
Table 27. Samsung Electronics NAND Flash Revenue (US$ Million) and Market Share by Application
Table 28. Samsung Electronics NAND Flash Revenue (US$ Million) and Market Share by Geographic Area
Table 29. Samsung Electronics NAND Flash Revenue (US$ Million) and Market Share by Sales Channel
Table 30. Samsung Electronics Recent Development
Table 31. Toshiba/SanDisk Corporation Information
Table 32. Toshiba/SanDisk Description and Business Overview
Table 33. Toshiba/SanDisk NAND Flash Sales (M Units), Revenue (US$ Million), Price (USD/Unit) and Gross Margin (2016-2021)
Table 34. Toshiba/SanDisk NAND Flash Product
Table 35. Toshiba/SanDisk NAND Flash Revenue (US$ Million) and Market Share by Product
Table 36. Toshiba/SanDisk NAND Flash Revenue (US$ Million) and Market Share by Application
Table 37. Toshiba/SanDisk NAND Flash Revenue (US$ Million) and Market Share by Geographic Area
Table 38. Toshiba/SanDisk NAND Flash Revenue (US$ Million) and Market Share by Sales Channel
Table 39. Toshiba/SanDisk Recent Development
Table 40. SK Hynix Semiconductor Corporation Information
Table 41. SK Hynix Semiconductor Description and Business Overview
Table 42. SK Hynix Semiconductor NAND Flash Sales (M Units), Revenue (US$ Million), Price (USD/Unit) and Gross Margin (2016-2021)
Table 43. SK Hynix Semiconductor NAND Flash Product
Table 44. SK Hynix Semiconductor NAND Flash Revenue (US$ Million) and Market Share by Product
Table 45. SK Hynix Semiconductor NAND Flash Revenue (US$ Million) and Market Share by Application
Table 46. SK Hynix Semiconductor NAND Flash Revenue (US$ Million) and Market Share by Geographic Area
Table 47. SK Hynix Semiconductor NAND Flash Revenue (US$ Million) and Market Share by Sales Channel
Table 48. SK Hynix Semiconductor Recent Development
Table 49. Micron Technology Corporation Information
Table 50. Micron Technology Description and Business Overview
Table 51. Micron Technology NAND Flash Sales (M Units), Revenue (US$ Million), Price (USD/Unit) and Gross Margin (2016-2021)
Table 52. Micron Technology NAND Flash Product
Table 53. Micron Technology NAND Flash Revenue (US$ Million) and Market Share by Product
Table 54. Micron Technology NAND Flash Revenue (US$ Million) and Market Share by Application
Table 55. Micron Technology NAND Flash Revenue (US$ Million) and Market Share by Geographic Area
Table 56. Micron Technology NAND Flash Revenue (US$ Million) and Market Share by Sales Channel
Table 57. Micron Technology Recent Development
Table 58. Intel Corporation Corporation Information
Table 59. Intel Corporation Description and Business Overview
Table 60. Intel Corporation NAND Flash Sales (M Units), Revenue (US$ Million), Price (USD/Unit) and Gross Margin (2016-2021)
Table 61. Intel Corporation NAND Flash Product
Table 62. Intel Corporation NAND Flash Revenue (US$ Million) and Market Share by Product
Table 63. Intel Corporation NAND Flash Revenue (US$ Million) and Market Share by Application
Table 64. Intel Corporation NAND Flash Revenue (US$ Million) and Market Share by Geographic Area
Table 65. Intel Corporation NAND Flash Revenue (US$ Million) and Market Share by Sales Channel
Table 66. Intel Corporation Recent Development
Table 67. Global NAND Flash Sales by Type (2016-2021) & (M Units)
Table 68. Global NAND Flash Sales Forecast by Type (2022-2027) & (M Units)
Table 69. Global NAND Flash Revenue by Type (2016-2021) & (US$ Million)
Table 70. Global NAND Flash Revenue Forecast by Type (2022-2027) & (US$ Million)
Table 71. Global NAND Flash Sales by Application (2016-2021) & (M Units)
Table 72. Global NAND Flash Sales Forecast by Application (2022-2027) & (M Units)
Table 73. Global NAND Flash Revenue by Application (2016-2021) & (US$ Million)
Table 74. Global NAND Flash Revenue Forecast by Application (2022-2027) & (US$ Million)
Table 75. North America NAND Flash Sales by Country (2016-2021) & (M Units)
Table 76. North America NAND Flash Sales by Country (2022-2027) & (M Units)
Table 77. North America NAND Flash Revenue by Country (2016-2021) & (US$ Million)
Table 78. North America NAND Flash Revenue by Country (2022-2027) & (US$ Million)
Table 79. North America NAND Flash Sales by Type (2016-2021) & (M Units)
Table 80. North America NAND Flash Sales by Application (2016-2021) & (M Units)
Table 81. Asia-Pacific NAND Flash Sales by Region (2016-2021) & (M Units)
Table 82. Asia-Pacific NAND Flash Sales by Region (2022-2027) & (M Units)
Table 83. Asia-Pacific NAND Flash Revenue by Region (2016-2027) & (US$ Million)
Table 84. Asia-Pacific NAND Flash Revenue by Region (2022-2027) & (US$ Million)
Table 85. Asia-Pacific NAND Flash Sales by Type (2016-2021) & (M Units)
Table 86. Asia-Pacific NAND Flash Sales by Application (2016-2021) & (M Units)
Table 87. Europe NAND Flash Sales by Country (2016-2021) & (M Units)
Table 88. Europe NAND Flash Sales by Country (2022-2027) & (M Units)
Table 89. Europe NAND Flash Revenue by Country (2016-2021) & (US$ Million)
Table 90. Europe NAND Flash Revenue by Country (2022-2027) & (US$ Million)
Table 91. Europe NAND Flash Sales by Type (2016-2021) & (M Units)
Table 92. Europe NAND Flash Sales by Application (2016-2021) & (M Units)
Table 93. Latin America NAND Flash Sales by Country (2016-2021) & (M Units)
Table 94. Latin America NAND Flash Sales by Country (2022-2027) & (M Units)
Table 95. Latin America NAND Flash Revenue by Country (2016-2021) & (US$ Million)
Table 96. Latin America NAND Flash Revenue by Country (2022-2027) & (US$ Million)
Table 97. Latin America NAND Flash Sales by Type (2016-2021) & (M Units)
Table 98. Latin America NAND Flash Sales by Application (2016-2021) & (M Units)
Table 99. Middle East and Africa NAND Flash Sales by Country (2016-2021) & (M Units)
Table 100. Middle East and Africa NAND Flash Sales by Country (2022-2027) & (M Units)
Table 101. Middle East and Africa NAND Flash Revenue by Country (2016-2021) & (US$ Million)
Table 102. Middle East and Africa NAND Flash Revenue by Country (2022-2027) & (US$ Million)
Table 103. Middle East and Africa NAND Flash Sales by Type (2016-2021) & (M Units)
Table 104. Middle East and Africa NAND Flash Sales by Application (2016-2021) & (M Units)
Table 105. NAND Flash Key Raw Materials, Industry Status and Trend
Table 106. NAND Flash Key Raw Materials and Upstream Suppliers
Table 107. NAND Flash Clients Status and Trend
Table 108. NAND Flash Typical Clients
Table 109. NAND Flash Distributors
Table 110. Key Drivers: Impact Analysis (2022-2027)
Table 111. NAND Flash Market Drivers
Table 112. NAND Flash Market Opportunities
Table 113. NAND Flash Market Challenges
Table 114. NAND Flash Market Restraints
Table 115. NAND Flash Porter’s Five Forces Analysis
Table 116. Research Programs/Design for This Report
Table 117. Key Data Information from Secondary Sources
Table 118. Key Data Information from Primary Sources
List of Figures
Figure 1. NAND Flash Product Picture
Figure 2. Global NAND Flash Sales Market Share by Type in 2021 & 2027
Figure 3. MLC NAND Product Picture
Figure 4. TLC NAND Product Picture
Figure 5. Global NAND Flash Sales Market Share by Application in 2021 & 2027
Figure 6. Consumer Electronics Examples
Figure 7. SSD (Solid State Disk) Examples
Figure 8. NAND Flash Report Years Considered
Figure 9. Global NAND Flash Market Size, (US$ Million), 2016 VS 2021 VS 2027
Figure 10. Global NAND Flash Market Size 2016-2027 (US$ Million)
Figure 11. Global NAND Flash Sales 2016-2027 (K Units)
Figure 12. Global NAND Flash Market Size Market Share by Region: 2021 Versus 2027
Figure 13. Global NAND Flash Sales Market Share Forecast by Region (2016-2027)
Figure 14. Global NAND Flash Revenue Market Share by Region (2016-2027)
Figure 15. Global NAND Flash Sales Share by Manufacturer in 2020
Figure 16. NAND Flash Market Share by Company Type (Tier 1, Tier 2 and Tier 3): 2016 VS 2020
Figure 17. Global NAND Flash Sales Market Share Forecast by Type (2016-2027)
Figure 18. Global NAND Flash Revenue Market Share Forecast by Type (2016-2027)
Figure 19. NAND Flash Average Selling Price (ASP) by Type (2016-2021) & (USD/Unit)
Figure 20. Global NAND Flash Sales Market Share Forecast by Application (2016-2027)
Figure 21. Global NAND Flash Revenue Market Share Forecast by Application (2016-2027)
Figure 22. NAND Flash Average Selling Price (ASP) by Application (2016-2021) & (USD/Unit)
Figure 23. North America NAND Flash Revenue 2016-2027 (US$ Million)
Figure 24. North America NAND Flash Sales Market Share by Type (2016-2021)
Figure 25. North America NAND Flash Sales Market Share by Application (2016-2021)
Figure 26. Asia-Pacific NAND Flash Revenue 2016-2027 (US$ Million)
Figure 27. Asia-Pacific NAND Flash Sales Market Share by Region (2016-2027)
Figure 28. Asia-Pacific NAND Flash Revenue Market Share by Region (2016-2027)
Figure 29. Asia-Pacific NAND Flash Sales Market Share by Type (2016-2021)
Figure 30. Asia-Pacific NAND Flash Sales Market Share by Application (2016-2021)
Figure 31. Europe NAND Flash Revenue Growth Rate 2016-2027 (US$ Million)
Figure 32. Europe NAND Flash Sales Market Share by Country (2016-2027)
Figure 33. Europe NAND Flash Revenue Market Share by Country (2016-2027)
Figure 34. Europe NAND Flash Sales Market Share by Type (2016-2021)
Figure 35. Europe NAND Flash Sales Market Share by Application (2016-2021)
Figure 36. Latin America NAND Flash Revenue Growth Rate 2016-2027 (US$ Million)
Figure 37. Latin America NAND Flash Sales Market Share by Country (2016-2027)
Figure 38. Latin America NAND Flash Revenue Market Share by Country (2016-2021)
Figure 39. Latin America NAND Flash Sales Market Share by Type (2016-2021)
Figure 40. Latin America NAND Flash Sales Market Share by Application (2016-2021)
Figure 41. Middle East and Africa NAND Flash Revenue Growth Rate 2016-2027 (US$ Million)
Figure 42. Middle East and Africa NAND Flash Sales Market Share by Country (2016-2027)
Figure 43. Middle East and Africa NAND Flash Revenue Market Share by Country (2016-2027)
Figure 44. Middle East and Africa NAND Flash Sales Market Share by Type (2016-2021)
Figure 45. Middle East and Africa NAND Flash Sales Market Share by Application (2016-2021)
Figure 46. NAND Flash Supply Chain (Upstream and Downstream Market)
Figure 47. Global Production Market Share of NAND Flash Raw Materials by Region in 2020
Figure 48. NAND Flash Distribution Channels
Figure 49. Global NAND Flash Percentage 2016-2027: Indirect Sales VS Direct Sales
Figure 50. Global NAND Flash Percentage 2016-2027: Online Sales VS Offline Sales
Figure 51. Porter's Five Forces Analysis
Figure 52. Bottom-up and Top-down Approaches for This Report
Figure 53. Data Triangulation
Figure 54. Key Executives Interviewed
$5900
$11800
HAVE A QUERY?
OUR CUSTOMER
