
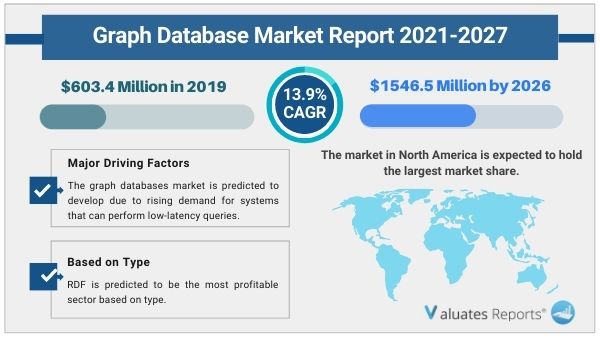
The global Graph Database market size is projected to reach US$ 1546.5 million by 2026, from US$ 603.4 million in 2019, at a CAGR of 13.9% during 2021-2026. An increase in graph database application areas, an increase in connected data penetration to optimize marketing performance, a surge in graph database software adoption in the healthcare sector, and a rise in the need for better response time and accuracy to discover new data correlations, among other factors, have all contributed to the graph database market's growth.
Furthermore, In comparison to other database solutions, graph database technology has a number of advantages for addressing issues that arise while analyzing large amounts of data. These benefits and methods can expand and manage massive data sets. These characteristics are projected to propel the graph database market forward over the forecast period.
A graph database (GDB) is a database that represents and stores data using graph topologies for semantic queries with nodes, edges, and properties. The graph (or edge or relationship) is an important concept in the system, as it connects data items in the storage. The relationships enable data in the store to be immediately linked together and, in many circumstances, retrieved in a single operation.
The graph databases market is predicted to develop due to rising demand for systems that can perform low-latency queries. When it comes to storing vast amounts of connected data in a database that isn't designed for the purpose at hand, businesses face challenges. Instead of a sophisticated batch process on top of a legacy relational database, companies can utilize a real-time recommendation system built on top of a graph database capable of performing low-latency queries. By matching historical and session data, it can be used to query consumers' past purchases during an online visit in a way that outperforms traditional relational databases.
The expansion of the graph database market is projected to be aided by the emergence of open knowledge networks. To build usability across applications and interconnect many disciplines to create a cross-domain knowledge network, knowledge networks must have datasets, methodologies, and documentation. Several of the knowledge graphs in this information network are still proprietary, making their use by universities or researchers prohibitively expensive. As a result of this situation, academics, government officials, and business executives coined the phrase "open knowledge network" to define an open-source infrastructure that connects cross-domain data from relevant entities. An open knowledge graph that represents all of the world's knowledge in the form of entities and relationships. The open knowledge network is one of the ten major ideas presented by the National Science Foundation in the United States, and it is meant to drive the curation of accurate knowledge graphs/networks.
The use of graph databases has expanded during the COVID-19 epidemic. As a result of new habits like working from home and social distancing, the need for graph database solutions and services, as well as the building of digital infrastructures for large-scale technology deployments, has increased. As a result, the COVID-19 pandemic is projected to propel the graph database market forward.
During the projection period, North America is expected to have the biggest market share. The APAC area, on the other hand, is predicted to have the greatest CAGR. As a manufacturing powerhouse, APAC is expected to adopt graph database solutions and services extensively in order to reduce costs and export high-quality goods to other countries.
The BFSI is predicted to be the most profitable based on application. Increased regulatory scrutiny, more customer satisfaction, and benefits like risk management and customized solutions have all contributed to the BFSI sector's rise.
RDF is predicted to be the most profitable sector based on type. The capacity of RDF to focus on information arranged in a subject-predicate-object connection is credited with its growth.
In the competitive analysis section of the report, leading as well as prominent players of the global Graph Database market are broadly studied on the basis of key factors. The report offers comprehensive analysis and accurate statistics on revenue by the player for the period 2016-2021. It also offers detailed analysis supported by reliable statistics on price and revenue (global level) by players for the period 2016-2021.
|
Report Metric |
Details |
|
Report Name |
Graph Database Market |
|
The Market size value in 2019 |
603.4 Million USD |
|
The Revenue forecast in 2026 |
1546.5 Million USD |
|
Growth Rate |
CAGR of 13.9% from 2021 to 2026 |
|
Base year considered |
2019 |
|
Forecast period |
2021-2026 |
|
Forecast units |
Value (USD) |
|
Segments covered |
Type, End-User, Offerings, and Region |
|
Report coverage |
Revenue & volume forecast, company share, competitive landscape, growth factors, and trends |
|
Geographic regions covered |
North America, Europe, Asia Pacific, Latin America, Middle East &Africa |
|
Companies covered |
IBM, Microsoft, Oracle, AWS, Ontotext, Stardog, Arangodb, Sparcity Technologies, Bitnine, Objectivity, Cambridge Semantics, Fluree, Blazegraph, Memgraph others. |
Ans. The global Graph Database market size is projected to reach US$ 1546.5 million by 2026, from US$ 603.4 million in 2019,
Ans. IBM, Microsoft, Oracle, AWS, Ontotext, Stardog, Arangodb, Sparcity Technologies, Bitnine, Objectivity, Cambridge Semantics, Fluree, Blazegraph, Memgraph, others.
Ans. The global Graph Database market is expected to grow at a compound annual growth rate of 13.9% from 2021 to 2026.
Table of Contents
1 Report Overview
1.1 Study Scope
1.2 Market Analysis by Type
1.2.1 Global Graph Database Market Size Growth Rate by Type: 2016 VS 2021 VS 2027
1.2.2 RDF
1.2.3 Property Graph
1.3 Market by Application
1.3.1 Global Graph Database Market Share by Application: 2016 VS 2021 VS 2027
1.3.2 BFSI
1.3.3 Telecom and IT
1.3.4 Retail and E-commerce
1.3.5 Healthcare and Life Sciences
1.3.6 Manufacturing
1.3.7 Government and Public
1.3.8 Transportation and Logistics
1.3.9 Energy and Utilities
1.3.10 Others
1.4 Study Objectives
1.5 Years Considered
2 Global Growth Trends
2.1 Global Graph Database Market Perspective (2016-2027)
2.2 Graph Database Growth Trends by Regions
2.2.1 Graph Database Market Size by Regions: 2016 VS 2021 VS 2027
2.2.2 Graph Database Historic Market Share by Regions (2016-2021)
2.2.3 Graph Database Forecasted Market Size by Regions (2022-2027)
2.3 Graph Database Industry Dynamic
2.3.1 Graph Database Market Trends
2.3.2 Graph Database Market Drivers
2.3.3 Graph Database Market Challenges
2.3.4 Graph Database Market Restraints
3 Competition Landscape by Key Players
3.1 Global Top Graph Database Players by Revenue
3.1.1 Global Top Graph Database Players by Revenue (2016-2021)
3.1.2 Global Graph Database Revenue Market Share by Players (2016-2021)
3.2 Global Graph Database Market Share by Company Type (Tier 1, Tier 2 and Tier 3)
3.3 Players Covered: Ranking by Graph Database Revenue
3.4 Global Graph Database Market Concentration Ratio
3.4.1 Global Graph Database Market Concentration Ratio (CR5 and HHI)
3.4.2 Global Top 10 and Top 5 Companies by Graph Database Revenue in 2020
3.5 Graph Database Key Players Head office and Area Served
3.6 Key Players Graph Database Product Solution and Service
3.7 Date of Enter into Graph Database Market
3.8 Mergers & Acquisitions, Expansion Plans
4 Graph Database Breakdown Data by Type
4.1 Global Graph Database Historic Market Size by Type (2016-2021)
4.2 Global Graph Database Forecasted Market Size by Type (2022-2027)
5 Graph Database Breakdown Data by Application
5.1 Global Graph Database Historic Market Size by Application (2016-2021)
5.2 Global Graph Database Forecasted Market Size by Application (2022-2027)
6 North America
6.1 North America Graph Database Market Size (2016-2027)
6.2 North America Graph Database Market Size by Type
6.2.1 North America Graph Database Market Size by Type (2016-2021)
6.2.2 North America Graph Database Market Size by Type (2022-2027)
6.2.3 North America Graph Database Market Size by Type (2016-2027)
6.3 North America Graph Database Market Size by Application
6.3.1 North America Graph Database Market Size by Application (2016-2021)
6.3.2 North America Graph Database Market Size by Application (2022-2027)
6.3.3 North America Graph Database Market Size by Application (2016-2027)
6.4 North America Graph Database Market Size by Country
6.4.1 North America Graph Database Market Size by Country (2016-2021)
6.4.2 North America Graph Database Market Size by Country (2022-2027)
6.4.3 United States
6.4.4 Canada
7 Europe
7.1 Europe Graph Database Market Size (2016-2027)
7.2 Europe Graph Database Market Size by Type
7.2.1 Europe Graph Database Market Size by Type (2016-2021)
7.2.2 Europe Graph Database Market Size by Type (2022-2027)
7.2.3 Europe Graph Database Market Size by Type (2016-2027)
7.3 Europe Graph Database Market Size by Application
7.3.1 Europe Graph Database Market Size by Application (2016-2021)
7.3.2 Europe Graph Database Market Size by Application (2022-2027)
7.3.3 Europe Graph Database Market Size by Application (2016-2027)
7.4 Europe Graph Database Market Size by Country
7.4.1 Europe Graph Database Market Size by Country (2016-2021)
7.4.2 Europe Graph Database Market Size by Country (2022-2027)
7.4.3 Germany
7.4.4 France
7.4.5 U.K.
7.4.6 Italy
7.4.7 Russia
7.4.8 Nordic
8 Asia-Pacific
8.1 Asia-Pacific Graph Database Market Size (2016-2027)
8.2 Asia-Pacific Graph Database Market Size by Type
8.2.1 Asia-Pacific Graph Database Market Size by Type (2016-2021)
8.2.2 Asia-Pacific Graph Database Market Size by Type (2022-2027)
8.2.3 Asia-Pacific Graph Database Market Size by Type (2016-2027)
8.3 Asia-Pacific Graph Database Market Size by Application
8.3.1 Asia-Pacific Graph Database Market Size by Application (2016-2021)
8.3.2 Asia-Pacific Graph Database Market Size by Application (2022-2027)
8.3.3 Asia-Pacific Graph Database Market Size by Application (2016-2027)
8.4 Asia-Pacific Graph Database Market Size by Region
8.4.1 Asia-Pacific Graph Database Market Size by Region (2016-2021)
8.4.2 Asia-Pacific Graph Database Market Size by Region (2022-2027)
8.4.3 China
8.4.4 Japan
8.4.5 South Korea
8.4.6 Southeast Asia
8.4.7 India
8.4.8 Australia
9 Latin America
9.1 Latin America Graph Database Market Size (2016-2027)
9.2 Latin America Graph Database Market Size by Type
9.2.1 Latin America Graph Database Market Size by Type (2016-2021)
9.2.2 Latin America Graph Database Market Size by Type (2022-2027)
9.2.3 Latin America Graph Database Market Size by Type (2016-2027)
9.3 Latin America Graph Database Market Size by Application
9.3.1 Latin America Graph Database Market Size by Application (2016-2021)
9.3.2 Latin America Graph Database Market Size by Application (2022-2027)
9.3.3 Latin America Graph Database Market Size by Application (2016-2027)
9.4 Latin America Graph Database Market Size by Country
9.4.1 Latin America Graph Database Market Size by Country (2016-2021)
9.4.2 Latin America Graph Database Market Size by Country (2022-2027)
9.4.3 Mexico
9.4.4 Brazil
10 Middle East & Africa
10.1 Middle East & Africa Graph Database Market Size (2016-2027)
10.2 Middle East & Africa Graph Database Market Size by Type
10.2.1 Middle East & Africa Graph Database Market Size by Type (2016-2021)
10.2.2 Middle East & Africa Graph Database Market Size by Type (2022-2027)
10.2.3 Middle East & Africa Graph Database Market Size by Type (2016-2027)
10.3 Middle East & Africa Graph Database Market Size by Application
10.3.1 Middle East & Africa Graph Database Market Size by Application (2016-2021)
10.3.2 Middle East & Africa Graph Database Market Size by Application (2022-2027)
10.3.3 Middle East & Africa Graph Database Market Size by Application (2016-2027)
10.4 Middle East & Africa Graph Database Market Size by Country
10.4.1 Middle East & Africa Graph Database Market Size by Country (2016-2021)
10.4.2 Middle East & Africa Graph Database Market Size by Country (2022-2027)
10.4.3 Turkey
10.4.4 Saudi Arabia
10.4.5 UAE
11 Key Players Profiles
11.1 IBM
11.1.1 IBM Company Details
11.1.2 IBM Business Overview
11.1.3 IBM Graph Database Introduction
11.1.4 IBM Revenue in Graph Database Business (2016-2021)
11.1.5 IBM Recent Development
11.2 Microsoft
11.2.1 Microsoft Company Details
11.2.2 Microsoft Business Overview
11.2.3 Microsoft Graph Database Introduction
11.2.4 Microsoft Revenue in Graph Database Business (2016-2021)
11.2.5 Microsoft Recent Development
11.3 Oracle
11.3.1 Oracle Company Details
11.3.2 Oracle Business Overview
11.3.3 Oracle Graph Database Introduction
11.3.4 Oracle Revenue in Graph Database Business (2016-2021)
11.3.5 Oracle Recent Development
11.4 AWS
11.4.1 AWS Company Details
11.4.2 AWS Business Overview
11.4.3 AWS Graph Database Introduction
11.4.4 AWS Revenue in Graph Database Business (2016-2021)
11.4.5 AWS Recent Development
11.5 Neo4j
11.5.1 Neo4j Company Details
11.5.2 Neo4j Business Overview
11.5.3 Neo4j Graph Database Introduction
11.5.4 Neo4j Revenue in Graph Database Business (2016-2021)
11.5.5 Neo4j Recent Development
11.6 Orientdb
11.6.1 Orientdb Company Details
11.6.2 Orientdb Business Overview
11.6.3 Orientdb Graph Database Introduction
11.6.4 Orientdb Revenue in Graph Database Business (2016-2021)
11.6.5 Orientdb Recent Development
11.7 Teradata
11.7.1 Teradata Company Details
11.7.2 Teradata Business Overview
11.7.3 Teradata Graph Database Introduction
11.7.4 Teradata Revenue in Graph Database Business (2016-2021)
11.7.5 Teradata Recent Development
11.8 Tibco Software
11.8.1 Tibco Software Company Details
11.8.2 Tibco Software Business Overview
11.8.3 Tibco Software Graph Database Introduction
11.8.4 Tibco Software Revenue in Graph Database Business (2016-2021)
11.8.5 Tibco Software Recent Development
11.9 Franz
11.9.1 Franz Company Details
11.9.2 Franz Business Overview
11.9.3 Franz Graph Database Introduction
11.9.4 Franz Revenue in Graph Database Business (2016-2021)
11.9.5 Franz Recent Development
11.10 OpenLink Software
11.10.1 OpenLink Software Company Details
11.10.2 OpenLink Software Business Overview
11.10.3 OpenLink Software Graph Database Introduction
11.10.4 OpenLink Software Revenue in Graph Database Business (2016-2021)
11.10.5 OpenLink Software Recent Development
11.11 Marklogic
11.11.1 Marklogic Company Details
11.11.2 Marklogic Business Overview
11.11.3 Marklogic Graph Database Introduction
11.11.4 Marklogic Revenue in Graph Database Business (2016-2021)
11.11.5 Marklogic Recent Development
11.12 Tigergraph
11.12.1 Tigergraph Company Details
11.12.2 Tigergraph Business Overview
11.12.3 Tigergraph Graph Database Introduction
11.12.4 Tigergraph Revenue in Graph Database Business (2016-2021)
11.12.5 Tigergraph Recent Development
11.13 MongoDB
11.13.1 MongoDB Company Details
11.13.2 MongoDB Business Overview
11.13.3 MongoDB Graph Database Introduction
11.13.4 MongoDB Revenue in Graph Database Business (2016-2021)
11.13.5 MongoDB Recent Development
11.14 Cray
11.14.1 Cray Company Details
11.14.2 Cray Business Overview
11.14.3 Cray Graph Database Introduction
11.14.4 Cray Revenue in Graph Database Business (2016-2021)
11.14.5 Cray Recent Development
11.15 Datastax
11.15.1 Datastax Company Details
11.15.2 Datastax Business Overview
11.15.3 Datastax Graph Database Introduction
11.15.4 Datastax Revenue in Graph Database Business (2016-2021)
11.15.5 Datastax Recent Development
11.16 Ontotext
11.16.1 Ontotext Company Details
11.16.2 Ontotext Business Overview
11.16.3 Ontotext Graph Database Introduction
11.16.4 Ontotext Revenue in Graph Database Business (2016-2021)
11.16.5 Ontotext Recent Development
11.17 Stardog
11.17.1 Stardog Company Details
11.17.2 Stardog Business Overview
11.17.3 Stardog Graph Database Introduction
11.17.4 Stardog Revenue in Graph Database Business (2016-2021)
11.17.5 Stardog Recent Development
11.18 Arangodb
11.18.1 Arangodb Company Details
11.18.2 Arangodb Business Overview
11.18.3 Arangodb Graph Database Introduction
11.18.4 Arangodb Revenue in Graph Database Business (2016-2021)
11.18.5 Arangodb Recent Development
11.18 Sparcity Technologies
11.25.1 Sparcity Technologies Company Details
11.25.2 Sparcity Technologies Business Overview
11.25.3 Sparcity Technologies Graph Database Introduction
11.25.4 Sparcity Technologies Revenue in Graph Database Business (2016-2021)
11.25.5 Sparcity Technologies Recent Development
11.20 Bitnine
11.20.1 Bitnine Company Details
11.20.2 Bitnine Business Overview
11.20.3 Bitnine Graph Database Introduction
11.20.4 Bitnine Revenue in Graph Database Business (2016-2021)
11.20.5 Bitnine Recent Development
11.21 Objectivity
11.21.1 Objectivity Company Details
11.21.2 Objectivity Business Overview
11.21.3 Objectivity Graph Database Introduction
11.21.4 Objectivity Revenue in Graph Database Business (2016-2021)
11.21.5 Objectivity Recent Development
11.22 Cambridge Semantics
11.22.1 Cambridge Semantics Company Details
11.22.2 Cambridge Semantics Business Overview
11.22.3 Cambridge Semantics Graph Database Introduction
11.22.4 Cambridge Semantics Revenue in Graph Database Business (2016-2021)
11.22.5 Cambridge Semantics Recent Development
11.23 Fluree
11.23.1 Fluree Company Details
11.23.2 Fluree Business Overview
11.23.3 Fluree Graph Database Introduction
11.23.4 Fluree Revenue in Graph Database Business (2016-2021)
11.23.5 Fluree Recent Development
11.24 Blazegraph
11.24.1 Blazegraph Company Details
11.24.2 Blazegraph Business Overview
11.24.3 Blazegraph Graph Database Introduction
11.24.4 Blazegraph Revenue in Graph Database Business (2016-2021)
11.24.5 Blazegraph Recent Development
11.25 Memgraph
11.25.1 Memgraph Company Details
11.25.2 Memgraph Business Overview
11.25.3 Memgraph Graph Database Introduction
11.25.4 Memgraph Revenue in Graph Database Business (2016-2021)
11.25.5 Memgraph Recent Development
12 Analyst's Viewpoints/Conclusions
13 Appendix
13.1 Research Methodology
13.1.1 Methodology/Research Approach
13.1.2 Data Source
13.2 Disclaimer
13.3 Author Details
List of Tables
Table 1. Global Graph Database Market Size Growth Rate by Type (US$ Million):2016 VS 2021 VS 2027
Table 2. Key Players of RDF
Table 3. Key Players of Property Graph
Table 4. Global Graph Database Market Size Growth by Application (US$ Million): 2016 VS 2021 VS 2027
Table 5. Global Graph Database Market Size by Regions (US$ Million): 2016 VS 2021 VS 2027
Table 6. Global Graph Database Market Size by Regions (2016-2021) & (US$ Million)
Table 7. Global Graph Database Market Share by Regions (2016-2021)
Table 8. Global Graph Database Forecasted Market Size by Regions (2022-2027) & (US$ Million)
Table 9. Global Graph Database Market Share by Regions (2022-2027)
Table 10. Graph Database Market Trends
Table 11. Graph Database Market Drivers
Table 12. Graph Database Market Challenges
Table 13. Graph Database Market Restraints
Table 14. Global Graph Database Revenue by Players (2016-2021) & (US$ Million)
Table 15. Global Graph Database Market Share by Players (2016-2021)
Table 16. Global Top Graph Database Players by Company Type (Tier 1, Tier 2 and Tier 3) (based on the Revenue in Graph Database as of 2020)
Table 17. Ranking of Global Top Graph Database Companies by Revenue (US$ Million) in 2020
Table 18. Global 5 Largest Players Market Share by Graph Database Revenue (CR5 and HHI) & (2016-2021)
Table 19. Key Players Headquarters and Area Served
Table 20. Key Players Graph Database Product Solution and Service
Table 21. Date of Enter into Graph Database Market
Table 22. Mergers & Acquisitions, Expansion Plans
Table 23. Global Graph Database Market Size by Type (2016-2021) (US$ Million)
Table 24. Global Graph Database Revenue Market Share by Type (2016-2021)
Table 25. Global Graph Database Forecasted Market Size by Type (2022-2027) (US$ Million)
Table 26. Global Graph Database Revenue Market Share by Type (2022-2027) & (US$ Million)
Table 27. Global Graph Database Market Size Share by Application (2016-2021) & (US$ Million)
Table 28. Global Graph Database Revenue Market Share by Application (2016-2021)
Table 29. Global Graph Database Forecasted Market Size by Application (2022-2027) (US$ Million)
Table 30. Global Graph Database Revenue Market Share by Application (2022-2027) & (US$ Million)
Table 31. North America Graph Database Market Size by Type (2016-2021) (US$ Million)
Table 32. North America Graph Database Market Size by Type (2022-2027) & (US$ Million)
Table 33. North America Graph Database Market Size by Application (2016-2021) (US$ Million)
Table 34. North America Graph Database Market Size by Application (2022-2027) & (US$ Million)
Table 35. North America Graph Database Market Size by Country (2016-2021) & (US$ Million)
Table 36. North America Graph Database Market Size by Country (2022-2027) & (US$ Million)
Table 37. Europe Graph Database Market Size by Type (2016-2021) (US$ Million)
Table 38. Europe Graph Database Market Size by Type (2022-2027) & (US$ Million)
Table 39. Europe Graph Database Market Size by Application (2016-2021) (US$ Million)
Table 40. Europe Graph Database Market Size by Application (2022-2027) & (US$ Million)
Table 41. Europe Graph Database Market Size by Country (2016-2021) & (US$ Million)
Table 42. Europe Graph Database Market Size by Country (2022-2027) & (US$ Million)
Table 43. Asia-Pacific Graph Database Market Size by Type (2016-2021) (US$ Million)
Table 44. Asia-Pacific Graph Database Market Size by Type (2022-2027) & (US$ Million)
Table 45. Asia-Pacific Graph Database Market Size by Application (2016-2021) (US$ Million)
Table 46. Asia-Pacific Graph Database Market Size by Application (2022-2027) & (US$ Million)
Table 47. Asia-Pacific Graph Database Market Size by Region (2016-2021) & (US$ Million)
Table 48. Asia-Pacific Graph Database Market Size by Region (2022-2027) & (US$ Million)
Table 49. Latin America Graph Database Market Size by Type (2016-2021) (US$ Million)
Table 50. Latin America Graph Database Market Size by Type (2022-2027) & (US$ Million)
Table 51. Latin America Graph Database Market Size by Application (2016-2021) (US$ Million)
Table 52. Latin America Graph Database Market Size by Application (2022-2027) & (US$ Million)
Table 53. Latin America Graph Database Market Size by Country (2016-2021) & (US$ Million)
Table 54. Latin America Graph Database Market Size by Country (2022-2027) & (US$ Million)
Table 55. Middle East & Africa Graph Database Market Size by Type (2016-2021) (US$ Million)
Table 56. Middle East & Africa Graph Database Market Size by Type (2022-2027) & (US$ Million)
Table 57. Middle East & Africa Graph Database Market Size by Application (2016-2021) (US$ Million)
Table 58. Middle East & Africa Graph Database Market Size by Application (2022-2027) & (US$ Million)
Table 59. Middle East & Africa Graph Database Market Size by Country (2016-2021) & (US$ Million)
Table 60. Middle East & Africa Graph Database Market Size by Country (2022-2027) & (US$ Million)
Table 61. IBM Company Details
Table 62. IBM Business Overview
Table 63. IBM Graph Database Product
Table 64. IBM Revenue in Graph Database Business (2016-2021) & (US$ Million)
Table 65. IBM Recent Development
Table 66. Microsoft Company Details
Table 67. Microsoft Business Overview
Table 68. Microsoft Graph Database Product
Table 69. Microsoft Revenue in Graph Database Business (2016-2021) & (US$ Million)
Table 70. Microsoft Recent Development
Table 71. Oracle Company Details
Table 72. Oracle Business Overview
Table 73. Oracle Graph Database Product
Table 74. Oracle Revenue in Graph Database Business (2016-2021) & (US$ Million)
Table 75. Oracle Recent Development
Table 76. AWS Company Details
Table 77. AWS Business Overview
Table 78. AWS Graph Database Product
Table 79. AWS Revenue in Graph Database Business (2016-2021) & (US$ Million)
Table 80. AWS Recent Development
Table 81. Neo4j Company Details
Table 82. Neo4j Business Overview
Table 83. Neo4j Graph Database Product
Table 84. Neo4j Revenue in Graph Database Business (2016-2021) & (US$ Million)
Table 85. Neo4j Recent Development
Table 86. Orientdb Company Details
Table 87. Orientdb Business Overview
Table 88. Orientdb Graph Database Product
Table 89. Orientdb Revenue in Graph Database Business (2016-2021) & (US$ Million)
Table 90. Orientdb Recent Development
Table 91. Teradata Company Details
Table 92. Teradata Business Overview
Table 93. Teradata Graph Database Product
Table 94. Teradata Revenue in Graph Database Business (2016-2021) & (US$ Million)
Table 95. Teradata Recent Development
Table 96. Tibco Software Company Details
Table 97. Tibco Software Business Overview
Table 98. Tibco Software Revenue in Graph Database Business (2016-2021) & (US$ Million)
Table 99. Tibco Software Recent Development
Table 100. Franz Company Details
Table 101. Franz Business Overview
Table 102. Franz Graph Database Product
Table 103. Franz Revenue in Graph Database Business (2016-2021) & (US$ Million)
Table 104. Franz Recent Development
Table 105. OpenLink Software Company Details
Table 106. OpenLink Software Business Overview
Table 107. OpenLink Software Graph Database Product
Table 108. OpenLink Software Revenue in Graph Database Business (2016-2021) & (US$ Million)
Table 109. OpenLink Software Recent Development
Table 110. Marklogic Company Details
Table 111. Marklogic Business Overview
Table 112. Marklogic Graph Database Product
Table 113. Marklogic Revenue in Graph Database Business (2016-2021) & (US$ Million)
Table 114. Marklogic Recent Development
Table 115. Tigergraph Company Details
Table 116. Tigergraph Business Overview
Table 117. Tigergraph Graph Database Product
Table 118. Tigergraph Revenue in Graph Database Business (2016-2021) & (US$ Million)
Table 119. Tigergraph Recent Development
Table 120. MongoDB Company Details
Table 121. MongoDB Business Overview
Table 122. MongoDB Graph Database Product
Table 123. MongoDB Revenue in Graph Database Business (2016-2021) & (US$ Million)
Table 124. MongoDB Recent Development
Table 125. Cray Company Details
Table 126. Cray Business Overview
Table 127. Cray Graph Database Product
Table 128. Cray Revenue in Graph Database Business (2016-2021) & (US$ Million)
Table 129. Cray Recent Development
Table 130. Datastax Company Details
Table 131. Datastax Business Overview
Table 132. Datastax Graph Database Product
Table 133. Datastax Revenue in Graph Database Business (2016-2021) & (US$ Million)
Table 134. Datastax Recent Development
Table 135. Ontotext Company Details
Table 136. Ontotext Business Overview
Table 137. Ontotext Graph Database Product
Table 138. Ontotext Revenue in Graph Database Business (2016-2021) & (US$ Million)
Table 139. Ontotext Recent Development
Table 140. Stardog Company Details
Table 141. Stardog Business Overview
Table 142. Stardog Graph Database Product
Table 143. Stardog Revenue in Graph Database Business (2016-2021) & (US$ Million)
Table 144. Stardog Recent Development
Table 145. Arangodb Company Details
Table 146. Arangodb Business Overview
Table 147. Arangodb Graph Database Product
Table 148. Arangodb Revenue in Graph Database Business (2016-2021) & (US$ Million)
Table 149. Arangodb Recent Development
Table 150. Sparcity Technologies Company Details
Table 151. Sparcity Technologies Business Overview
Table 152. Sparcity Technologies Graph Database Product
Table 153. Sparcity Technologies Revenue in Graph Database Business (2016-2021) & (US$ Million)
Table 154. Sparcity Technologies Recent Development
Table 155. Bitnine Company Details
Table 156. Bitnine Business Overview
Table 157. Bitnine Graph Database Product
Table 158. Bitnine Revenue in Graph Database Business (2016-2021) & (US$ Million)
Table 159. Bitnine Recent Development
Table 160. Objectivity Company Details
Table 161. Objectivity Business Overview
Table 162. Objectivity Graph Database Product
Table 163. Objectivity Revenue in Graph Database Business (2016-2021) & (US$ Million)
Table 164. Objectivity Recent Development
Table 165. Cambridge Semantics Company Details
Table 166. Cambridge Semantics Business Overview
Table 167. Cambridge Semantics Graph Database Product
Table 168. Cambridge Semantics Revenue in Graph Database Business (2016-2021) & (US$ Million)
Table 169. Cambridge Semantics Recent Development
Table 170. Fluree Company Details
Table 171. Fluree Business Overview
Table 172. Fluree Graph Database Product
Table 173. Fluree Revenue in Graph Database Business (2016-2021) & (US$ Million)
Table 174. Fluree Recent Development
Table 175. Blazegraph Company Details
Table 176. Blazegraph Business Overview
Table 177. Blazegraph Graph DatabaseProduct
Table 178. Blazegraph Revenue in Graph Database Business (2016-2021) & (US$ Million)
Table 179. Blazegraph Recent Development
Table 180. Memgraph Company Details
Table 181. Memgraph Business Overview
Table 182. Memgraph Graph Database Product
Table 183. Memgraph Revenue in Graph Database Business (2016-2021) & (US$ Million)
Table 184. Memgraph Recent Development
Table 185. Research Programs/Design for This Report
Table 186. Key Data Information from Secondary Sources
Table 187. Key Data Information from Primary Sources
List of Figures
Figure 1. Global Graph Database Market Share by Type: 2020 VS 2027
Figure 2. RDF Features
Figure 3. Property Graph Features
Figure 4. Global Graph Database Market Share by Application: 2020 VS 2027
Figure 5. BFSI Case Studies
Figure 6. Telecom and IT Case Studies
Figure 7. Retail and E-commerce Case Studies
Figure 8. Healthcare and Life Sciences Case Studies
Figure 9. Manufacturing Case Studies
Figure 10. Government and Public Case Studies
Figure 11. Transportation and Logistics Case Studies
Figure 12. Energy and Utilities Case Studies
Figure 13. Others Case Studies
Figure 14. Graph Database Report Years Considered
Figure 15. Global Graph Database Market Size (US$ Million), Year-over-Year: 2016-2027
Figure 16. Global Graph Database Market Size (US$ Million), 2016 VS 2021 VS 2027
Figure 17. Global Graph Database Market Share by Regions: 2020 VS 2027
Figure 18. Global Graph Database Market Share by Regions (2022-2027)
Figure 19. Global Graph Database Market Share by Players in 2020
Figure 20. Global Top Graph Database Players by Company Type (Tier 1, Tier 2 and Tier 3) (based on the Revenue in Graph Database as of 2020
Figure 21. The Top 10 and 5 Players Market Share by Graph Database Revenue in 2020
Figure 22. Global Graph Database Revenue Market Share by Type (2016-2021)
Figure 23. Global Graph Database Revenue Market Share by Type (2022-2027)
Figure 24. North America Graph Database Market Size YoY Growth (2016-2027) & (US$ Million)
Figure 25. North America Graph Database Market Share by Type (2016-2027)
Figure 26. North America Graph Database Market Share by Application (2016-2027)
Figure 27. North America Graph Database Market Share by Country (2016-2027)
Figure 28. United States Graph Database Market Size YoY Growth (2016-2027) & (US$ Million)
Figure 29. Canada Graph Database Market Size YoY Growth (2016-2027) & (US$ Million)
Figure 30. Europe Graph Database Market Size YoY Growth (2016-2027) & (US$ Million)
Figure 31. Europe Graph Database Market Share by Type (2016-2027)
Figure 32. Europe Graph Database Market Share by Application (2016-2027)
Figure 33. Europe Graph Database Market Share by Country (2016-2027)
Figure 34. Germany Graph Database Market Size YoY Growth (2016-2027) & (US$ Million)
Figure 35. France Graph Database Market Size YoY Growth (2016-2027) & (US$ Million)
Figure 36. U.K. Graph Database Market Size YoY Growth (2016-2027) & (US$ Million)
Figure 37. Italy Graph Database Market Size YoY Growth (2016-2027) & (US$ Million)
Figure 38. Russia Graph Database Market Size YoY Growth (2016-2027) & (US$ Million)
Figure 39. Nordic Graph Database Market Size YoY Growth (2016-2027) & (US$ Million)
Figure 40. Asia-Pacific Graph Database Market Size YoY Growth (2016-2027) & (US$ Million)
Figure 41. Asia-Pacific Graph Database Market Share by Type (2016-2027)
Figure 42. Asia-Pacific Graph Database Market Share by Application (2016-2027)
Figure 43. Asia-Pacific Graph Database Market Share by Region (2016-2027)
Figure 44. China Graph Database Market Size YoY Growth (2016-2027) & (US$ Million)
Figure 45. Japan Graph Database Market Size YoY Growth (2016-2027) & (US$ Million)
Figure 46. South Korea Graph Database Market Size YoY Growth (2016-2027) & (US$ Million)
Figure 47. Southeast Asia Graph Database Market Size YoY Growth (2016-2027) & (US$ Million)
Figure 48. India Graph Database Market Size YoY Growth (2016-2027) & (US$ Million)
Figure 49. Australia Graph Database Market Size YoY Growth (2016-2027) & (US$ Million)
Figure 50. Latin America Graph Database Market Size YoY Growth (2016-2027) & (US$ Million)
Figure 51. Latin America Graph Database Market Share by Type (2016-2027)
Figure 52. Latin America Graph Database Market Share by Application (2016-2027)
Figure 53. Latin America Graph Database Market Share by Country (2016-2027)
Figure 54. Mexico Graph Database Market Size YoY Growth (2016-2027) & (US$ Million)
Figure 55. Brazil Graph Database Market Size YoY Growth (2016-2027) & (US$ Million)
Figure 56. Middle East & Africa Graph Database Market Size YoY Growth (2016-2027) & (US$ Million)
Figure 57. Middle East & Africa Graph Database Market Share by Type (2016-2027)
Figure 58. Middle East & Africa Graph Database Market Share by Application (2016-2027)
Figure 59. Middle East & Africa Graph Database Market Share by Country (2016-2027)
Figure 60. Turkey Graph Database Market Size YoY Growth (2016-2027) & (US$ Million)
Figure 61. Saudi Arabia Graph Database Market Size YoY Growth (2016-2027) & (US$ Million)
Figure 62. UAE Graph Database Market Size YoY Growth (2016-2027) & (US$ Million)
Figure 63. IBM Revenue Growth Rate in Graph Database Business (2016-2021)
Figure 64. Microsoft Revenue Growth Rate in Graph Database Business (2016-2021)
Figure 65. Oracle Revenue Growth Rate in Graph Database Business (2016-2021)
Figure 66. AWS Revenue Growth Rate in Graph Database Business (2016-2021)
Figure 67. Neo4j Revenue Growth Rate in Graph Database Business (2016-2021)
Figure 68. Orientdb Revenue Growth Rate in Graph Database Business (2016-2021)
Figure 69. Teradata Revenue Growth Rate in Graph Database Business (2016-2021)
Figure 70. Tibco Software Revenue Growth Rate in Graph Database Business (2016-2021)
Figure 71. Franz Revenue Growth Rate in Graph Database Business (2016-2021)
Figure 72. OpenLink Software Revenue Growth Rate in Graph Database Business (2016-2021)
Figure 73. Marklogic Revenue Growth Rate in Graph Database Business (2016-2021)
Figure 74. Tigergraph Revenue Growth Rate in Graph Database Business (2016-2021)
Figure 75. MongoDB Revenue Growth Rate in Graph Database Business (2016-2021)
Figure 76. Cray Revenue Growth Rate in Graph Database Business (2016-2021)
Figure 77. Datastax Revenue Growth Rate in Graph Database Business (2016-2021)
Figure 78. Ontotext Revenue Growth Rate in Graph Database Business (2016-2021)
Figure 79. Stardog Revenue Growth Rate in Graph Database Business (2016-2021)
Figure 80. Arangodb Revenue Growth Rate in Graph Database Business (2016-2021)
Figure 81. Sparcity Technologies Revenue Growth Rate in Graph Database Business (2016-2021)
Figure 82. Bitnine Revenue Growth Rate in Graph Database Business (2016-2021)
Figure 83. Objectivity Revenue Growth Rate in Graph Database Business (2016-2021)
Figure 84. Cambridge Semantics Revenue Growth Rate in Graph Database Business (2016-2021)
Figure 85. Fluree Revenue Growth Rate in Graph Database Business (2016-2021)
Figure 86. Blazegraph Revenue Growth Rate in Graph Database Business (2016-2021)
Figure 87. Memgraph Revenue Growth Rate in Graph Database Business (2016-2021)
Figure 88. Bottom-up and Top-down Approaches for This Report
Figure 89. Data Triangulation
Figure 90. Key Executives Interviewed
$3900
$5850
$7800
HAVE A QUERY?
OUR CUSTOMER

SIMILAR REPORTS