List of Tables
Table 1. Global Geographic Information System (GIS) Market Size Growth Rate by Type (US$ Million), 2017 VS 2021 VS 2028
Table 2. Key Players of Hardware (GIS Collector, Total Station, LIDAR)
Table 3. Key Players of Software
Table 4. Global Geographic Information System (GIS) Market Size Growth Rate by Application (US$ Million), 2017 VS 2021 VS 2028
Table 5. Global Geographic Information System (GIS) Market Size (US$ Million) by Region: 2017 VS 2021 VS 2028
Table 6. Global Geographic Information System (GIS) Revenue by Region (2017-2022) & (US$ Million)
Table 7. Global Geographic Information System (GIS) Revenue Market Share by Region (2017-2022)
Table 8. Global Geographic Information System (GIS) Revenue by Players (2017-2022) & (US$ Million)
Table 9. Global Geographic Information System (GIS) Market Share by Players (2017-2022)
Table 10. Global Top Geographic Information System (GIS) Players by Company Type (Tier 1, Tier 2, and Tier 3) & (based on the Revenue in Geographic Information System (GIS) as of 2021)
Table 11. Ranking of Global Top Geographic Information System (GIS) Companies by Revenue (US$ Million) in 2021
Table 12. Global 5 Largest Players Market Share by Geographic Information System (GIS) Revenue (CR5 and HHI) & (2017-2022)
Table 13. Key Players Headquarters and Area Served
Table 14. Key Players Geographic Information System (GIS) Product Solution and Service
Table 15. Date of Key Manufacturers Enter into Geographic Information System (GIS) Market
Table 16. Mergers & Acquisitions, Expansion Plans
Table 17. Global Geographic Information System (GIS) Market Size by Type (2017-2022) & (US$ Million)
Table 18. Global Geographic Information System (GIS) Revenue Market Share by Type (2017-2022)
Table 19. Global Geographic Information System (GIS) Forecasted Market Size by Type (2023-2028) & (US$ Million)
Table 20. Global Geographic Information System (GIS) Revenue Market Share by Type (2023-2028)
Table 21. Global Geographic Information System (GIS) Market Size by Application (2017-2022) & (US$ Million)
Table 22. Global Geographic Information System (GIS) Revenue Market Share by Application (2017-2022)
Table 23. Global Geographic Information System (GIS) Forecasted Market Size by Application (2023-2028) & (US$ Million)
Table 24. Global Geographic Information System (GIS) Revenue Market Share by Application (2023-2028)
Table 25. North America Geographic Information System (GIS) Revenue by Company (2020-2022) & (US$ Million)
Table 26. North America Geographic Information System (GIS) Revenue by Type (2017-2022) & (US$ Million)
Table 27. North America Geographic Information System (GIS) Revenue by Type (2023-2028) & (US$ Million)
Table 28. North America Geographic Information System (GIS) Revenue by Application (2017-2022) & (US$ Million)
Table 29. North America Geographic Information System (GIS) Revenue by Application (2023-2028) & (US$ Million)
Table 30. North America Geographic Information System (GIS) Revenue by Country (2017-2022) & (US$ Million)
Table 31. North America Geographic Information System (GIS) Revenue by Country (2023-2028) & (US$ Million)
Table 32. Europe Geographic Information System (GIS) Revenue by Company (2020-2022) & (US$ Million)
Table 33. Europe Geographic Information System (GIS) Revenue by Type (2017-2022) & (US$ Million)
Table 34. Europe Geographic Information System (GIS) Revenue by Type (2023-2028) & (US$ Million)
Table 35. Europe Geographic Information System (GIS) Revenue by Application (2017-2022) & (US$ Million)
Table 36. Europe Geographic Information System (GIS) Revenue by Application (2023-2028) & (US$ Million)
Table 37. Europe Geographic Information System (GIS) Revenue by Country (2017-2022) & (US$ Million)
Table 38. Europe Geographic Information System (GIS) Revenue by Country (2023-2028) & (US$ Million)
Table 39. Asia Pacific Geographic Information System (GIS) Revenue by Company (2020-2022) & (US$ Million)
Table 40. Asia Pacific Geographic Information System (GIS) Revenue by Type (2017-2022) & (US$ Million)
Table 41. Asia Pacific Geographic Information System (GIS) Revenue by Type (2023-2028) & (US$ Million)
Table 42. Asia Pacific Geographic Information System (GIS) Revenue by Application (2017-2022) & (US$ Million)
Table 43. Asia Pacific Geographic Information System (GIS) Revenue by Application (2023-2028) & (US$ Million)
Table 44. Asia Pacific Geographic Information System (GIS) Revenue by Region (2017-2022) & (US$ Million)
Table 45. Asia Pacific Geographic Information System (GIS) Revenue by Region (2023-2028) & (US$ Million)
Table 46. Latin America Geographic Information System (GIS) Revenue by Company (2020-2022) & (US$ Million)
Table 47. Latin America Geographic Information System (GIS) Revenue by Type (2017-2022) & (US$ Million)
Table 48. Latin America Geographic Information System (GIS) Revenue by Type (2023-2028) & (US$ Million)
Table 49. Latin America Geographic Information System (GIS) Revenue by Application (2017-2022) & (US$ Million)
Table 50. Latin America Geographic Information System (GIS) Revenue by Application (2023-2028) & (US$ Million)
Table 51. Latin America Geographic Information System (GIS) Revenue by Country (2017-2022) & (US$ Million)
Table 52. Latin America Geographic Information System (GIS) Revenue by Country (2023-2028) & (US$ Million)
Table 53. Middle East and Africa Geographic Information System (GIS) Revenue by Company (2020-2022) & (US$ Million)
Table 54. Middle East and Africa Geographic Information System (GIS) Revenue by Type (2017-2022) & (US$ Million)
Table 55. Middle East and Africa Geographic Information System (GIS) Revenue by Type (2023-2028) & (US$ Million)
Table 56. Middle East and Africa Geographic Information System (GIS) Revenue by Application (2017-2022) & (US$ Million)
Table 57. Middle East and Africa Geographic Information System (GIS) Revenue by Application (2023-2028) & (US$ Million)
Table 58. Middle East and Africa Geographic Information System (GIS) Revenue by Country (2017-2022) & (US$ Million)
Table 59. Middle East and Africa Geographic Information System (GIS) Revenue by Country (2023-2028) & (US$ Million)
Table 60. Hexagon Company Details
Table 61. Hexagon Business Overview
Table 62. Hexagon Geographic Information System (GIS) Product and Services
Table 63. Hexagon Geographic Information System (GIS) Revenue in Geographic Information System (GIS) Business (2017-2022) & (US$ Million)
Table 64. Hexagon Geographic Information System (GIS) SWOT Analysis
Table 65. Hexagon Recent Developments
Table 66. Topcon Company Details
Table 67. Topcon Business Overview
Table 68. Topcon Geographic Information System (GIS) Product and Services
Table 69. Topcon Geographic Information System (GIS) Revenue in Geographic Information System (GIS) Business (2017-2022) & (US$ Million)
Table 70. Topcon Geographic Information System (GIS) SWOT Analysis
Table 71. Topcon Recent Developments
Table 72. Trimble Company Details
Table 73. Trimble Business Overview
Table 74. Trimble Geographic Information System (GIS) Product and Services
Table 75. Trimble Geographic Information System (GIS) Revenue in Geographic Information System (GIS) Business (2017-2022) & (US$ Million)
Table 76. Trimble Geographic Information System (GIS) SWOT Analysis
Table 77. Trimble Recent Developments
Table 78. Autodesk Company Details
Table 79. Autodesk Business Overview
Table 80. Autodesk Geographic Information System (GIS) Product and Services
Table 81. Autodesk Geographic Information System (GIS) Revenue in Geographic Information System (GIS) Business (2017-2022) & (US$ Million)
Table 82. Autodesk Geographic Information System (GIS) SWOT Analysis
Table 83. Autodesk Recent Developments
Table 84. Environmental Systems Research Institute Company Details
Table 85. Environmental Systems Research Institute Business Overview
Table 86. Environmental Systems Research Institute Geographic Information System (GIS) Product and Services
Table 87. Environmental Systems Research Institute Geographic Information System (GIS) Revenue in Geographic Information System (GIS) Business (2017-2022) & (US$ Million)
Table 88. Environmental Systems Research Institute Geographic Information System (GIS) SWOT Analysis
Table 89. Environmental Systems Research Institute Recent Developments
Table 90. Bentley Systems Company Details
Table 91. Bentley Systems Business Overview
Table 92. Bentley Systems Geographic Information System (GIS) Product and Services
Table 93. Bentley Systems Geographic Information System (GIS) Revenue in Geographic Information System (GIS) Business (2017-2022) & (US$ Million)
Table 94. Bentley Systems Geographic Information System (GIS) SWOT Analysis
Table 95. Bentley Systems Recent Developments
Table 96. Caliper Company Details
Table 97. Caliper Business Overview
Table 98. Caliper Geographic Information System (GIS) Product and Services
Table 99. Caliper Geographic Information System (GIS) Revenue in Geographic Information System (GIS) Business (2017-2022) & (US$ Million)
Table 100. Caliper Geographic Information System (GIS) SWOT Analysis
Table 101. Caliper Recent Developments
Table 102. Computer Aided Development Company Details
Table 103. Computer Aided Development Business Overview
Table 104. Computer Aided Development Geographic Information System (GIS) Product and Services
Table 105. Computer Aided Development Geographic Information System (GIS) Revenue in Geographic Information System (GIS) Business (2017-2022) & (US$ Million)
Table 106. Computer Aided Development Geographic Information System (GIS) SWOT Analysis
Table 107. Computer Aided Development Recent Developments
Table 108. Pitney Bowes Company Details
Table 109. Pitney Bowes Business Overview
Table 110. Pitney Bowes Geographic Information System (GIS) Product and Services
Table 111. Pitney Bowes Geographic Information System (GIS) Revenue in Geographic Information System (GIS) Business (2017-2022) & (US$ Million)
Table 112. Pitney Bowes Geographic Information System (GIS) SWOT Analysis
Table 113. Pitney Bowes Recent Developments
Table 114. Hi-Target Surveying Instrument Company Details
Table 115. Hi-Target Surveying Instrument Business Overview
Table 116. Hi-Target Surveying Instrument Geographic Information System (GIS) Product and Services
Table 117. Hi-Target Surveying Instrument Geographic Information System (GIS) Revenue in Geographic Information System (GIS) Business (2017-2022) & (US$ Million)
Table 118. Hi-Target Surveying Instrument Geographic Information System (GIS) SWOT Analysis
Table 119. Hi-Target Surveying Instrument Recent Developments
Table 120. Macdonald, Dettwiler And Associates Company Details
Table 121. Macdonald, Dettwiler And Associates Business Overview
Table 122. Macdonald, Dettwiler And Associates Geographic Information System (GIS) Product and Services
Table 123. Macdonald, Dettwiler And Associates Geographic Information System (GIS) Revenue in Geographic Information System (GIS) Business (2017-2022) & (US$ Million)
Table 124. Macdonald, Dettwiler And Associates Recent Developments
Table 125. General Electric Company Details
Table 126. General Electric Business Overview
Table 127. General Electric Geographic Information System (GIS) Product and Services
Table 128. General Electric Geographic Information System (GIS) Revenue in Geographic Information System (GIS) Business (2017-2022) & (US$ Million)
Table 129. General Electric Recent Developments
Table 130. Geographic Information System (GIS) Market Trends
Table 131. Geographic Information System (GIS) Market Drivers
Table 132. Geographic Information System (GIS) Market Challenges
Table 133. Geographic Information System (GIS) Market Restraints
Table 134. Research Programs/Design for This Report
Table 135. Key Data Information from Secondary Sources
Table 136. Key Data Information from Primary Sources
List of Figures
Figure 1. Global Geographic Information System (GIS) Sales Market Share by Type: 2021 VS 2028
Figure 2. Hardware (GIS Collector, Total Station, LIDAR) Features
Figure 3. Software Features
Figure 4. Global Geographic Information System (GIS) Sales Market Share by Application: 2021 VS 2028
Figure 5. Oil And Gas Case Studies
Figure 6. The Construction Of Case Studies
Figure 7. Mining Case Studies
Figure 8. Transport Case Studies
Figure 9. Public Utilities Case Studies
Figure 10. Other Case Studies
Figure 11. Geographic Information System (GIS) Report Years Considered
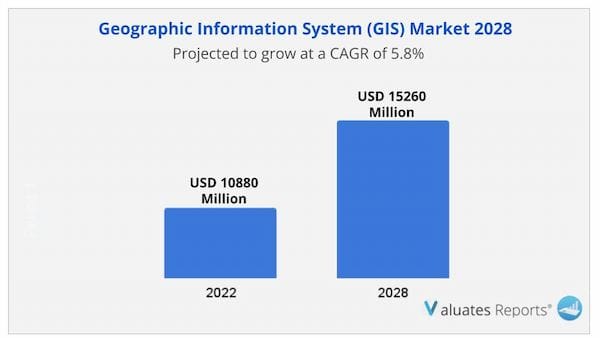
Figure 12. Global Geographic Information System (GIS) Revenue, (US$ Million), 2017 VS 2021 VS 2028
Figure 13. Global Geographic Information System (GIS) Market Size 2017-2028 (US$ Million)
Figure 14. Global Geographic Information System (GIS) Market Size Market Share by Region: 2021 VS 2028
Figure 15. Global Geographic Information System (GIS) Revenue Market Share by Region in 2017 VS 2022
Figure 16. Global Top 10 Geographic Information System (GIS) Countries Ranking by Market Size (US$ Million) in 2021
Figure 17. Global Geographic Information System (GIS) Market Share by Players in 2021
Figure 18. Global Top Geographic Information System (GIS) Players by Company Type (Tier 1, Tier 2, and Tier 3) & (based on the Revenue in Geographic Information System (GIS) as of 2021)
Figure 19. The Top 10 and 5 Players Market Share by Geographic Information System (GIS) Revenue in 2021
Figure 20. North America Geographic Information System (GIS) Revenue Market Share by Company in 2021
Figure 21. North America Geographic Information System (GIS) Revenue Market Share by Type (2017-2028)
Figure 22. North America Geographic Information System (GIS) Revenue Market Share by Application (2017-2028)
Figure 23. North America Geographic Information System (GIS) Revenue Share by Country (2017-2028)
Figure 24. U.S. Geographic Information System (GIS) Revenue (2017-2028) & (US$ Million)
Figure 25. Canada Geographic Information System (GIS) Revenue (2017-2028) & (US$ Million)
Figure 26. Europe Geographic Information System (GIS) Revenue Market Share by Company in 2021
Figure 27. Europe Geographic Information System (GIS) Revenue Market Share by Type (2017-2028)
Figure 28. Europe Geographic Information System (GIS) Revenue Market Share by Application (2017-2028)
Figure 29. Europe Geographic Information System (GIS) Revenue Share by Country (2017-2028)
Figure 30. Germany Geographic Information System (GIS) Revenue (2017-2028) & (US$ Million)
Figure 31. France Geographic Information System (GIS) Revenue (2017-2028) & (US$ Million)
Figure 32. U.K. Geographic Information System (GIS) Revenue (2017-2028) & (US$ Million)
Figure 33. Italy Geographic Information System (GIS) Revenue (2017-2028) & (US$ Million)
Figure 34. Russia Geographic Information System (GIS) Revenue (2017-2028) & (US$ Million)
Figure 35. Asia Pacific Geographic Information System (GIS) Revenue Market Share by Company in 2021
Figure 36. Asia Pacific Geographic Information System (GIS) Revenue Market Share by Type (2017-2028)
Figure 37. Asia Pacific Geographic Information System (GIS) Revenue Market Share by Application (2017-2028)
Figure 38. Asia Pacific Geographic Information System (GIS) Revenue Share by Region (2017-2028)
Figure 39. China Geographic Information System (GIS) Revenue (2017-2028) & (US$ Million)
Figure 40. Japan Geographic Information System (GIS) Revenue (2017-2028) & (US$ Million)
Figure 41. South Korea Geographic Information System (GIS) Revenue (2017-2028) & (US$ Million)
Figure 42. India Geographic Information System (GIS) Revenue (2017-2028) & (US$ Million)
Figure 43. Australia Geographic Information System (GIS) Revenue (2017-2028) & (US$ Million)
Figure 44. Taiwan Geographic Information System (GIS) Revenue (2017-2028) & (US$ Million)
Figure 45. Indonesia Geographic Information System (GIS) Revenue (2017-2028) & (US$ Million)
Figure 46. Thailand Geographic Information System (GIS) Revenue (2017-2028) & (US$ Million)
Figure 47. Malaysia Geographic Information System (GIS) Revenue (2017-2028) & (US$ Million)
Figure 48. Philippines Geographic Information System (GIS) Revenue (2017-2028) & (US$ Million)
Figure 49. Vietnam Geographic Information System (GIS) Revenue (2017-2028) & (US$ Million)
Figure 50. Latin America Geographic Information System (GIS) Revenue Market Share by Company in 2021
Figure 51. Latin America Geographic Information System (GIS) Revenue Market Share by Type (2017-2028)
Figure 52. Latin America Geographic Information System (GIS) Revenue Market Share by Application (2017-2028)
Figure 53. Latin America Geographic Information System (GIS) Revenue Share by Country (2017-2028)
Figure 54. Mexico Geographic Information System (GIS) Revenue (2017-2028) & (US$ Million)
Figure 55. Brazil Geographic Information System (GIS) Revenue (2017-2028) & (US$ Million)
Figure 56. Argentina Geographic Information System (GIS) Revenue (2017-2028) & (US$ Million)
Figure 57. Middle East and Africa Geographic Information System (GIS) Revenue Market Share by Company in 2021
Figure 58. Middle East and Africa Geographic Information System (GIS) Revenue Market Share by Type (2017-2028)
Figure 59. Middle East and Africa Geographic Information System (GIS) Revenue Market Share by Application (2017-2028)
Figure 60. Middle East and Africa Geographic Information System (GIS) Revenue Share by Country (2017-2028)
Figure 61. Turkey Geographic Information System (GIS) Revenue (2017-2028) & (US$ Million)
Figure 62. Saudi Arabia Geographic Information System (GIS) Revenue (2017-2028) & (US$ Million)
Figure 63. UAE Geographic Information System (GIS) Revenue (2017-2028) & (US$ Million)
Figure 64. Hexagon Revenue Growth Rate in Geographic Information System (GIS) Business (2017-2022)
Figure 65. Topcon Revenue Growth Rate in Geographic Information System (GIS) Business (2017-2022)
Figure 66. Trimble Revenue Growth Rate in Geographic Information System (GIS) Business (2017-2022)
Figure 67. Autodesk Revenue Growth Rate in Geographic Information System (GIS) Business (2017-2022)
Figure 68. Environmental Systems Research Institute Revenue Growth Rate in Geographic Information System (GIS) Business (2017-2022)
Figure 69. Bentley Systems Revenue Growth Rate in Geographic Information System (GIS) Business (2017-2022)
Figure 70. Caliper Revenue Growth Rate in Geographic Information System (GIS) Business (2017-2022)
Figure 71. Computer Aided Development Revenue Growth Rate in Geographic Information System (GIS) Business (2017-2022)
Figure 72. Pitney Bowes Revenue Growth Rate in Geographic Information System (GIS) Business (2017-2022)
Figure 73. Hi-Target Surveying Instrument Revenue Growth Rate in Geographic Information System (GIS) Business (2017-2022)
Figure 74. Macdonald, Dettwiler And Associates Revenue Growth Rate in Geographic Information System (GIS) Business (2017-2022)
Figure 75. General Electric Revenue Growth Rate in Geographic Information System (GIS) Business (2017-2022)
Figure 76. Bottom-up and Top-down Approaches for This Report
Figure 77. Data Triangulation
Figure 78. Key Executives Interviewed