
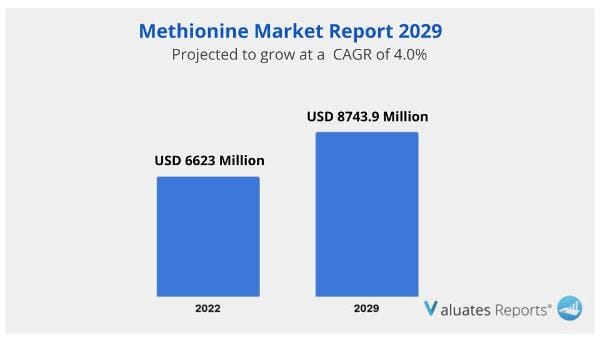
The global Methionine market was valued at US$ 6623 million in 2022 and is anticipated to reach US$ 8743.9 million by 2029, witnessing a CAGR of 4.0% during the forecast period 2023-2029. Key drivers of the Methionine market include the ever-increasing poultry industry due to growing meat consumption and the rise in animal disease outbreaks. Moreover, rising dietary supplements and increasing awareness of consumers regarding a healthy lifestyle are also expected to drive the methionine market in the coming years. Further, the rising consumption of sports supplements for increasing athletic performance and muscle mass will drive market growth during the forecast period.
Growing meat consumption and preference for frozen foods
Increasing meat consumption has led to the demand for the poultry industry across the globe. Methionine helps in livestock and cattle development. It is used as a feed additive to assist metabolism, growth, and muscle development in animals. The chemical compound also enhances the rate at which these animals utilize and break down proteins. It improves the digestive tract, enhances performance in heat stress and lowers nitrogen excretion. Methionine is basically a raw material given in the animal feed industry in order to meet their nutritional requirements. In addition to it processed and ready to eat meals especially frozen foods are growing in popularity as consumers are becoming more busy than ever leading to rise in freezer and microwave cooking which is further expanding the market. Thus growing meat consumption and preference for frozen foods is expanding the poultry industry ultimately propelling the growth of the methanione market.
Rising dietary supplements and awareness regarding healthy lifestyle
Methanione is an essential amino acid which is taken as a dietary supplement in order to fight infections and disorders. The increasing consumer awareness regarding healthy lifestyle and growing geriatric population is increasing the market growth. Methanione helps in treating liver disorders, increases acidity of urine , improves wound healing and prevents acetaminophen poisoning( Tylenol). It is required for tissue repair, improves elasticity and tone of skin, hair and removes hazardous compounds like heavy metals from our bodies. Also methanione is used in the pharmaceutical industry to reduce intestinal oxidative stress, enhance immune system, increase crypt cells, goblet cells and improve the intestinal structure. Thus rising health awareness is leading to growing adoption which is driving the methanione market growth during the forecast period.
Rising consumption of sports supplement
Sport supplements are gaining popularity across the globe and is being used increasingly by athletes and bodybuilders to enhance their performance and strength. Supplements in the form of energy drinks, weight loss meals, low carbohydrate foods, nutrition bars, weight loss pills are gaining wide acceptance leading to the growing demand for methanione. Thus widescale acceptance and consumption of sport supplements is leading to the expansion of the methanione market globally.
Based on application, feed additive is expected to provide lucrative opportunities for growth in the methanione market share during the forecast period due to extensive usage in the cattle, poultry, swine and aquaculture industry as an animal feed.
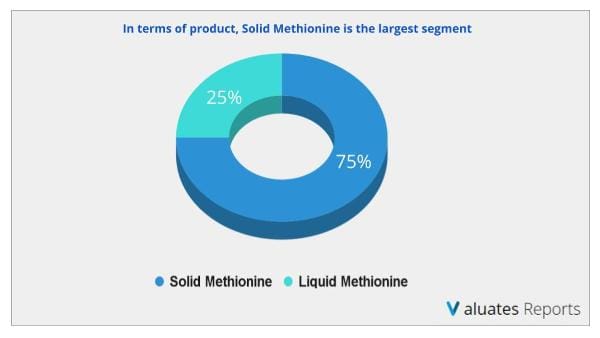
Based on type, solid methanione is expected to provide lucrative opportunities for growth in the methanione market share during the forecast period with a share of about 75%.
Based on region, Europe is expected to provide lucrative opportunities for growth in the methanione market share and will dominate with a share of over 40% followed by Japan, North America with a total share of 35%.
Global Methionine key players include Evonik, Adisseo (Bluestar), NOVUS, etc. Global top three manufacturers hold a share nearly 75%.
| Report Metric | Details |
| Report Name | Methionine Market |
| The market size in 2022 | USD 6623 Million |
| The revenue forecast in 2029 | USD 8743.9 Million |
| Growth Rate | Compound Annual Growth Rate (CAGR) of 4.0% from 2023 to 2029 |
| Market size available for years | 2023-2029 |
| Forecast units | Value (USD) |
| Segments covered | By Service, Industry, Traveler, Regions |
| Report coverage | Revenue & volume forecast, company share, competitive landscape, growth factors, and trends |
| Geographic regions covered | North America, Europe, Asia Pacific, Latin America, Middle East & Africa |
Ans. The global Methionine market was valued at US$ 6623 million in 2022 and is anticipated to reach US$ 8743.9 million by 2029
Ans. The global Methionine market is expected to grow at a compound annual growth rate of 4.0% from 2023 to 2029.
Ans. Global Methionine key players include Evonik, Adisseo (Bluestar), NOVUS, etc. Global top three manufacturers hold a share nearly 75%.
Ans. In terms of product, Solid Methionine is the largest segment, with a share about 75%.
Ans. In terms of application, the largest application is Feed Additive, followed by Pharmaceutical, Food Supplement, etc.
Ans. Europe is the largest market, with a share over 40%, followed by Japan, and North America, both have a share about 35 percent.
1 Methionine Market Overview
1.1 Product Definition
1.2 Methionine Segment by Type
1.2.1 Global Methionine Market Value Growth Rate Analysis by Type 2022 VS 2029
1.2.2 Solid Methionine
1.2.3 Liquid Methionine
1.3 Methionine Segment by Application
1.3.1 Global Methionine Market Value Growth Rate Analysis by Application: 2022 VS 2029
1.3.2 Feed
1.3.3 Pharmaceutical
1.3.4 Food
1.3.5 Others
1.4 Global Market Growth Prospects
1.4.1 Global Methionine Production Value Estimates and Forecasts (2018-2029)
1.4.2 Global Methionine Production Capacity Estimates and Forecasts (2018-2029)
1.4.3 Global Methionine Production Estimates and Forecasts (2018-2029)
1.4.4 Global Methionine Market Average Price Estimates and Forecasts (2018-2029)
1.5 Assumptions and Limitations
2 Market Competition by Manufacturers
2.1 Global Methionine Production Market Share by Manufacturers (2018-2023)
2.2 Global Methionine Production Value Market Share by Manufacturers (2018-2023)
2.3 Global Key Players of Methionine, Industry Ranking, 2021 VS 2022 VS 2023
2.4 Global Methionine Market Share by Company Type (Tier 1, Tier 2 and Tier 3)
2.5 Global Methionine Average Price by Manufacturers (2018-2023)
2.6 Global Key Manufacturers of Methionine, Manufacturing Base Distribution and Headquarters
2.7 Global Key Manufacturers of Methionine, Product Offered and Application
2.8 Global Key Manufacturers of Methionine, Date of Enter into This Industry
2.9 Methionine Market Competitive Situation and Trends
2.9.1 Methionine Market Concentration Rate
2.9.2 Global 5 and 10 Largest Methionine Players Market Share by Revenue
2.10 Mergers & Acquisitions, Expansion
3 Methionine Production by Region
3.1 Global Methionine Production Value Estimates and Forecasts by Region: 2018 VS 2022 VS 2029
3.2 Global Methionine Production Value by Region (2018-2029)
3.2.1 Global Methionine Production Value Market Share by Region (2018-2023)
3.2.2 Global Forecasted Production Value of Methionine by Region (2024-2029)
3.3 Global Methionine Production Estimates and Forecasts by Region: 2018 VS 2022 VS 2029
3.4 Global Methionine Production by Region (2018-2029)
3.4.1 Global Methionine Production Market Share by Region (2018-2023)
3.4.2 Global Forecasted Production of Methionine by Region (2024-2029)
3.5 Global Methionine Market Price Analysis by Region (2018-2023)
3.6 Global Methionine Production and Value, Year-over-Year Growth
3.6.1 North America Methionine Production Value Estimates and Forecasts (2018-2029)
3.6.2 Europe Methionine Production Value Estimates and Forecasts (2018-2029)
3.6.3 China Methionine Production Value Estimates and Forecasts (2018-2029)
3.6.4 Japan Methionine Production Value Estimates and Forecasts (2018-2029)
3.6.5 South Korea Methionine Production Value Estimates and Forecasts (2018-2029)
4 Methionine Consumption by Region
4.1 Global Methionine Consumption Estimates and Forecasts by Region: 2018 VS 2022 VS 2029
4.2 Global Methionine Consumption by Region (2018-2029)
4.2.1 Global Methionine Consumption by Region (2018-2023)
4.2.2 Global Methionine Forecasted Consumption by Region (2024-2029)
4.3 North America
4.3.1 North America Methionine Consumption Growth Rate by Country: 2018 VS 2022 VS 2029
4.3.2 North America Methionine Consumption by Country (2018-2029)
4.3.3 U.S.
4.3.4 Canada
4.4 Europe
4.4.1 Europe Methionine Consumption Growth Rate by Country: 2018 VS 2022 VS 2029
4.4.2 Europe Methionine Consumption by Country (2018-2029)
4.4.3 Germany
4.4.4 France
4.4.5 U.K.
4.4.6 Italy
4.4.7 Russia
4.5 Asia Pacific
4.5.1 Asia Pacific Methionine Consumption Growth Rate by Region: 2018 VS 2022 VS 2029
4.5.2 Asia Pacific Methionine Consumption by Region (2018-2029)
4.5.3 China
4.5.4 Japan
4.5.5 South Korea
4.5.6 China Taiwan
4.5.7 Southeast Asia
4.5.8 India
4.6 Latin America, Middle East & Africa
4.6.1 Latin America, Middle East & Africa Methionine Consumption Growth Rate by Country: 2018 VS 2022 VS 2029
4.6.2 Latin America, Middle East & Africa Methionine Consumption by Country (2018-2029)
4.6.3 Mexico
4.6.4 Brazil
4.6.5 Turkey
5 Segment by Type
5.1 Global Methionine Production by Type (2018-2029)
5.1.1 Global Methionine Production by Type (2018-2023)
5.1.2 Global Methionine Production by Type (2024-2029)
5.1.3 Global Methionine Production Market Share by Type (2018-2029)
5.2 Global Methionine Production Value by Type (2018-2029)
5.2.1 Global Methionine Production Value by Type (2018-2023)
5.2.2 Global Methionine Production Value by Type (2024-2029)
5.2.3 Global Methionine Production Value Market Share by Type (2018-2029)
5.3 Global Methionine Price by Type (2018-2029)
6 Segment by Application
6.1 Global Methionine Production by Application (2018-2029)
6.1.1 Global Methionine Production by Application (2018-2023)
6.1.2 Global Methionine Production by Application (2024-2029)
6.1.3 Global Methionine Production Market Share by Application (2018-2029)
6.2 Global Methionine Production Value by Application (2018-2029)
6.2.1 Global Methionine Production Value by Application (2018-2023)
6.2.2 Global Methionine Production Value by Application (2024-2029)
6.2.3 Global Methionine Production Value Market Share by Application (2018-2029)
6.3 Global Methionine Price by Application (2018-2029)
7 Key Companies Profiled
7.1 Evonik
7.1.1 Evonik Methionine Corporation Information
7.1.2 Evonik Methionine Product Portfolio
7.1.3 Evonik Methionine Production, Value, Price and Gross Margin (2018-2023)
7.1.4 Evonik Main Business and Markets Served
7.1.5 Evonik Recent Developments/Updates
7.2 Adisseo (Bluestar)
7.2.1 Adisseo (Bluestar) Methionine Corporation Information
7.2.2 Adisseo (Bluestar) Methionine Product Portfolio
7.2.3 Adisseo (Bluestar) Methionine Production, Value, Price and Gross Margin (2018-2023)
7.2.4 Adisseo (Bluestar) Main Business and Markets Served
7.2.5 Adisseo (Bluestar) Recent Developments/Updates
7.3 NOVUS
7.3.1 NOVUS Methionine Corporation Information
7.3.2 NOVUS Methionine Product Portfolio
7.3.3 NOVUS Methionine Production, Value, Price and Gross Margin (2018-2023)
7.3.4 NOVUS Main Business and Markets Served
7.3.5 NOVUS Recent Developments/Updates
7.4 Sumitomo Chemical
7.4.1 Sumitomo Chemical Methionine Corporation Information
7.4.2 Sumitomo Chemical Methionine Product Portfolio
7.4.3 Sumitomo Chemical Methionine Production, Value, Price and Gross Margin (2018-2023)
7.4.4 Sumitomo Chemical Main Business and Markets Served
7.4.5 Sumitomo Chemical Recent Developments/Updates
7.5 CJ Cheiljedang Corp
7.5.1 CJ Cheiljedang Corp Methionine Corporation Information
7.5.2 CJ Cheiljedang Corp Methionine Product Portfolio
7.5.3 CJ Cheiljedang Corp Methionine Production, Value, Price and Gross Margin (2018-2023)
7.5.4 CJ Cheiljedang Corp Main Business and Markets Served
7.5.5 CJ Cheiljedang Corp Recent Developments/Updates
7.6 Chongqing Unisplendour Chemical
7.6.1 Chongqing Unisplendour Chemical Methionine Corporation Information
7.6.2 Chongqing Unisplendour Chemical Methionine Product Portfolio
7.6.3 Chongqing Unisplendour Chemical Methionine Production, Value, Price and Gross Margin (2018-2023)
7.6.4 Chongqing Unisplendour Chemical Main Business and Markets Served
7.6.5 Chongqing Unisplendour Chemical Recent Developments/Updates
7.7 Sichuan Hebang
7.7.1 Sichuan Hebang Methionine Corporation Information
7.7.2 Sichuan Hebang Methionine Product Portfolio
7.7.3 Sichuan Hebang Methionine Production, Value, Price and Gross Margin (2018-2023)
7.7.4 Sichuan Hebang Main Business and Markets Served
7.7.5 Sichuan Hebang Recent Developments/Updates
8 Industry Chain and Sales Channels Analysis
8.1 Methionine Industry Chain Analysis
8.2 Methionine Key Raw Materials
8.2.1 Key Raw Materials
8.2.2 Raw Materials Key Suppliers
8.3 Methionine Production Mode & Process
8.4 Methionine Sales and Marketing
8.4.1 Methionine Sales Channels
8.4.2 Methionine Distributors
8.5 Methionine Customers
9 Methionine Market Dynamics
9.1 Methionine Industry Trends
9.2 Methionine Market Drivers
9.3 Methionine Market Challenges
9.4 Methionine Market Restraints
10 Research Finding and Conclusion
11 Methodology and Data Source
11.1 Methodology/Research Approach
11.1.1 Research Programs/Design
11.1.2 Market Size Estimation
11.1.3 Market Breakdown and Data Triangulation
11.2 Data Source
11.2.1 Secondary Sources
11.2.2 Primary Sources
11.3 Author List
11.4 Disclaimer
List of Tables
Table 1. Global Methionine Market Value by Type, (US$ Million) & (2022 VS 2029)
Table 2. Global Methionine Market Value by Application, (US$ Million) & (2022 VS 2029)
Table 3. Global Methionine Production Capacity (K Tonnes) by Manufacturers in 2022
Table 4. Global Methionine Production by Manufacturers (2018-2023) & (K Tonnes)
Table 5. Global Methionine Production Market Share by Manufacturers (2018-2023)
Table 6. Global Methionine Production Value by Manufacturers (2018-2023) & (US$ Million)
Table 7. Global Methionine Production Value Share by Manufacturers (2018-2023)
Table 8. Global Methionine Industry Ranking 2021 VS 2022 VS 2023
Table 9. Company Type (Tier 1, Tier 2 and Tier 3) & (based on the Revenue in Methionine as of 2022)
Table 10. Global Market Methionine Average Price by Manufacturers (USD/Tonne) & (2018-2023)
Table 11. Manufacturers Methionine Production Sites and Area Served
Table 12. Manufacturers Methionine Product Types
Table 13. Global Methionine Manufacturers Market Concentration Ratio (CR5 and HHI)
Table 14. Mergers & Acquisitions, Expansion
Table 15. Global Methionine Production Value by Region: 2018 VS 2022 VS 2029 (US$ Million)
Table 16. Global Methionine Production Value (US$ Million) by Region (2018-2023)
Table 17. Global Methionine Production Value Market Share by Region (2018-2023)
Table 18. Global Methionine Production Value (US$ Million) Forecast by Region (2024-2029)
Table 19. Global Methionine Production Value Market Share Forecast by Region (2024-2029)
Table 20. Global Methionine Production Comparison by Region: 2018 VS 2022 VS 2029 (K Tonnes)
Table 21. Global Methionine Production (K Tonnes) by Region (2018-2023)
Table 22. Global Methionine Production Market Share by Region (2018-2023)
Table 23. Global Methionine Production (K Tonnes) Forecast by Region (2024-2029)
Table 24. Global Methionine Production Market Share Forecast by Region (2024-2029)
Table 25. Global Methionine Market Average Price (USD/Tonne) by Region (2018-2023)
Table 26. Global Methionine Market Average Price (USD/Tonne) by Region (2024-2029)
Table 27. Global Methionine Consumption Growth Rate by Region: 2018 VS 2022 VS 2029 (K Tonnes)
Table 28. Global Methionine Consumption by Region (2018-2023) & (K Tonnes)
Table 29. Global Methionine Consumption Market Share by Region (2018-2023)
Table 30. Global Methionine Forecasted Consumption by Region (2024-2029) & (K Tonnes)
Table 31. Global Methionine Forecasted Consumption Market Share by Region (2018-2023)
Table 32. North America Methionine Consumption Growth Rate by Country: 2018 VS 2022 VS 2029 (K Tonnes)
Table 33. North America Methionine Consumption by Country (2018-2023) & (K Tonnes)
Table 34. North America Methionine Consumption by Country (2024-2029) & (K Tonnes)
Table 35. Europe Methionine Consumption Growth Rate by Country: 2018 VS 2022 VS 2029 (K Tonnes)
Table 36. Europe Methionine Consumption by Country (2018-2023) & (K Tonnes)
Table 37. Europe Methionine Consumption by Country (2024-2029) & (K Tonnes)
Table 38. Asia Pacific Methionine Consumption Growth Rate by Region: 2018 VS 2022 VS 2029 (K Tonnes)
Table 39. Asia Pacific Methionine Consumption by Region (2018-2023) & (K Tonnes)
Table 40. Asia Pacific Methionine Consumption by Region (2024-2029) & (K Tonnes)
Table 41. Latin America, Middle East & Africa Methionine Consumption Growth Rate by Country: 2018 VS 2022 VS 2029 (K Tonnes)
Table 42. Latin America, Middle East & Africa Methionine Consumption by Country (2018-2023) & (K Tonnes)
Table 43. Latin America, Middle East & Africa Methionine Consumption by Country (2024-2029) & (K Tonnes)
Table 44. Global Methionine Production (K Tonnes) by Type (2018-2023)
Table 45. Global Methionine Production (K Tonnes) by Type (2024-2029)
Table 46. Global Methionine Production Market Share by Type (2018-2023)
Table 47. Global Methionine Production Market Share by Type (2024-2029)
Table 48. Global Methionine Production Value (US$ Million) by Type (2018-2023)
Table 49. Global Methionine Production Value (US$ Million) by Type (2024-2029)
Table 50. Global Methionine Production Value Share by Type (2018-2023)
Table 51. Global Methionine Production Value Share by Type (2024-2029)
Table 52. Global Methionine Price (USD/Tonne) by Type (2018-2023)
Table 53. Global Methionine Price (USD/Tonne) by Type (2024-2029)
Table 54. Global Methionine Production (K Tonnes) by Application (2018-2023)
Table 55. Global Methionine Production (K Tonnes) by Application (2024-2029)
Table 56. Global Methionine Production Market Share by Application (2018-2023)
Table 57. Global Methionine Production Market Share by Application (2024-2029)
Table 58. Global Methionine Production Value (US$ Million) by Application (2018-2023)
Table 59. Global Methionine Production Value (US$ Million) by Application (2024-2029)
Table 60. Global Methionine Production Value Share by Application (2018-2023)
Table 61. Global Methionine Production Value Share by Application (2024-2029)
Table 62. Global Methionine Price (USD/Tonne) by Application (2018-2023)
Table 63. Global Methionine Price (USD/Tonne) by Application (2024-2029)
Table 64. Evonik Methionine Corporation Information
Table 65. Evonik Specification and Application
Table 66. Evonik Methionine Production (K Tonnes), Value (US$ Million), Price (USD/Tonne) and Gross Margin (2018-2023)
Table 67. Evonik Main Business and Markets Served
Table 68. Evonik Recent Developments/Updates
Table 69. Adisseo (Bluestar) Methionine Corporation Information
Table 70. Adisseo (Bluestar) Specification and Application
Table 71. Adisseo (Bluestar) Methionine Production (K Tonnes), Value (US$ Million), Price (USD/Tonne) and Gross Margin (2018-2023)
Table 72. Adisseo (Bluestar) Main Business and Markets Served
Table 73. Adisseo (Bluestar) Recent Developments/Updates
Table 74. NOVUS Methionine Corporation Information
Table 75. NOVUS Specification and Application
Table 76. NOVUS Methionine Production (K Tonnes), Value (US$ Million), Price (USD/Tonne) and Gross Margin (2018-2023)
Table 77. NOVUS Main Business and Markets Served
Table 78. NOVUS Recent Developments/Updates
Table 79. Sumitomo Chemical Methionine Corporation Information
Table 80. Sumitomo Chemical Specification and Application
Table 81. Sumitomo Chemical Methionine Production (K Tonnes), Value (US$ Million), Price (USD/Tonne) and Gross Margin (2018-2023)
Table 82. Sumitomo Chemical Main Business and Markets Served
Table 83. Sumitomo Chemical Recent Developments/Updates
Table 84. CJ Cheiljedang Corp Methionine Corporation Information
Table 85. CJ Cheiljedang Corp Specification and Application
Table 86. CJ Cheiljedang Corp Methionine Production (K Tonnes), Value (US$ Million), Price (USD/Tonne) and Gross Margin (2018-2023)
Table 87. CJ Cheiljedang Corp Main Business and Markets Served
Table 88. CJ Cheiljedang Corp Recent Developments/Updates
Table 89. Chongqing Unisplendour Chemical Methionine Corporation Information
Table 90. Chongqing Unisplendour Chemical Specification and Application
Table 91. Chongqing Unisplendour Chemical Methionine Production (K Tonnes), Value (US$ Million), Price (USD/Tonne) and Gross Margin (2018-2023)
Table 92. Chongqing Unisplendour Chemical Main Business and Markets Served
Table 93. Chongqing Unisplendour Chemical Recent Developments/Updates
Table 94. Sichuan Hebang Methionine Corporation Information
Table 95. Sichuan Hebang Specification and Application
Table 96. Sichuan Hebang Methionine Production (K Tonnes), Value (US$ Million), Price (USD/Tonne) and Gross Margin (2018-2023)
Table 97. Sichuan Hebang Main Business and Markets Served
Table 98. Sichuan Hebang Recent Developments/Updates
Table 99. Key Raw Materials Lists
Table 100. Raw Materials Key Suppliers Lists
Table 101. Methionine Distributors List
Table 102. Methionine Customers List
Table 103. Methionine Market Trends
Table 104. Methionine Market Drivers
Table 105. Methionine Market Challenges
Table 106. Methionine Market Restraints
Table 107. Research Programs/Design for This Report
Table 108. Key Data Information from Secondary Sources
Table 109. Key Data Information from Primary Sources
List of Figures
Figure 1. Product Picture of Methionine
Figure 2. Global Methionine Market Value by Type, (US$ Million) & (2022 VS 2029)
Figure 3. Global Methionine Market Share by Type: 2022 VS 2029
Figure 4. Solid Methionine Product Picture
Figure 5. Liquid Methionine Product Picture
Figure 6. Global Methionine Market Value by Application, (US$ Million) & (2022 VS 2029)
Figure 7. Global Methionine Market Share by Application: 2022 VS 2029
Figure 8. Feed
Figure 9. Pharmaceutical
Figure 10. Food
Figure 11. Others
Figure 12. Global Methionine Production Value (US$ Million), 2018 VS 2022 VS 2029
Figure 13. Global Methionine Production Value (US$ Million) & (2018-2029)
Figure 14. Global Methionine Production Capacity (K Tonnes) & (2018-2029)
Figure 15. Global Methionine Production (K Tonnes) & (2018-2029)
Figure 16. Global Methionine Average Price (USD/Tonne) & (2018-2029)
Figure 17. Methionine Report Years Considered
Figure 18. Methionine Production Share by Manufacturers in 2022
Figure 19. Methionine Market Share by Company Type (Tier 1, Tier 2, and Tier 3): 2018 VS 2022
Figure 20. The Global 5 and 10 Largest Players: Market Share by Methionine Revenue in 2022
Figure 21. Global Methionine Production Value by Region: 2018 VS 2022 VS 2029 (US$ Million)
Figure 22. Global Methionine Production Value Market Share by Region: 2018 VS 2022 VS 2029
Figure 23. Global Methionine Production Comparison by Region: 2018 VS 2022 VS 2029 (K Tonnes)
Figure 24. Global Methionine Production Market Share by Region: 2018 VS 2022 VS 2029
Figure 25. North America Methionine Production Value (US$ Million) Growth Rate (2018-2029)
Figure 26. Europe Methionine Production Value (US$ Million) Growth Rate (2018-2029)
Figure 27. China Methionine Production Value (US$ Million) Growth Rate (2018-2029)
Figure 28. Japan Methionine Production Value (US$ Million) Growth Rate (2018-2029)
Figure 29. South Korea Methionine Production Value (US$ Million) Growth Rate (2018-2029)
Figure 30. Global Methionine Consumption by Region: 2018 VS 2022 VS 2029 (K Tonnes)
Figure 31. Global Methionine Consumption Market Share by Region: 2018 VS 2022 VS 2029
Figure 32. North America Methionine Consumption and Growth Rate (2018-2023) & (K Tonnes)
Figure 33. North America Methionine Consumption Market Share by Country (2018-2029)
Figure 34. Canada Methionine Consumption and Growth Rate (2018-2023) & (K Tonnes)
Figure 35. U.S. Methionine Consumption and Growth Rate (2018-2023) & (K Tonnes)
Figure 36. Europe Methionine Consumption and Growth Rate (2018-2023) & (K Tonnes)
Figure 37. Europe Methionine Consumption Market Share by Country (2018-2029)
Figure 38. Germany Methionine Consumption and Growth Rate (2018-2023) & (K Tonnes)
Figure 39. France Methionine Consumption and Growth Rate (2018-2023) & (K Tonnes)
Figure 40. U.K. Methionine Consumption and Growth Rate (2018-2023) & (K Tonnes)
Figure 41. Italy Methionine Consumption and Growth Rate (2018-2023) & (K Tonnes)
Figure 42. Russia Methionine Consumption and Growth Rate (2018-2023) & (K Tonnes)
Figure 43. Asia Pacific Methionine Consumption and Growth Rate (2018-2023) & (K Tonnes)
Figure 44. Asia Pacific Methionine Consumption Market Share by Regions (2018-2029)
Figure 45. China Methionine Consumption and Growth Rate (2018-2023) & (K Tonnes)
Figure 46. Japan Methionine Consumption and Growth Rate (2018-2023) & (K Tonnes)
Figure 47. South Korea Methionine Consumption and Growth Rate (2018-2023) & (K Tonnes)
Figure 48. China Taiwan Methionine Consumption and Growth Rate (2018-2023) & (K Tonnes)
Figure 49. Southeast Asia Methionine Consumption and Growth Rate (2018-2023) & (K Tonnes)
Figure 50. India Methionine Consumption and Growth Rate (2018-2023) & (K Tonnes)
Figure 51. Latin America, Middle East & Africa Methionine Consumption and Growth Rate (2018-2023) & (K Tonnes)
Figure 52. Latin America, Middle East & Africa Methionine Consumption Market Share by Country (2018-2029)
Figure 53. Mexico Methionine Consumption and Growth Rate (2018-2023) & (K Tonnes)
Figure 54. Brazil Methionine Consumption and Growth Rate (2018-2023) & (K Tonnes)
Figure 55. Turkey Methionine Consumption and Growth Rate (2018-2023) & (K Tonnes)
Figure 56. GCC Countries Methionine Consumption and Growth Rate (2018-2023) & (K Tonnes)
Figure 57. Global Production Market Share of Methionine by Type (2018-2029)
Figure 58. Global Production Value Market Share of Methionine by Type (2018-2029)
Figure 59. Global Methionine Price (USD/Tonne) by Type (2018-2029)
Figure 60. Global Production Market Share of Methionine by Application (2018-2029)
Figure 61. Global Production Value Market Share of Methionine by Application (2018-2029)
Figure 62. Global Methionine Price (USD/Tonne) by Application (2018-2029)
Figure 63. Methionine Value Chain
Figure 64. Methionine Production Process
Figure 65. Channels of Distribution (Direct Vs Distribution)
Figure 66. Distributors Profiles
Figure 67. Bottom-up and Top-down Approaches for This Report
Figure 68. Data Triangulation
$2900
$5800
HAVE A QUERY?
OUR CUSTOMER

SIMILAR REPORTS