
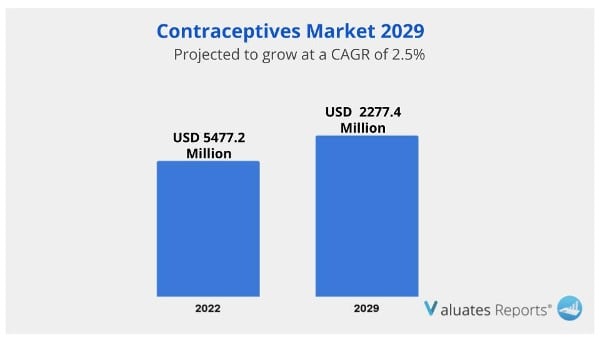
The global Contraceptives market was valued at USD 1911.9 million in 2022 and is anticipated to reach USD 2277.4 million by 2029, witnessing a CAGR of 2.5% during the forecast period 2023-2029. The influence of COVID-19 and the Netherlands-Ukraine War were considered while estimating market sizes.
Oral contraceptive pills, implants, injectables, patches, vaginal rings, intrauterine devices, condoms, male and female sterilization, lactational amenorrhea techniques, withdrawal, and fertility awareness-based approaches are among the contraceptive methods available. These techniques all work through various mechanisms and are successful in avoiding unwanted pregnancy.
Growing awareness of the importance of family planning and preventing unplanned pregnancies drives market expansion. In addition, rising levels of higher education and increased usage of contraceptives among young women fuel market expansion. The rise in the use of oral tablets as a primary technique to prevent unintended pregnancies as well as health problems related to teenage pregnancies and increased awareness of contemporary contraception all contribute to the expansion of the contraceptives market.
The expansion of the worldwide contraceptive market is fueled by a high absorption rate, an increase in reproductive women's labor force participation, and high population awareness of contraceptive products. The population in developing nations like India, Brazil, Africa, and others has more disposable income, which has led to an increase in the uptake of contraceptive products, fueling the expansion of the worldwide contraceptive market.
During the projection period, it is projected that the introduction of programs aimed at lowering unintended pregnancies and the associated healthcare expenses as well as raising user awareness levels will fuel market growth. Additionally, the rise in unwanted pregnancies is anticipated to aid in the contraceptive market expansion throughout the course of the projected year.
Numerous businesses in the global contraceptives market were compelled to temporarily halt operations because of the COVID-19 pandemic in order to adhere to new laws enacted to stop the disease's spread. The worldwide contraceptives market's revenue flow is directly impacted by this suspension of operations. Additionally, a halt in industrial product production was seen as a result of a shortage of laborers and raw supplies during the COVID-19 epidemic. Furthermore, businesses in this industry did not receive any fresh shipments. As a result, the worldwide contraceptives market was negatively impacted by the suspension of industrial activities and the subsequent lockdowns for several months. During the projection period, the contraceptives market is expected to slowly rebound.
The increase in favorable government initiatives, a rise in population control demands, and the prevalence of unwanted pregnancies will further drive the growth of the contraceptive market.
With a 44% market share, Europe is the region with the greatest market for contraceptives. With a market share of around 37%, North America is a follower.
Bayer AG, Pfizer, Inc., Teva Pharmaceutical Industries Ltd., Merck & Co., Inc., Actavis, Inc., Johnson & Johnson, Gedeon Richter, Novo Nordisk A/S, ZiZhu, Baijingyu, Huazhong, Sine, etc. are some of the major participants. The top 3 businesses held 46% of the market.
| Report Metric | Details |
| Report Name | Contraceptives Market |
| The market size in 2022 | USD 5477.2 Million |
| The revenue forecast in 2029 | USD 2277.4 Million |
| Growth Rate | Compound Annual Growth Rate (CAGR) of 2.5% from 2023 to 2029 |
| Market size available for years | 2023-2029 |
| Forecast units | Value (USD) |
| Segments covered | Type, Application, Regions |
| Report coverage | Revenue & volume forecast, company share, competitive landscape, growth factors, and trends |
| Geographic regions covered | North America, Europe, Asia Pacific, Latin America, Middle East & Africa |
Ans. The global Contraceptives market was valued at US$ 1911.9 million in 2022 and is anticipated to reach US$ 2277.4 million by 2029, witnessing a CAGR of 2.5% during the forecast period 2023-2029.
Ans. The global Contraceptives market is expected to grow at a compound annual growth rate of 2.5% from 2023 to 2029.
Ans. Bayer AG, Pfizer, Inc, Teva Pharmaceutical Industries Ltd, Merck & Co., Inc, Actavis, Inc., Johnson & Johnson, Gedeon Richter, Novo Nordisk A/S, ZiZhu, Baijingyu, Huazhong, Sine, Others.
1 Contraceptives Market Overview
1.1 Product Overview and Scope of Contraceptives
1.2 Contraceptives Segment by Type
1.2.1 Global Contraceptives Market Value Comparison by Type (2023-2029)
1.2.2 Pills
1.2.3 Injectable
1.2.4 Condoms
1.2.5 Vaginal Rings
1.2.6 IUDs
1.2.7 Subdermal Implants
1.2.8 Others
1.3 Contraceptives Segment by End User
1.3.1 Global Contraceptives Market Value by End User: (2023-2029)
1.3.2 15–24 years
1.3.3 25–34 years
1.3.4 35–44 years
1.3.5 Above 44 years
1.4 Global Contraceptives Market Size Estimates and Forecasts
1.4.1 Global Contraceptives Revenue 2018-2029
1.4.2 Global Contraceptives Sales 2018-2029
1.4.3 Global Contraceptives Market Average Price (2018-2029)
1.5 Assumptions and Limitations
2 Contraceptives Market Competition by Manufacturers
2.1 Global Contraceptives Sales Market Share by Manufacturers (2018-2023)
2.2 Global Contraceptives Revenue Market Share by Manufacturers (2018-2023)
2.3 Global Contraceptives Average Price by Manufacturers (2018-2023)
2.4 Global Contraceptives Industry Ranking 2021 VS 2022 VS 2023
2.5 Global Key Manufacturers of Contraceptives, Manufacturing Sites & Headquarters
2.6 Global Key Manufacturers of Contraceptives, Product Type & Application
2.7 Contraceptives Market Competitive Situation and Trends
2.7.1 Contraceptives Market Concentration Rate
2.7.2 The Global Top 5 and Top 10 Largest Contraceptives Players Market Share by Revenue
2.7.3 Global Contraceptives Market Share by Company Type (Tier 1, Tier 2 and Tier 3)
2.8 Manufacturers Mergers & Acquisitions, Expansion Plans
3 Contraceptives Retrospective Market Scenario by Region
3.1 Global Contraceptives Market Size by Region: 2018 Versus 2022 Versus 2029
3.2 Global Contraceptives Global Contraceptives Sales by Region: 2018-2029
3.2.1 Global Contraceptives Sales by Region: 2018-2023
3.2.2 Global Contraceptives Sales by Region: 2024-2029
3.3 Global Contraceptives Global Contraceptives Revenue by Region: 2018-2029
3.3.1 Global Contraceptives Revenue by Region: 2018-2023
3.3.2 Global Contraceptives Revenue by Region: 2024-2029
3.4 North America Contraceptives Market Facts & Figures by Country
3.4.1 North America Contraceptives Market Size by Country: 2018 VS 2022 VS 2029
3.4.2 North America Contraceptives Sales by Country (2018-2029)
3.4.3 North America Contraceptives Revenue by Country (2018-2029)
3.4.4 U.S.
3.4.5 Canada
3.5 Europe Contraceptives Market Facts & Figures by Country
3.5.1 Europe Contraceptives Market Size by Country: 2018 VS 2022 VS 2029
3.5.2 Europe Contraceptives Sales by Country (2018-2029)
3.5.3 Europe Contraceptives Revenue by Country (2018-2029)
3.5.4 Germany
3.5.5 France
3.5.6 U.K.
3.5.7 Italy
3.5.8 Russia
3.6 Asia Pacific Contraceptives Market Facts & Figures by Country
3.6.1 Asia Pacific Contraceptives Market Size by Country: 2018 VS 2022 VS 2029
3.6.2 Asia Pacific Contraceptives Sales by Country (2018-2029)
3.6.3 Asia Pacific Contraceptives Revenue by Country (2018-2029)
3.6.4 China
3.6.5 Japan
3.6.6 South Korea
3.6.7 India
3.6.8 Australia
3.6.9 Taiwan
3.6.10 Indonesia
3.6.11 Thailand
3.6.12 Malaysia
3.6.13 Philippines
3.7 Latin America Contraceptives Market Facts & Figures by Country
3.7.1 Latin America Contraceptives Market Size by Country: 2018 VS 2022 VS 2029
3.7.2 Latin America Contraceptives Sales by Country (2018-2029)
3.7.3 Latin America Contraceptives Revenue by Country (2018-2029)
3.7.4 Mexico
3.7.5 Brazil
3.7.6 Argentina
3.8 Middle East and Africa Contraceptives Market Facts & Figures by Country
3.8.1 Middle East and Africa Contraceptives Market Size by Country: 2018 VS 2022 VS 2029
3.8.2 Middle East and Africa Contraceptives Sales by Country (2018-2029)
3.8.3 Middle East and Africa Contraceptives Revenue by Country (2018-2029)
3.8.4 Turkey
3.8.5 Saudi Arabia
3.8.6 U.A.E
4 Segment by Type
4.1 Global Contraceptives Sales by Type (2018-2029)
4.1.1 Global Contraceptives Sales by Type (2018-2023)
4.1.2 Global Contraceptives Sales by Type (2024-2029)
4.1.3 Global Contraceptives Sales Market Share by Type (2018-2029)
4.2 Global Contraceptives Revenue by Type (2018-2029)
4.2.1 Global Contraceptives Revenue by Type (2018-2023)
4.2.2 Global Contraceptives Revenue by Type (2024-2029)
4.2.3 Global Contraceptives Revenue Market Share by Type (2018-2029)
4.3 Global Contraceptives Price by Type (2018-2029)
5 Segment by End User
5.1 Global Contraceptives Sales by End User (2018-2029)
5.1.1 Global Contraceptives Sales by End User (2018-2023)
5.1.2 Global Contraceptives Sales by End User (2024-2029)
5.1.3 Global Contraceptives Sales Market Share by End User (2018-2029)
5.2 Global Contraceptives Revenue by End User (2018-2029)
5.2.1 Global Contraceptives Revenue by End User (2018-2023)
5.2.2 Global Contraceptives Revenue by End User (2024-2029)
5.2.3 Global Contraceptives Revenue Market Share by End User (2018-2029)
5.3 Global Contraceptives Price by End User (2018-2029)
6 Key Companies Profiled
6.1 Bayer AG
6.1.1 Bayer AG Corporation Information
6.1.2 Bayer AG Description and Business Overview
6.1.3 Bayer AG Contraceptives Sales, Revenue and Gross Margin (2018-2023)
6.1.4 Bayer AG Contraceptives Product Portfolio
6.1.5 Bayer AG Recent Developments/Updates
6.2 Pfizer, Inc
6.2.1 Pfizer, Inc Corporation Information
6.2.2 Pfizer, Inc Description and Business Overview
6.2.3 Pfizer, Inc Contraceptives Sales, Revenue and Gross Margin (2018-2023)
6.2.4 Pfizer, Inc Contraceptives Product Portfolio
6.2.5 Pfizer, Inc Recent Developments/Updates
6.3 Teva Pharmaceutical Industries Ltd
6.3.1 Teva Pharmaceutical Industries Ltd Corporation Information
6.3.2 Teva Pharmaceutical Industries Ltd Description and Business Overview
6.3.3 Teva Pharmaceutical Industries Ltd Contraceptives Sales, Revenue and Gross Margin (2018-2023)
6.3.4 Teva Pharmaceutical Industries Ltd Contraceptives Product Portfolio
6.3.5 Teva Pharmaceutical Industries Ltd Recent Developments/Updates
6.4 Merck & Co., Inc
6.4.1 Merck & Co., Inc Corporation Information
6.4.2 Merck & Co., Inc Description and Business Overview
6.4.3 Merck & Co., Inc Contraceptives Sales, Revenue and Gross Margin (2018-2023)
6.4.4 Merck & Co., Inc Contraceptives Product Portfolio
6.4.5 Merck & Co., Inc Recent Developments/Updates
6.5 Actavis, Inc.
6.5.1 Actavis, Inc. Corporation Information
6.5.2 Actavis, Inc. Description and Business Overview
6.5.3 Actavis, Inc. Contraceptives Sales, Revenue and Gross Margin (2018-2023)
6.5.4 Actavis, Inc. Contraceptives Product Portfolio
6.5.5 Actavis, Inc. Recent Developments/Updates
6.6 Johnson & Johnson
6.6.1 Johnson & Johnson Corporation Information
6.6.2 Johnson & Johnson Description and Business Overview
6.6.3 Johnson & Johnson Contraceptives Sales, Revenue and Gross Margin (2018-2023)
6.6.4 Johnson & Johnson Contraceptives Product Portfolio
6.6.5 Johnson & Johnson Recent Developments/Updates
6.7 Gedeon Richter
6.6.1 Gedeon Richter Corporation Information
6.6.2 Gedeon Richter Description and Business Overview
6.6.3 Gedeon Richter Contraceptives Sales, Revenue and Gross Margin (2018-2023)
6.4.4 Gedeon Richter Contraceptives Product Portfolio
6.7.5 Gedeon Richter Recent Developments/Updates
6.8 Novo Nordisk A/S
6.8.1 Novo Nordisk A/S Corporation Information
6.8.2 Novo Nordisk A/S Description and Business Overview
6.8.3 Novo Nordisk A/S Contraceptives Sales, Revenue and Gross Margin (2018-2023)
6.8.4 Novo Nordisk A/S Contraceptives Product Portfolio
6.8.5 Novo Nordisk A/S Recent Developments/Updates
6.9 ZiZhu
6.9.1 ZiZhu Corporation Information
6.9.2 ZiZhu Description and Business Overview
6.9.3 ZiZhu Contraceptives Sales, Revenue and Gross Margin (2018-2023)
6.9.4 ZiZhu Contraceptives Product Portfolio
6.9.5 ZiZhu Recent Developments/Updates
6.10 Baijingyu
6.10.1 Baijingyu Corporation Information
6.10.2 Baijingyu Description and Business Overview
6.10.3 Baijingyu Contraceptives Sales, Revenue and Gross Margin (2018-2023)
6.10.4 Baijingyu Contraceptives Product Portfolio
6.10.5 Baijingyu Recent Developments/Updates
6.11 Huazhong
6.11.1 Huazhong Corporation Information
6.11.2 Huazhong Contraceptives Description and Business Overview
6.11.3 Huazhong Contraceptives Sales, Revenue and Gross Margin (2018-2023)
6.11.4 Huazhong Contraceptives Product Portfolio
6.11.5 Huazhong Recent Developments/Updates
6.12 Sine
6.12.1 Sine Corporation Information
6.12.2 Sine Contraceptives Description and Business Overview
6.12.3 Sine Contraceptives Sales, Revenue and Gross Margin (2018-2023)
6.12.4 Sine Contraceptives Product Portfolio
6.12.5 Sine Recent Developments/Updates
6.13 Reckitt
6.13.1 Reckitt Corporation Information
6.13.2 Reckitt Contraceptives Description and Business Overview
6.13.3 Reckitt Contraceptives Sales, Revenue and Gross Margin (2018-2023)
6.13.4 Reckitt Contraceptives Product Portfolio
6.13.5 Reckitt Recent Developments/Updates
6.14 AbbVie
6.14.1 AbbVie Corporation Information
6.14.2 AbbVie Contraceptives Description and Business Overview
6.14.3 AbbVie Contraceptives Sales, Revenue and Gross Margin (2018-2023)
6.14.4 AbbVie Contraceptives Product Portfolio
6.14.5 AbbVie Recent Developments/Updates
6.15 Church & Dwight
6.15.1 Church & Dwight Corporation Information
6.15.2 Church & Dwight Contraceptives Description and Business Overview
6.15.3 Church & Dwight Contraceptives Sales, Revenue and Gross Margin (2018-2023)
6.15.4 Church & Dwight Contraceptives Product Portfolio
6.15.5 Church & Dwight Recent Developments/Updates
6.16 The Cooper Companies
6.16.1 The Cooper Companies Corporation Information
6.16.2 The Cooper Companies Contraceptives Description and Business Overview
6.16.3 The Cooper Companies Contraceptives Sales, Revenue and Gross Margin (2018-2023)
6.16.4 The Cooper Companies Contraceptives Product Portfolio
6.16.5 The Cooper Companies Recent Developments/Updates
6.17 TherapeuticsMD
6.17.1 TherapeuticsMD Corporation Information
6.17.2 TherapeuticsMD Contraceptives Description and Business Overview
6.17.3 TherapeuticsMD Contraceptives Sales, Revenue and Gross Margin (2018-2023)
6.17.4 TherapeuticsMD Contraceptives Product Portfolio
6.17.5 TherapeuticsMD Recent Developments/Updates
6.18 Afaxys
6.18.1 Afaxys Corporation Information
6.18.2 Afaxys Contraceptives Description and Business Overview
6.18.3 Afaxys Contraceptives Sales, Revenue and Gross Margin (2018-2023)
6.18.4 Afaxys Contraceptives Product Portfolio
6.18.5 Afaxys Recent Developments/Updates
6.19 Mithra Pharmaceuticals
6.19.1 Mithra Pharmaceuticals Corporation Information
6.19.2 Mithra Pharmaceuticals Contraceptives Description and Business Overview
6.19.3 Mithra Pharmaceuticals Contraceptives Sales, Revenue and Gross Margin (2018-2023)
6.19.4 Mithra Pharmaceuticals Contraceptives Product Portfolio
6.19.5 Mithra Pharmaceuticals Recent Developments/Updates
7 Industry Chain and Sales Channels Analysis
7.1 Contraceptives Industry Chain Analysis
7.2 Contraceptives Key Raw Materials
7.2.1 Key Raw Materials
7.2.2 Raw Materials Key Suppliers
7.3 Contraceptives Production Mode & Process
7.4 Contraceptives Sales and Marketing
7.4.1 Contraceptives Sales Channels
7.4.2 Contraceptives Distributors
7.5 Contraceptives Customers
8 Contraceptives Market Dynamics
8.1 Contraceptives Industry Trends
8.2 Contraceptives Market Drivers
8.3 Contraceptives Market Challenges
8.4 Contraceptives Market Restraints
9 Research Finding and Conclusion
10 Methodology and Data Source
10.1 Methodology/Research Approach
10.1.1 Research Programs/Design
10.1.2 Market Size Estimation
10.1.3 Market Breakdown and Data Triangulation
10.2 Data Source
10.2.1 Secondary Sources
10.2.2 Primary Sources
10.3 Author List
10.4 Disclaimer
List of Tables
Table 1. Global Contraceptives Market Value Comparison by Type (2023-2029) & (US$ Million)
Table 2. Global Contraceptives Market Value Comparison by End User (2023-2029) & (US$ Million)
Table 3. Global Contraceptives Market Competitive Situation by Manufacturers in 2022
Table 4. Global Contraceptives Sales (M Units) of Key Manufacturers (2018-2023)
Table 5. Global Contraceptives Sales Market Share by Manufacturers (2018-2023)
Table 6. Global Contraceptives Revenue (US$ Million) by Manufacturers (2018-2023)
Table 7. Global Contraceptives Revenue Share by Manufacturers (2018-2023)
Table 8. Global Market Contraceptives Average Price (USD/Unit) of Key Manufacturers (2018-2023)
Table 9. Global Key Players of Contraceptives, Industry Ranking, 2021 VS 2022 VS 2023
Table 10. Global Key Manufacturers of Contraceptives, Manufacturing Sites & Headquarters
Table 11. Global Key Manufacturers of Contraceptives, Product Type & Application
Table 12. Global Key Manufacturers of Contraceptives, Date of Enter into This Industry
Table 13. Global Manufacturers Market Concentration Ratio (CR5 and HHI)
Table 14. Global Contraceptives by Company Type (Tier 1, Tier 2, and Tier 3) & (based on the Revenue in Contraceptives as of 2022)
Table 15. Manufacturers Mergers & Acquisitions, Expansion Plans
Table 16. Global Contraceptives Market Size by Region (US$ Million): 2018 VS 2022 VS 2029
Table 17. Global Contraceptives Sales by Region (2018-2023) & (M Units)
Table 18. Global Contraceptives Sales Market Share by Region (2018-2023)
Table 19. Global Contraceptives Sales by Region (2024-2029) & (M Units)
Table 20. Global Contraceptives Sales Market Share by Region (2024-2029)
Table 21. Global Contraceptives Revenue by Region (2018-2023) & (US$ Million)
Table 22. Global Contraceptives Revenue Market Share by Region (2018-2023)
Table 23. Global Contraceptives Revenue by Region (2024-2029) & (US$ Million)
Table 24. Global Contraceptives Revenue Market Share by Region (2024-2029)
Table 25. North America Contraceptives Revenue by Country: 2018 VS 2022 VS 2029 (US$ Million)
Table 26. North America Contraceptives Sales by Country (2018-2023) & (M Units)
Table 27. North America Contraceptives Sales by Country (2024-2029) & (M Units)
Table 28. North America Contraceptives Revenue by Country (2018-2023) & (US$ Million)
Table 29. North America Contraceptives Revenue by Country (2024-2029) & (US$ Million)
Table 30. Europe Contraceptives Revenue by Country: 2018 VS 2022 VS 2029 (US$ Million)
Table 31. Europe Contraceptives Sales by Country (2018-2023) & (M Units)
Table 32. Europe Contraceptives Sales by Country (2024-2029) & (M Units)
Table 33. Europe Contraceptives Revenue by Country (2018-2023) & (US$ Million)
Table 34. Europe Contraceptives Revenue by Country (2024-2029) & (US$ Million)
Table 35. Asia Pacific Contraceptives Revenue by Region: 2018 VS 2022 VS 2029 (US$ Million)
Table 36. Asia Pacific Contraceptives Sales by Region (2018-2023) & (M Units)
Table 37. Asia Pacific Contraceptives Sales by Region (2024-2029) & (M Units)
Table 38. Asia Pacific Contraceptives Revenue by Region (2018-2023) & (US$ Million)
Table 39. Asia Pacific Contraceptives Revenue by Region (2024-2029) & (US$ Million)
Table 40. Latin America Contraceptives Revenue by Country: 2018 VS 2022 VS 2029 (US$ Million)
Table 41. Latin America Contraceptives Sales by Country (2018-2023) & (M Units)
Table 42. Latin America Contraceptives Sales by Country (2024-2029) & (M Units)
Table 43. Latin America Contraceptives Revenue by Country (2018-2023) & (US$ Million)
Table 44. Latin America Contraceptives Revenue by Country (2024-2029) & (US$ Million)
Table 45. Middle East & Africa Contraceptives Revenue by Country: 2018 VS 2022 VS 2029 (US$ Million)
Table 46. Middle East & Africa Contraceptives Sales by Country (2018-2023) & (M Units)
Table 47. Middle East & Africa Contraceptives Sales by Country (2024-2029) & (M Units)
Table 48. Middle East & Africa Contraceptives Revenue by Country (2018-2023) & (US$ Million)
Table 49. Middle East & Africa Contraceptives Revenue by Country (2024-2029) & (US$ Million)
Table 50. Global Contraceptives Sales (M Units) by Type (2018-2023)
Table 51. Global Contraceptives Sales (M Units) by Type (2024-2029)
Table 52. Global Contraceptives Sales Market Share by Type (2018-2023)
Table 53. Global Contraceptives Sales Market Share by Type (2024-2029)
Table 54. Global Contraceptives Revenue (US$ Million) by Type (2018-2023)
Table 55. Global Contraceptives Revenue (US$ Million) by Type (2024-2029)
Table 56. Global Contraceptives Revenue Market Share by Type (2018-2023)
Table 57. Global Contraceptives Revenue Market Share by Type (2024-2029)
Table 58. Global Contraceptives Price (USD/Unit) by Type (2018-2023)
Table 59. Global Contraceptives Price (USD/Unit) by Type (2024-2029)
Table 60. Global Contraceptives Sales (M Units) by End User (2018-2023)
Table 61. Global Contraceptives Sales (M Units) by End User (2024-2029)
Table 62. Global Contraceptives Sales Market Share by End User (2018-2023)
Table 63. Global Contraceptives Sales Market Share by End User (2024-2029)
Table 64. Global Contraceptives Revenue (US$ Million) by End User (2018-2023)
Table 65. Global Contraceptives Revenue (US$ Million) by End User (2024-2029)
Table 66. Global Contraceptives Revenue Market Share by End User (2018-2023)
Table 67. Global Contraceptives Revenue Market Share by End User (2024-2029)
Table 68. Global Contraceptives Price (USD/Unit) by End User (2018-2023)
Table 69. Global Contraceptives Price (USD/Unit) by End User (2024-2029)
Table 70. Bayer AG Corporation Information
Table 71. Bayer AG Description and Business Overview
Table 72. Bayer AG Contraceptives Sales (M Units), Revenue (US$ Million), Price (USD/Unit) and Gross Margin (2018-2023)
Table 73. Bayer AG Contraceptives Product
Table 74. Bayer AG Recent Developments/Updates
Table 75. Pfizer, Inc Corporation Information
Table 76. Pfizer, Inc Description and Business Overview
Table 77. Pfizer, Inc Contraceptives Sales (M Units), Revenue (US$ Million), Price (USD/Unit) and Gross Margin (2018-2023)
Table 78. Pfizer, Inc Contraceptives Product
Table 79. Pfizer, Inc Recent Developments/Updates
Table 80. Teva Pharmaceutical Industries Ltd Corporation Information
Table 81. Teva Pharmaceutical Industries Ltd Description and Business Overview
Table 82. Teva Pharmaceutical Industries Ltd Contraceptives Sales (M Units), Revenue (US$ Million), Price (USD/Unit) and Gross Margin (2018-2023)
Table 83. Teva Pharmaceutical Industries Ltd Contraceptives Product
Table 84. Teva Pharmaceutical Industries Ltd Recent Developments/Updates
Table 85. Merck & Co., Inc Corporation Information
Table 86. Merck & Co., Inc Description and Business Overview
Table 87. Merck & Co., Inc Contraceptives Sales (M Units), Revenue (US$ Million), Price (USD/Unit) and Gross Margin (2018-2023)
Table 88. Merck & Co., Inc Contraceptives Product
Table 89. Merck & Co., Inc Recent Developments/Updates
Table 90. Actavis, Inc. Corporation Information
Table 91. Actavis, Inc. Description and Business Overview
Table 92. Actavis, Inc. Contraceptives Sales (M Units), Revenue (US$ Million), Price (USD/Unit) and Gross Margin (2018-2023)
Table 93. Actavis, Inc. Contraceptives Product
Table 94. Actavis, Inc. Recent Developments/Updates
Table 95. Johnson & Johnson Corporation Information
Table 96. Johnson & Johnson Description and Business Overview
Table 97. Johnson & Johnson Contraceptives Sales (M Units), Revenue (US$ Million), Price (USD/Unit) and Gross Margin (2018-2023)
Table 98. Johnson & Johnson Contraceptives Product
Table 99. Johnson & Johnson Recent Developments/Updates
Table 100. Gedeon Richter Corporation Information
Table 101. Gedeon Richter Description and Business Overview
Table 102. Gedeon Richter Contraceptives Sales (M Units), Revenue (US$ Million), Price (USD/Unit) and Gross Margin (2018-2023)
Table 103. Gedeon Richter Contraceptives Product
Table 104. Gedeon Richter Recent Developments/Updates
Table 105. Novo Nordisk A/S Corporation Information
Table 106. Novo Nordisk A/S Description and Business Overview
Table 107. Novo Nordisk A/S Contraceptives Sales (M Units), Revenue (US$ Million), Price (USD/Unit) and Gross Margin (2018-2023)
Table 108. Novo Nordisk A/S Contraceptives Product
Table 109. Novo Nordisk A/S Recent Developments/Updates
Table 110. ZiZhu Corporation Information
Table 111. ZiZhu Description and Business Overview
Table 112. ZiZhu Contraceptives Sales (M Units), Revenue (US$ Million), Price (USD/Unit) and Gross Margin (2018-2023)
Table 113. ZiZhu Contraceptives Product
Table 114. ZiZhu Recent Developments/Updates
Table 115. Baijingyu Corporation Information
Table 116. Baijingyu Description and Business Overview
Table 117. Baijingyu Contraceptives Sales (M Units), Revenue (US$ Million), Price (USD/Unit) and Gross Margin (2018-2023)
Table 118. Baijingyu Contraceptives Product
Table 119. Baijingyu Recent Developments/Updates
Table 120. Huazhong Corporation Information
Table 121. Huazhong Description and Business Overview
Table 122. Huazhong Contraceptives Sales (M Units), Revenue (US$ Million), Price (USD/Unit) and Gross Margin (2018-2023)
Table 123. Huazhong Contraceptives Product
Table 124. Huazhong Recent Developments/Updates
Table 125. Sine Corporation Information
Table 126. Sine Description and Business Overview
Table 127. Sine Contraceptives Sales (M Units), Revenue (US$ Million), Price (USD/Unit) and Gross Margin (2018-2023)
Table 128. Sine Contraceptives Product
Table 129. Sine Recent Developments/Updates
Table 130. Reckitt Corporation Information
Table 131. Reckitt Description and Business Overview
Table 132. Reckitt Contraceptives Sales (M Units), Revenue (US$ Million), Price (USD/Unit) and Gross Margin (2018-2023)
Table 133. Reckitt Contraceptives Product
Table 134. Reckitt Recent Developments/Updates
Table 135. AbbVie Corporation Information
Table 136. AbbVie Description and Business Overview
Table 137. AbbVie Contraceptives Sales (M Units), Revenue (US$ Million), Price (USD/Unit) and Gross Margin (2018-2023)
Table 138. AbbVie Contraceptives Product
Table 139. AbbVie Recent Developments/Updates
Table 140. Church & Dwight Corporation Information
Table 141. Church & Dwight Description and Business Overview
Table 142. Church & Dwight Contraceptives Sales (M Units), Revenue (US$ Million), Price (USD/Unit) and Gross Margin (2018-2023)
Table 143. Church & Dwight Contraceptives Product
Table 144. Church & Dwight Recent Developments/Updates
Table 145. The Cooper Companies Corporation Information
Table 146. The Cooper Companies Description and Business Overview
Table 147. The Cooper Companies Contraceptives Sales (M Units), Revenue (US$ Million), Price (USD/Unit) and Gross Margin (2018-2023)
Table 148. The Cooper Companies Contraceptives Product
Table 149. The Cooper Companies Recent Developments/Updates
Table 150. TherapeuticsMD Corporation Information
Table 151. TherapeuticsMD Description and Business Overview
Table 152. TherapeuticsMD Contraceptives Sales (M Units), Revenue (US$ Million), Price (USD/Unit) and Gross Margin (2018-2023)
Table 153. TherapeuticsMD Contraceptives Product
Table 154. TherapeuticsMD Recent Developments/Updates
Table 155. Afaxys Corporation Information
Table 156. Afaxys Description and Business Overview
Table 157. Afaxys Contraceptives Sales (M Units), Revenue (US$ Million), Price (USD/Unit) and Gross Margin (2018-2023)
Table 158. Afaxys Contraceptives Product
Table 159. Afaxys Recent Developments/Updates
Table 160. Mithra Pharmaceuticals Corporation Information
Table 161. Mithra Pharmaceuticals Description and Business Overview
Table 162. Mithra Pharmaceuticals Contraceptives Sales (M Units), Revenue (US$ Million), Price (USD/Unit) and Gross Margin (2018-2023)
Table 163. Mithra Pharmaceuticals Contraceptives Product
Table 164. Mithra Pharmaceuticals Recent Developments/Updates
Table 165. Key Raw Materials Lists
Table 166. Raw Materials Key Suppliers Lists
Table 167. Contraceptives Distributors List
Table 168. Contraceptives Customers List
Table 169. Contraceptives Market Trends
Table 170. Contraceptives Market Drivers
Table 171. Contraceptives Market Challenges
Table 172. Contraceptives Market Restraints
Table 173. Research Programs/Design for This Report
Table 174. Key Data Information from Secondary Sources
Table 175. Key Data Information from Primary Sources
List of Figures
Figure 1. Product Picture of Contraceptives
Figure 2. Global Contraceptives Market Value Comparison by Type (2023-2029) & (US$ Million)
Figure 3. Global Contraceptives Market Share by Type in 2022 & 2029
Figure 4. Pills Product Picture
Figure 5. Injectable Product Picture
Figure 6. Condoms Product Picture
Figure 7. Vaginal Rings Product Picture
Figure 8. IUDs Product Picture
Figure 9. Subdermal Implants Product Picture
Figure 10. Others Product Picture
Figure 11. Global Contraceptives Market Value Comparison by End User (2023-2029) & (US$ Million)
Figure 12. Global Contraceptives Market Share by End User in 2022 & 2029
Figure 13. 15–24 years
Figure 14. 25–34 years
Figure 15. 35–44 years
Figure 16. Above 44 years
Figure 17. Global Contraceptives Revenue, (US$ Million), 2018 VS 2022 VS 2029
Figure 18. Global Contraceptives Market Size (2018-2029) & (US$ Million)
Figure 19. Global Contraceptives Sales (2018-2029) & (M Units)
Figure 20. Global Contraceptives Average Price (USD/Unit) & (2018-2029)
Figure 21. Contraceptives Report Years Considered
Figure 22. Contraceptives Sales Share by Manufacturers in 2022
Figure 23. Global Contraceptives Revenue Share by Manufacturers in 2022
Figure 24. The Global 5 and 10 Largest Contraceptives Players: Market Share by Revenue in 2022
Figure 25. Contraceptives Market Share by Company Type (Tier 1, Tier 2 and Tier 3): 2018 VS 2022
Figure 26. Global Contraceptives Market Size by Region (US$ Million): 2018 VS 2022 VS 2029
Figure 27. North America Contraceptives Sales Market Share by Country (2018-2029)
Figure 28. North America Contraceptives Revenue Market Share by Country (2018-2029)
Figure 29. U.S. Contraceptives Revenue Growth Rate (2018-2029) & (US$ Million)
Figure 30. Canada Contraceptives Revenue Growth Rate (2018-2029) & (US$ Million)
Figure 31. Europe Contraceptives Sales Market Share by Country (2018-2029)
Figure 32. Europe Contraceptives Revenue Market Share by Country (2018-2029)
Figure 33. Germany Contraceptives Revenue Growth Rate (2018-2029) & (US$ Million)
Figure 34. France Contraceptives Revenue Growth Rate (2018-2029) & (US$ Million)
Figure 35. U.K. Contraceptives Revenue Growth Rate (2018-2029) & (US$ Million)
Figure 36. Italy Contraceptives Revenue Growth Rate (2018-2029) & (US$ Million)
Figure 37. Russia Contraceptives Revenue Growth Rate (2018-2029) & (US$ Million)
Figure 38. Asia Pacific Contraceptives Sales Market Share by Region (2018-2029)
Figure 39. Asia Pacific Contraceptives Revenue Market Share by Region (2018-2029)
Figure 40. China Contraceptives Revenue Growth Rate (2018-2029) & (US$ Million)
Figure 41. Japan Contraceptives Revenue Growth Rate (2018-2029) & (US$ Million)
Figure 42. South Korea Contraceptives Revenue Growth Rate (2018-2029) & (US$ Million)
Figure 43. India Contraceptives Revenue Growth Rate (2018-2029) & (US$ Million)
Figure 44. Australia Contraceptives Revenue Growth Rate (2018-2029) & (US$ Million)
Figure 45. Taiwan Contraceptives Revenue Growth Rate (2018-2029) & (US$ Million)
Figure 46. Indonesia Contraceptives Revenue Growth Rate (2018-2029) & (US$ Million)
Figure 47. Thailand Contraceptives Revenue Growth Rate (2018-2029) & (US$ Million)
Figure 48. Malaysia Contraceptives Revenue Growth Rate (2018-2029) & (US$ Million)
Figure 49. Philippines Contraceptives Revenue Growth Rate (2018-2029) & (US$ Million)
Figure 50. Latin America Contraceptives Sales Market Share by Country (2018-2029)
Figure 51. Latin America Contraceptives Revenue Market Share by Country (2018-2029)
Figure 52. Mexico Contraceptives Revenue Growth Rate (2018-2029) & (US$ Million)
Figure 53. Brazil Contraceptives Revenue Growth Rate (2018-2029) & (US$ Million)
Figure 54. Argentina Contraceptives Revenue Growth Rate (2018-2029) & (US$ Million)
Figure 55. Middle East & Africa Contraceptives Sales Market Share by Country (2018-2029)
Figure 56. Middle East & Africa Contraceptives Revenue Market Share by Country (2018-2029)
Figure 57. Turkey Contraceptives Revenue Growth Rate (2018-2029) & (US$ Million)
Figure 58. Saudi Arabia Contraceptives Revenue Growth Rate (2018-2029) & (US$ Million)
Figure 59. U.A.E Contraceptives Revenue Growth Rate (2018-2029) & (US$ Million)
Figure 60. Global Sales Market Share of Contraceptives by Type (2018-2029)
Figure 61. Global Revenue Market Share of Contraceptives by Type (2018-2029)
Figure 62. Global Contraceptives Price (USD/Unit) by Type (2018-2029)
Figure 63. Global Sales Market Share of Contraceptives by End User (2018-2029)
Figure 64. Global Revenue Market Share of Contraceptives by End User (2018-2029)
Figure 65. Global Contraceptives Price (USD/Unit) by End User (2018-2029)
Figure 66. Contraceptives Value Chain
Figure 67. Contraceptives Production Process
Figure 68. Channels of Distribution (Direct Vs Distribution)
Figure 69. Distributors Profiles
Figure 70. Bottom-up and Top-down Approaches for This Report
Figure 71. Data Triangulation
Figure 72. Key Executives Interviewed
$2900
$5800
HAVE A QUERY?
OUR CUSTOMER
