
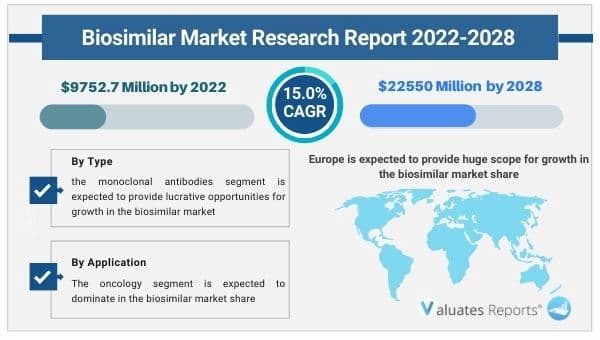
The Biosimilar market was valued at USD 9752.7 million in 2022, and it is anticipated to reach USD 22550 million by 2028, registering a CAGR of about 15.0% during the forecast period (2022–2028). Key drivers of the biosimilar market include the growing number of chronic diseases across the globe and the demand for biosimilars for their low costs.
<
Favorable regulatory policies for the adoption of biosimilar drugs in various countries and a quick approval process will create lucrative opportunities for the growth of the biosimilar market in the coming years. Moreover, the gradual patent expiry of biological drugs and government support will significantly boost market growth in the future.
The number of chronic diseases such as diabetes, cancer, autoimmune disorders, etc is growing rapidly. Biological drugs are expensive and take up a lot of time in research and development hampering widespread application. Hence Biosimilars play a crucial role in the treatment process as they are cheaper to develop and are price efficient enabling wider access to patients. Many life-saving treatment options are easily available to the masses. These factors are expected to propel the growth of the biosimilar market in the coming years.
The regulatory environments are changing rapidly. The favorable legal and approval systems for product development and usage have increased the introduction of various biosimilar drugs in the market. The decreasing time to market and cheaper development cost has enabled key market players to bring in more innovative products. This has broadened patients’ access and reduced healthcare expenses. Thus the favorable environment and other supportive policies will surge the growth of the biosimilar market during the forecast period.
The popularity of biological drugs is coming down. The increasing rate of patent expiries in blockbuster drugs has shifted the focus of manufacturers into developing biosimilar drugs without compromising on safety, efficacy, and purity. These drugs are comparatively cheaper and promote equitable access to advanced healthcare systems. Moreover, the government and other regulatory bodies are also extending support for increasing production. Hence the gradual patent expiry will create lucrative opportunities for biosimilar manufacturers thereby boosting the growth of the biosimilar market in the coming years.
Based on application, the oncology segment is expected to dominate in the biosimilar market share as cancer cases are growing and healthcare professionals are shifting to more cost-effective treatment options such as biosimilars for reducing the burden related to healthcare costs.
Based on type, the monoclonal antibodies segment is expected to provide lucrative opportunities for growth in the biosimilar market share as antibodies are used extensively for treating cancer and other autoimmune disorders.
Based on region, Europe is expected to provide huge scope for growth in the biosimilar market share due to increasing chronic diseases, the emergence of new products, patent expiry of blockbuster drugs.
By Type
By Application
By Region
|
Report Metric |
Details |
|
Base Year: |
2021 |
|
Market Size in 2022: |
USD 9752.7 Million |
|
Forecast Period: |
2022 to 2028 |
|
Forecast Period 2022 to 2028 CAGR: |
15.0% |
|
2028 Value Projection: |
USD 22550 Million |
|
No. of Pages: |
107 |
|
Tables & Figures |
136 |
|
Segments covered: |
Type, Application, Region |
Ans. The global Biosimilar market size is estimated to grow at a CAGR of 15.0% over the forecast timeframe and reach a market value of around USD 22550 million by 2028.
Ans. The global Biosimilar market value was valued at US$ 9752.7 million in 2022.
Ans. Key drivers of the biosimilar market include the growing number of chronic diseases across the globe and the demand for biosimilars for their low costs.
Ans. The forecast period considered for the global Biosimilar market is 2022 to 2028.
Ans. Europe is expected to provide huge scope for growth in the biosimilar market share
Ans. Based on type, the monoclonal antibodies segment is expected to provide lucrative opportunities for growth
1 Study Coverage
1.1 Biosimilar Product Introduction
1.2 Market by Type
1.2.1 Global Biosimilar Market Size Growth Rate by Type, 2017 VS 2021 VS 2028
1.2.2 Human Growth Hormones
1.2.3 Monoclonal Antibodies
1.2.4 Insulin
1.2.5 Peptides
1.2.6 Erythropoietin
1.2.7 Others
1.3 Market by Application
1.3.1 Global Biosimilar Market Size Growth Rate by Application, 2017 VS 2021 VS 2028
1.3.2 Oncology
1.3.3 Chronic and Autoimmune Diseases
1.3.4 Growth Hormone Deficiency
1.3.5 Infectious Diseases
1.3.6 Others
1.4 Study Objectives
1.5 Years Considered
2 Executive Summary
2.1 Global Biosimilar Sales Estimates and Forecasts 2017-2028
2.2 Global Biosimilar Revenue Estimates and Forecasts 2017-2028
2.3 Global Biosimilar Revenue by Region: 2017 VS 2021 VS 2028
2.4 Global Biosimilar Sales by Region
2.4.1 Global Biosimilar Sales by Region (2017-2022)
2.4.2 Global Sales Biosimilar by Region (2023-2028)
2.5 Global Biosimilar Revenue by Region
2.5.1 Global Biosimilar Revenue by Region (2017-2022)
2.5.2 Global Biosimilar Revenue by Region (2023-2028)
2.6 North America
2.7 Europe
2.8 Asia-Pacific
2.9 Latin America
2.10 Middle East & Africa
3 Competition by Manufacturers
3.1 Global Biosimilar Sales by Manufacturers
3.1.1 Global Top Biosimilar Manufacturers by Sales (2017-2022)
3.1.2 Global Biosimilar Sales Market Share by Manufacturers (2017-2022)
3.1.3 Global Top 10 and Top 5 Largest Manufacturers of Biosimilar in 2021
3.2 Global Biosimilar Revenue by Manufacturers
3.2.1 Global Biosimilar Revenue by Manufacturers (2017-2022)
3.2.2 Global Biosimilar Revenue Market Share by Manufacturers (2017-2022)
3.2.3 Global Top 10 and Top 5 Companies by Biosimilar Revenue in 2021
3.3 Global Biosimilar Sales Price by Manufacturers (2017-2022)
3.4 Analysis of Competitive Landscape
3.4.1 Manufacturers Market Concentration Ratio (CR5 and HHI)
3.4.2 Global Biosimilar Market Share by Company Type (Tier 1, Tier 2, and Tier 3)
3.4.3 Global Biosimilar Manufacturers Geographical Distribution
3.5 Mergers & Acquisitions, Expansion Plans
4 Market Size by Type
4.1 Global Biosimilar Sales by Type
4.1.1 Global Biosimilar Historical Sales by Type (2017-2022)
4.1.2 Global Biosimilar Forecasted Sales by Type (2023-2028)
4.1.3 Global Biosimilar Sales Market Share by Type (2017-2028)
4.2 Global Biosimilar Revenue by Type
4.2.1 Global Biosimilar Historical Revenue by Type (2017-2022)
4.2.2 Global Biosimilar Forecasted Revenue by Type (2023-2028)
4.2.3 Global Biosimilar Revenue Market Share by Type (2017-2028)
4.3 Global Biosimilar Price by Type
4.3.1 Global Biosimilar Price by Type (2017-2022)
4.3.2 Global Biosimilar Price Forecast by Type (2023-2028)
5 Market Size by Application
5.1 Global Biosimilar Sales by Application
5.1.1 Global Biosimilar Historical Sales by Application (2017-2022)
5.1.2 Global Biosimilar Forecasted Sales by Application (2023-2028)
5.1.3 Global Biosimilar Sales Market Share by Application (2017-2028)
5.2 Global Biosimilar Revenue by Application
5.2.1 Global Biosimilar Historical Revenue by Application (2017-2022)
5.2.2 Global Biosimilar Forecasted Revenue by Application (2023-2028)
5.2.3 Global Biosimilar Revenue Market Share by Application (2017-2028)
5.3 Global Biosimilar Price by Application
5.3.1 Global Biosimilar Price by Application (2017-2022)
5.3.2 Global Biosimilar Price Forecast by Application (2023-2028)
6 North America
6.1 North America Biosimilar Market Size by Type
6.1.1 North America Biosimilar Sales by Type (2017-2028)
6.1.2 North America Biosimilar Revenue by Type (2017-2028)
6.2 North America Biosimilar Market Size by Application
6.2.1 North America Biosimilar Sales by Application (2017-2028)
6.2.2 North America Biosimilar Revenue by Application (2017-2028)
6.3 North America Biosimilar Market Size by Country
6.3.1 North America Biosimilar Sales by Country (2017-2028)
6.3.2 North America Biosimilar Revenue by Country (2017-2028)
6.3.3 U.S.
6.3.4 Canada
7 Europe
7.1 Europe Biosimilar Market Size by Type
7.1.1 Europe Biosimilar Sales by Type (2017-2028)
7.1.2 Europe Biosimilar Revenue by Type (2017-2028)
7.2 Europe Biosimilar Market Size by Application
7.2.1 Europe Biosimilar Sales by Application (2017-2028)
7.2.2 Europe Biosimilar Revenue by Application (2017-2028)
7.3 Europe Biosimilar Market Size by Country
7.3.1 Europe Biosimilar Sales by Country (2017-2028)
7.3.2 Europe Biosimilar Revenue by Country (2017-2028)
7.3.3 Germany
7.3.4 France
7.3.5 U.K.
7.3.6 Italy
7.3.7 Russia
8 Asia Pacific
8.1 Asia Pacific Biosimilar Market Size by Type
8.1.1 Asia Pacific Biosimilar Sales by Type (2017-2028)
8.1.2 Asia Pacific Biosimilar Revenue by Type (2017-2028)
8.2 Asia Pacific Biosimilar Market Size by Application
8.2.1 Asia Pacific Biosimilar Sales by Application (2017-2028)
8.2.2 Asia Pacific Biosimilar Revenue by Application (2017-2028)
8.3 Asia Pacific Biosimilar Market Size by Region
8.3.1 Asia Pacific Biosimilar Sales by Region (2017-2028)
8.3.2 Asia Pacific Biosimilar Revenue by Region (2017-2028)
8.3.3 China
8.3.4 Japan
8.3.5 South Korea
8.3.6 India
8.3.7 Australia
8.3.8 Taiwan
8.3.9 Indonesia
8.3.10 Thailand
8.3.11 Malaysia
8.3.12 Philippines
9 Latin America
9.1 Latin America Biosimilar Market Size by Type
9.1.1 Latin America Biosimilar Sales by Type (2017-2028)
9.1.2 Latin America Biosimilar Revenue by Type (2017-2028)
9.2 Latin America Biosimilar Market Size by Application
9.2.1 Latin America Biosimilar Sales by Application (2017-2028)
9.2.2 Latin America Biosimilar Revenue by Application (2017-2028)
9.3 Latin America Biosimilar Market Size by Country
9.3.1 Latin America Biosimilar Sales by Country (2017-2028)
9.3.2 Latin America Biosimilar Revenue by Country (2017-2028)
9.3.3 Mexico
9.3.4 Brazil
9.3.5 Argentina
10 Middle East and Africa
10.1 Middle East and Africa Biosimilar Market Size by Type
10.1.1 Middle East and Africa Biosimilar Sales by Type (2017-2028)
10.1.2 Middle East and Africa Biosimilar Revenue by Type (2017-2028)
10.2 Middle East and Africa Biosimilar Market Size by Application
10.2.1 Middle East and Africa Biosimilar Sales by Application (2017-2028)
10.2.2 Middle East and Africa Biosimilar Revenue by Application (2017-2028)
10.3 Middle East and Africa Biosimilar Market Size by Country
10.3.1 Middle East and Africa Biosimilar Sales by Country (2017-2028)
10.3.2 Middle East and Africa Biosimilar Revenue by Country (2017-2028)
10.3.3 Turkey
10.3.4 Saudi Arabia
11 Company Profiles
11.1 Allergan plc
11.1.1 Allergan plc Corporation Information
11.1.2 Allergan plc Overview
11.1.3 Allergan plc Biosimilar Sales, Price, Revenue and Gross Margin (2017-2022)
11.1.4 Allergan plc Biosimilar Product Model Numbers, Pictures, Descriptions and Specifications
11.1.5 Allergan plc Recent Developments
11.2 BIOCAD
11.2.1 BIOCAD Corporation Information
11.2.2 BIOCAD Overview
11.2.3 BIOCAD Biosimilar Sales, Price, Revenue and Gross Margin (2017-2022)
11.2.4 BIOCAD Biosimilar Product Model Numbers, Pictures, Descriptions and Specifications
11.2.5 BIOCAD Recent Developments
11.3 Biocon
11.3.1 Biocon Corporation Information
11.3.2 Biocon Overview
11.3.3 Biocon Biosimilar Sales, Price, Revenue and Gross Margin (2017-2022)
11.3.4 Biocon Biosimilar Product Model Numbers, Pictures, Descriptions and Specifications
11.3.5 Biocon Recent Developments
11.4 BioXpress Therapeutics
11.4.1 BioXpress Therapeutics Corporation Information
11.4.2 BioXpress Therapeutics Overview
11.4.3 BioXpress Therapeutics Biosimilar Sales, Price, Revenue and Gross Margin (2017-2022)
11.4.4 BioXpress Therapeutics Biosimilar Product Model Numbers, Pictures, Descriptions and Specifications
11.4.5 BioXpress Therapeutics Recent Developments
11.5 Boehringer Ingelheim
11.5.1 Boehringer Ingelheim Corporation Information
11.5.2 Boehringer Ingelheim Overview
11.5.3 Boehringer Ingelheim Biosimilar Sales, Price, Revenue and Gross Margin (2017-2022)
11.5.4 Boehringer Ingelheim Biosimilar Product Model Numbers, Pictures, Descriptions and Specifications
11.5.5 Boehringer Ingelheim Recent Developments
11.6 Celltrion
11.6.1 Celltrion Corporation Information
11.6.2 Celltrion Overview
11.6.3 Celltrion Biosimilar Sales, Price, Revenue and Gross Margin (2017-2022)
11.6.4 Celltrion Biosimilar Product Model Numbers, Pictures, Descriptions and Specifications
11.6.5 Celltrion Recent Developments
11.7 Coherus BioSciences
11.7.1 Coherus BioSciences Corporation Information
11.7.2 Coherus BioSciences Overview
11.7.3 Coherus BioSciences Biosimilar Sales, Price, Revenue and Gross Margin (2017-2022)
11.7.4 Coherus BioSciences Biosimilar Product Model Numbers, Pictures, Descriptions and Specifications
11.7.5 Coherus BioSciences Recent Developments
11.8 Dr. Reddy’s Laboratories
11.8.1 Dr. Reddy’s Laboratories Corporation Information
11.8.2 Dr. Reddy’s Laboratories Overview
11.8.3 Dr. Reddy’s Laboratories Biosimilar Sales, Price, Revenue and Gross Margin (2017-2022)
11.8.4 Dr. Reddy’s Laboratories Biosimilar Product Model Numbers, Pictures, Descriptions and Specifications
11.8.5 Dr. Reddy’s Laboratories Recent Developments
11.9 Genor BioPharma
11.9.1 Genor BioPharma Corporation Information
11.9.2 Genor BioPharma Overview
11.9.3 Genor BioPharma Biosimilar Sales, Price, Revenue and Gross Margin (2017-2022)
11.9.4 Genor BioPharma Biosimilar Product Model Numbers, Pictures, Descriptions and Specifications
11.9.5 Genor BioPharma Recent Developments
11.10 Intas Pharmaceuticals Limited
11.10.1 Intas Pharmaceuticals Limited Corporation Information
11.10.2 Intas Pharmaceuticals Limited Overview
11.10.3 Intas Pharmaceuticals Limited Biosimilar Sales, Price, Revenue and Gross Margin (2017-2022)
11.10.4 Intas Pharmaceuticals Limited Biosimilar Product Model Numbers, Pictures, Descriptions and Specifications
11.10.5 Intas Pharmaceuticals Limited Recent Developments
11.11 Novartis
11.11.1 Novartis Corporation Information
11.11.2 Novartis Overview
11.11.3 Novartis Biosimilar Sales, Price, Revenue and Gross Margin (2017-2022)
11.11.4 Novartis Biosimilar Product Model Numbers, Pictures, Descriptions and Specifications
11.11.5 Novartis Recent Developments
11.12 Pfizer
11.12.1 Pfizer Corporation Information
11.12.2 Pfizer Overview
11.12.3 Pfizer Biosimilar Sales, Price, Revenue and Gross Margin (2017-2022)
11.12.4 Pfizer Biosimilar Product Model Numbers, Pictures, Descriptions and Specifications
11.12.5 Pfizer Recent Developments
12 Industry Chain and Sales Channels Analysis
12.1 Biosimilar Industry Chain Analysis
12.2 Biosimilar Key Raw Materials
12.2.1 Key Raw Materials
12.2.2 Raw Materials Key Suppliers
12.3 Biosimilar Production Mode & Process
12.4 Biosimilar Sales and Marketing
12.4.1 Biosimilar Sales Channels
12.4.2 Biosimilar Distributors
12.5 Biosimilar Customers
13 Market Drivers, Opportunities, Challenges and Risks Factors Analysis
13.1 Biosimilar Industry Trends
13.2 Biosimilar Market Drivers
13.3 Biosimilar Market Challenges
13.4 Biosimilar Market Restraints
14 Key Findings in The Global Biosimilar Study
15 Appendix
15.1 Research Methodology
15.1.1 Methodology/Research Approach
15.1.2 Data Source
15.2 Author Details
15.3 Disclaimer
Table 1. Global Biosimilar Market Size Growth Rate by Type, 2017 VS 2021 VS 2028 (US$ Million)
Table 2. Major Manufacturers of Human Growth Hormones
Table 3. Major Manufacturers of Monoclonal Antibodies
Table 4. Major Manufacturers of Insulin
Table 5. Major Manufacturers of Peptides
Table 6. Major Manufacturers of Erythropoietin
Table 7. Major Manufacturers of Others
Table 8. Global Biosimilar Market Size Growth Rate by Application, 2017 VS 2021 VS 2028 (US$ Million)
Table 9. Global Biosimilar Revenue by Region: 2017 VS 2021 VS 2028 (US$ Million)
Table 10. Global Biosimilar Sales by Region (2017-2022) & (K Units)
Table 11. Global Biosimilar Sales Market Share by Region (2017-2022)
Table 12. Global Biosimilar Sales by Region (2023-2028) & (K Units)
Table 13. Global Biosimilar Sales Market Share by Region (2023-2028)
Table 14. Global Biosimilar Revenue by Region (2017-2022) & (US$ Million)
Table 15. Global Biosimilar Revenue Market Share by Region (2017-2022)
Table 16. Global Biosimilar Revenue by Region (2023-2028) & (US$ Million)
Table 17. Global Biosimilar Revenue Market Share by Region (2023-2028)
Table 18. Global Biosimilar Sales by Manufacturers (2017-2022) & (K Units)
Table 19. Global Biosimilar Sales Share by Manufacturers (2017-2022)
Table 20. Global Biosimilar Revenue by Manufacturers (2017-2022) & (US$ Million)
Table 21. Global Biosimilar Revenue Share by Manufacturers (2017-2022)
Table 22. Biosimilar Price by Manufacturers (2017-2022) &(US$/Unit)
Table 23. Global Biosimilar Manufacturers Market Concentration Ratio (CR5 and HHI)
Table 24. Global Biosimilar by Company Type (Tier 1, Tier 2, and Tier 3) & (based on the Revenue in Biosimilar as of 2021)
Table 25. Biosimilar Manufacturing Base Distribution and Headquarters
Table 26. Manufacturers Biosimilar Product Offered
Table 27. Date of Manufacturers Enter into Biosimilar Market
Table 28. Mergers & Acquisitions, Expansion Plans
Table 29. Global Biosimilar Sales by Type (2017-2022) & (K Units)
Table 30. Global Biosimilar Sales by Type (2023-2028) & (K Units)
Table 31. Global Biosimilar Sales Share by Type (2017-2022)
Table 32. Global Biosimilar Sales Share by Type (2023-2028)
Table 33. Global Biosimilar Revenue by Type (2017-2022) & (US$ Million)
Table 34. Global Biosimilar Revenue by Type (2023-2028) & (US$ Million)
Table 35. Global Biosimilar Revenue Share by Type (2017-2022)
Table 36. Global Biosimilar Revenue Share by Type (2023-2028)
Table 37. Biosimilar Price by Type (2017-2022) & (US$/Unit)
Table 38. Global Biosimilar Price Forecast by Type (2023-2028) & (US$/Unit)
Table 39. Global Biosimilar Sales by Application (2017-2022) & (K Units)
Table 40. Global Biosimilar Sales by Application (2023-2028) & (K Units)
Table 41. Global Biosimilar Sales Share by Application (2017-2022)
Table 42. Global Biosimilar Sales Share by Application (2023-2028)
Table 43. Global Biosimilar Revenue by Application (2017-2022) & (US$ Million)
Table 44. Global Biosimilar Revenue by Application (2023-2028) & (US$ Million)
Table 45. Global Biosimilar Revenue Share by Application (2017-2022)
Table 46. Global Biosimilar Revenue Share by Application (2023-2028)
Table 47. Biosimilar Price by Application (2017-2022) & (US$/Unit)
Table 48. Global Biosimilar Price Forecast by Application (2023-2028) & (US$/Unit)
Table 49. North America Biosimilar Sales by Type (2017-2022) & (K Units)
Table 50. North America Biosimilar Sales by Type (2023-2028) & (K Units)
Table 51. North America Biosimilar Revenue by Type (2017-2022) & (US$ Million)
Table 52. North America Biosimilar Revenue by Type (2023-2028) & (US$ Million)
Table 53. North America Biosimilar Sales by Application (2017-2022) & (K Units)
Table 54. North America Biosimilar Sales by Application (2023-2028) & (K Units)
Table 55. North America Biosimilar Revenue by Application (2017-2022) & (US$ Million)
Table 56. North America Biosimilar Revenue by Application (2023-2028) & (US$ Million)
Table 57. North America Biosimilar Sales by Country (2017-2022) & (K Units)
Table 58. North America Biosimilar Sales by Country (2023-2028) & (K Units)
Table 59. North America Biosimilar Revenue by Country (2017-2022) & (US$ Million)
Table 60. North America Biosimilar Revenue by Country (2023-2028) & (US$ Million)
Table 61. Europe Biosimilar Sales by Type (2017-2022) & (K Units)
Table 62. Europe Biosimilar Sales by Type (2023-2028) & (K Units)
Table 63. Europe Biosimilar Revenue by Type (2017-2022) & (US$ Million)
Table 64. Europe Biosimilar Revenue by Type (2023-2028) & (US$ Million)
Table 65. Europe Biosimilar Sales by Application (2017-2022) & (K Units)
Table 66. Europe Biosimilar Sales by Application (2023-2028) & (K Units)
Table 67. Europe Biosimilar Revenue by Application (2017-2022) & (US$ Million)
Table 68. Europe Biosimilar Revenue by Application (2023-2028) & (US$ Million)
Table 69. Europe Biosimilar Sales by Country (2017-2022) & (K Units)
Table 70. Europe Biosimilar Sales by Country (2023-2028) & (K Units)
Table 71. Europe Biosimilar Revenue by Country (2017-2022) & (US$ Million)
Table 72. Europe Biosimilar Revenue by Country (2023-2028) & (US$ Million)
Table 73. Asia Pacific Biosimilar Sales by Type (2017-2022) & (K Units)
Table 74. Asia Pacific Biosimilar Sales by Type (2023-2028) & (K Units)
Table 75. Asia Pacific Biosimilar Revenue by Type (2017-2022) & (US$ Million)
Table 76. Asia Pacific Biosimilar Revenue by Type (2023-2028) & (US$ Million)
Table 77. Asia Pacific Biosimilar Sales by Application (2017-2022) & (K Units)
Table 78. Asia Pacific Biosimilar Sales by Application (2023-2028) & (K Units)
Table 79. Asia Pacific Biosimilar Revenue by Application (2017-2022) & (US$ Million)
Table 80. Asia Pacific Biosimilar Revenue by Application (2023-2028) & (US$ Million)
Table 81. Asia Pacific Biosimilar Sales by Region (2017-2022) & (K Units)
Table 82. Asia Pacific Biosimilar Sales by Region (2023-2028) & (K Units)
Table 83. Asia Pacific Biosimilar Revenue by Region (2017-2022) & (US$ Million)
Table 84. Asia Pacific Biosimilar Revenue by Region (2023-2028) & (US$ Million)
Table 85. Latin America Biosimilar Sales by Type (2017-2022) & (K Units)
Table 86. Latin America Biosimilar Sales by Type (2023-2028) & (K Units)
Table 87. Latin America Biosimilar Revenue by Type (2017-2022) & (US$ Million)
Table 88. Latin America Biosimilar Revenue by Type (2023-2028) & (US$ Million)
Table 89. Latin America Biosimilar Sales by Application (2017-2022) & (K Units)
Table 90. Latin America Biosimilar Sales by Application (2023-2028) & (K Units)
Table 91. Latin America Biosimilar Revenue by Application (2017-2022) & (US$ Million)
Table 92. Latin America Biosimilar Revenue by Application (2023-2028) & (US$ Million)
Table 93. Latin America Biosimilar Sales by Country (2017-2022) & (K Units)
Table 94. Latin America Biosimilar Sales by Country (2023-2028) & (K Units)
Table 95. Latin America Biosimilar Revenue by Country (2017-2022) & (US$ Million)
Table 96. Latin America Biosimilar Revenue by Country (2023-2028) & (US$ Million)
Table 97. Middle East and Africa Biosimilar Sales by Type (2017-2022) & (K Units)
Table 98. Middle East and Africa Biosimilar Sales by Type (2023-2028) & (K Units)
Table 99. Middle East and Africa Biosimilar Revenue by Type (2017-2022) & (US$ Million)
Table 100. Middle East and Africa Biosimilar Revenue by Type (2023-2028) & (US$ Million)
Table 101. Middle East and Africa Biosimilar Sales by Application (2017-2022) & (K Units)
Table 102. Middle East and Africa Biosimilar Sales by Application (2023-2028) & (K Units)
Table 103. Middle East and Africa Biosimilar Revenue by Application (2017-2022) & (US$ Million)
Table 104. Middle East and Africa Biosimilar Revenue by Application (2023-2028) & (US$ Million)
Table 105. Middle East and Africa Biosimilar Sales by Country (2017-2022) & (K Units)
Table 106. Middle East and Africa Biosimilar Sales by Country (2023-2028) & (K Units)
Table 107. Middle East and Africa Biosimilar Revenue by Country (2017-2022) & (US$ Million)
Table 108. Middle East and Africa Biosimilar Revenue by Country (2023-2028) & (US$ Million)
Table 109. Allergan plc Corporation Information
Table 110. Allergan plc Description and Major Businesses
Table 111. Allergan plc Biosimilar Sales (K Units), Revenue (US$ Million), Price (US$/Unit) and Gross Margin (2017-2022)
Table 112. Allergan plc Biosimilar Product Model Numbers, Pictures, Descriptions and Specifications
Table 113. Allergan plc Recent Developments
Table 114. BIOCAD Corporation Information
Table 115. BIOCAD Description and Major Businesses
Table 116. BIOCAD Biosimilar Sales (K Units), Revenue (US$ Million), Price (US$/Unit) and Gross Margin (2017-2022)
Table 117. BIOCAD Biosimilar Product Model Numbers, Pictures, Descriptions and Specifications
Table 118. BIOCAD Recent Developments
Table 119. Biocon Corporation Information
Table 120. Biocon Description and Major Businesses
Table 121. Biocon Biosimilar Sales (K Units), Revenue (US$ Million), Price (US$/Unit) and Gross Margin (2017-2022)
Table 122. Biocon Biosimilar Product Model Numbers, Pictures, Descriptions and Specifications
Table 123. Biocon Recent Developments
Table 124. BioXpress Therapeutics Corporation Information
Table 125. BioXpress Therapeutics Description and Major Businesses
Table 126. BioXpress Therapeutics Biosimilar Sales (K Units), Revenue (US$ Million), Price (US$/Unit) and Gross Margin (2017-2022)
Table 127. BioXpress Therapeutics Biosimilar Product Model Numbers, Pictures, Descriptions and Specifications
Table 128. BioXpress Therapeutics Recent Developments
Table 129. Boehringer Ingelheim Corporation Information
Table 130. Boehringer Ingelheim Description and Major Businesses
Table 131. Boehringer Ingelheim Biosimilar Sales (K Units), Revenue (US$ Million), Price (US$/Unit) and Gross Margin (2017-2022)
Table 132. Boehringer Ingelheim Biosimilar Product Model Numbers, Pictures, Descriptions and Specifications
Table 133. Boehringer Ingelheim Recent Developments
Table 134. Celltrion Corporation Information
Table 135. Celltrion Description and Major Businesses
Table 136. Celltrion Biosimilar Sales (K Units), Revenue (US$ Million), Price (US$/Unit) and Gross Margin (2017-2022)
Table 137. Celltrion Biosimilar Product Model Numbers, Pictures, Descriptions and Specifications
Table 138. Celltrion Recent Developments
Table 139. Coherus BioSciences Corporation Information
Table 140. Coherus BioSciences Description and Major Businesses
Table 141. Coherus BioSciences Biosimilar Sales (K Units), Revenue (US$ Million), Price (US$/Unit) and Gross Margin (2017-2022)
Table 142. Coherus BioSciences Biosimilar Product Model Numbers, Pictures, Descriptions and Specifications
Table 143. Coherus BioSciences Recent Developments
Table 144. Dr. Reddy’s Laboratories Corporation Information
Table 145. Dr. Reddy’s Laboratories Description and Major Businesses
Table 146. Dr. Reddy’s Laboratories Biosimilar Sales (K Units), Revenue (US$ Million), Price (US$/Unit) and Gross Margin (2017-2022)
Table 147. Dr. Reddy’s Laboratories Biosimilar Product Model Numbers, Pictures, Descriptions and Specifications
Table 148. Dr. Reddy’s Laboratories Recent Developments
Table 149. Genor BioPharma Corporation Information
Table 150. Genor BioPharma Description and Major Businesses
Table 151. Genor BioPharma Biosimilar Sales (K Units), Revenue (US$ Million), Price (US$/Unit) and Gross Margin (2017-2022)
Table 152. Genor BioPharma Biosimilar Product Model Numbers, Pictures, Descriptions and Specifications
Table 153. Genor BioPharma Recent Developments
Table 154. Intas Pharmaceuticals Limited Corporation Information
Table 155. Intas Pharmaceuticals Limited Description and Major Businesses
Table 156. Intas Pharmaceuticals Limited Biosimilar Sales (K Units), Revenue (US$ Million), Price (US$/Unit) and Gross Margin (2017-2022)
Table 157. Intas Pharmaceuticals Limited Biosimilar Product Model Numbers, Pictures, Descriptions and Specifications
Table 158. Intas Pharmaceuticals Limited Recent Developments
Table 159. Novartis Corporation Information
Table 160. Novartis Description and Major Businesses
Table 161. Novartis Biosimilar Sales (K Units), Revenue (US$ Million), Price (US$/Unit) and Gross Margin (2017-2022)
Table 162. Novartis Biosimilar Product Model Numbers, Pictures, Descriptions and Specifications
Table 163. Novartis Recent Developments
Table 164. Pfizer Corporation Information
Table 165. Pfizer Description and Major Businesses
Table 166. Pfizer Biosimilar Sales (K Units), Revenue (US$ Million), Price (US$/Unit) and Gross Margin (2017-2022)
Table 167. Pfizer Biosimilar Product Model Numbers, Pictures, Descriptions and Specifications
Table 168. Pfizer Recent Developments
Table 169. Key Raw Materials Lists
Table 170. Raw Materials Key Suppliers Lists
Table 171. Biosimilar Distributors List
Table 172. Biosimilar Customers List
Table 173. Biosimilar Market Trends
Table 174. Biosimilar Market Drivers
Table 175. Biosimilar Market Challenges
Table 176. Biosimilar Market Restraints
Table 177. Research Programs/Design for This Report
Table 178. Key Data Information from Secondary Sources
Table 179. Key Data Information from Primary Sources
List of Figures
Figure 1. Biosimilar Product Picture
Figure 3. Global Biosimilar Market Share by Type in 2021 & 2028
Figure 3. Human Growth Hormones Product Picture
Figure 4. Monoclonal Antibodies Product Picture
Figure 5. Insulin Product Picture
Figure 6. Peptides Product Picture
Figure 7. Erythropoietin Product Picture
Figure 8. Others Product Picture
Figure 9. Global Biosimilar Market Share by Application in 2021 & 2028
Figure 10. Oncology
Figure 11. Chronic and Autoimmune Diseases
Figure 12. Growth Hormone Deficiency
Figure 13. Infectious Diseases
Figure 14. Others
Figure 15. Biosimilar Report Years Considered
Figure 16. Global Biosimilar Sales 2017-2028 (K Units)
Figure 17. Global Biosimilar Revenue, (US$ Million), 2017 VS 2021 VS 2028
Figure 18. Global Biosimilar Revenue 2017-2028 (US$ Million)
Figure 19. Global Biosimilar Revenue Market Share by Region in Percentage: 2021 Versus 2028
Figure 20. Global Biosimilar Sales Market Share by Region (2017-2022)
Figure 21. Global Biosimilar Sales Market Share by Region (2023-2028)
Figure 22. North America Biosimilar Sales YoY (2017-2028) & (K Units)
Figure 23. North America Biosimilar Revenue YoY (2017-2028) & (US$ Million)
Figure 24. Europe Biosimilar Sales YoY (2017-2028) & (K Units)
Figure 25. Europe Biosimilar Revenue YoY (2017-2028) & (US$ Million)
Figure 26. Asia-Pacific Biosimilar Sales YoY (2017-2028) & (K Units)
Figure 27. Asia-Pacific Biosimilar Revenue YoY (2017-2028) & (US$ Million)
Figure 28. Latin America Biosimilar Sales YoY (2017-2028) & (K Units)
Figure 29. Latin America Biosimilar Revenue YoY (2017-2028) & (US$ Million)
Figure 30. Middle East & Africa Biosimilar Sales YoY (2017-2028) & (K Units)
Figure 31. Middle East & Africa Biosimilar Revenue YoY (2017-2028) & (US$ Million)
Figure 32. The Biosimilar Market Share of Top 10 and Top 5 Largest Manufacturers Around the World in 2021
Figure 33. The Top 5 and 10 Largest Manufacturers of Biosimilar in the World: Market Share by Biosimilar Revenue in 2021
Figure 34. Global Biosimilar Market Share by Company Type (Tier 1, Tier 2, and Tier 3): 2017 VS 2021
Figure 35. Global Biosimilar Sales Market Share by Type (2017-2028)
Figure 36. Global Biosimilar Revenue Market Share by Type (2017-2028)
Figure 37. Global Biosimilar Sales Market Share by Application (2017-2028)
Figure 38. Global Biosimilar Revenue Market Share by Application (2017-2028)
Figure 39. North America Biosimilar Sales Market Share by Type (2017-2028)
Figure 40. North America Biosimilar Revenue Market Share by Type (2017-2028)
Figure 41. North America Biosimilar Sales Market Share by Application (2017-2028)
Figure 42. North America Biosimilar Revenue Market Share by Application (2017-2028)
Figure 43. North America Biosimilar Sales Share by Country (2017-2028)
Figure 44. North America Biosimilar Revenue Share by Country (2017-2028)
Figure 45. U.S. Biosimilar Revenue (2017-2028) & (US$ Million)
Figure 46. Canada Biosimilar Revenue (2017-2028) & (US$ Million)
Figure 47. Europe Biosimilar Sales Market Share by Type (2017-2028)
Figure 48. Europe Biosimilar Revenue Market Share by Type (2017-2028)
Figure 49. Europe Biosimilar Sales Market Share by Application (2017-2028)
Figure 50. Europe Biosimilar Revenue Market Share by Application (2017-2028)
Figure 51. Europe Biosimilar Sales Share by Country (2017-2028)
Figure 52. Europe Biosimilar Revenue Share by Country (2017-2028)
Figure 53. Germany Biosimilar Revenue (2017-2028) & (US$ Million)
Figure 54. France Biosimilar Revenue (2017-2028) & (US$ Million)
Figure 55. U.K. Biosimilar Revenue (2017-2028) & (US$ Million)
Figure 56. Italy Biosimilar Revenue (2017-2028) & (US$ Million)
Figure 57. Russia Biosimilar Revenue (2017-2028) & (US$ Million)
Figure 58. Asia Pacific Biosimilar Sales Market Share by Type (2017-2028)
Figure 59. Asia Pacific Biosimilar Revenue Market Share by Type (2017-2028)
Figure 60. Asia Pacific Biosimilar Sales Market Share by Application (2017-2028)
Figure 61. Asia Pacific Biosimilar Revenue Market Share by Application (2017-2028)
Figure 62. Asia Pacific Biosimilar Sales Share by Region (2017-2028)
Figure 63. Asia Pacific Biosimilar Revenue Share by Region (2017-2028)
Figure 64. China Biosimilar Revenue (2017-2028) & (US$ Million)
Figure 65. Japan Biosimilar Revenue (2017-2028) & (US$ Million)
Figure 66. South Korea Biosimilar Revenue (2017-2028) & (US$ Million)
Figure 67. India Biosimilar Revenue (2017-2028) & (US$ Million)
Figure 68. Australia Biosimilar Revenue (2017-2028) & (US$ Million)
Figure 69. Taiwan Biosimilar Revenue (2017-2028) & (US$ Million)
Figure 70. Indonesia Biosimilar Revenue (2017-2028) & (US$ Million)
Figure 71. Thailand Biosimilar Revenue (2017-2028) & (US$ Million)
Figure 72. Malaysia Biosimilar Revenue (2017-2028) & (US$ Million)
Figure 73. Philippines Biosimilar Revenue (2017-2028) & (US$ Million)
Figure 74. Latin America Biosimilar Sales Market Share by Type (2017-2028)
Figure 75. Latin America Biosimilar Revenue Market Share by Type (2017-2028)
Figure 76. Latin America Biosimilar Sales Market Share by Application (2017-2028)
Figure 77. Latin America Biosimilar Revenue Market Share by Application (2017-2028)
Figure 78. Latin America Biosimilar Sales Share by Country (2017-2028)
Figure 79. Latin America Biosimilar Revenue Share by Country (2017-2028)
Figure 80. Mexico Biosimilar Revenue (2017-2028) & (US$ Million)
Figure 81. Brazil Biosimilar Revenue (2017-2028) & (US$ Million)
Figure 82. Argentina Biosimilar Revenue (2017-2028) & (US$ Million)
Figure 83. Middle East and Africa Biosimilar Sales Market Share by Type (2017-2028)
Figure 84. Middle East and Africa Biosimilar Revenue Market Share by Type (2017-2028)
Figure 85. Middle East and Africa Biosimilar Sales Market Share by Application (2017-2028)
Figure 86. Middle East and Africa Biosimilar Revenue Market Share by Application (2017-2028)
Figure 87. Middle East and Africa Biosimilar Sales Share by Country (2017-2028)
Figure 88. Middle East and Africa Biosimilar Revenue Share by Country (2017-2028)
Figure 89. Turkey Biosimilar Revenue (2017-2028) & (US$ Million)
Figure 90. Saudi Arabia Biosimilar Revenue (2017-2028) & (US$ Million)
Figure 91. U.A.E Biosimilar Revenue (2017-2028) & (US$ Million)
Figure 92. Biosimilar Value Chain
Figure 93. Biosimilar Production Process
Figure 94. Channels of Distribution
Figure 95. Distributors Profiles
Figure 96. Bottom-up and Top-down Approaches for This Report
Figure 97. Data Triangulation
Figure 98. Key Executives Interviewed
$4900
$7350
$9800
HAVE A QUERY?
OUR CUSTOMER
