
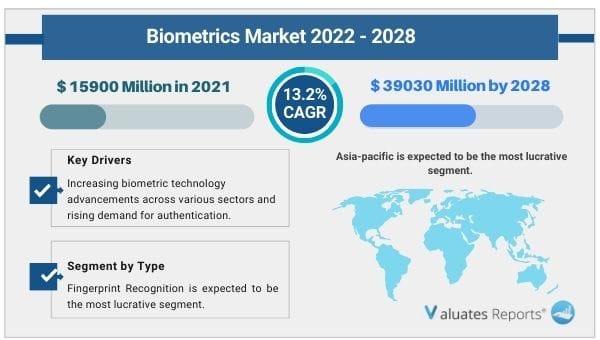
The global Biometrics market size is projected to reach US$ 39030 million by 2028, from US$ 15900 million in 2021, at a CAGR of 13.2% during 2022-2028. Key drivers of the biometrics market include the growing application in the military sector.
The need for security, civil authentication, and identification will bolster the growth prospects of the biometrics market during the forecast period. The rapid technological developments in the biometrics field will fuel the market demand in the upcoming years.
Military use
Identification of individuals based on their biological features is a quick way to ensure optimum security. Biometrics are used extensively to gain access to crucial military installations through verification. Army personnel uses this technology to identify enemy forces and scan people at checkpoints. It is an efficient patrolling device in an emergency situation and is also used for kinetic targeting. Facial recognition, fingerprint, and iris recognition are just some of the ways to verify an individual’s identity. These factors will drive the growth of the biometrics market during the forecast period.
Civil authorization
Biometrics for civil identification is an increasing trend. Fake id cards are a real nuisance and can be easily duplicated. Biometrics aids in the proper implementation of government benefits and law enforcement. It carefully stores and processes criminal records, identifies thieves, and terrorists, and helps the government in serving citizens better from anti-social elements. Furthermore, government authorities are able to send welfare, food, and subsidies to the right group of people with fingerprint verification of the actual person’s identity. It also helps in proper voter card registration and eliminates the hassle of carrying badges or cards everywhere. Verifying a person’s identity based on his/her behavior and anatomical characteristics is highly accurate. Such factors will surge the growth of the biometrics market in the subsequent years.
Innovations in technology
Due to growing privacy concerns and sophistication in the identity theft industry players are investing heavily into R&D activities to increase the capabilities of biometric systems. There is finger vein recognition which is hard to copy and highly accurate. Near-infrared light is directed towards the finger which is absorbed by the hemoglobin present in the blood of the veins. The veins are illuminated and an image is captured based on those unique patterns on a sensor nearby. These are precise, provide convenience, and are very hard to duplicate or forge. These ongoing developments will spur the growth of the biometrics market in the future. Then there are 3D recognition, sensor interoperability, etc.
Based on type, the segmentations are fingerprint, iris, and facial recognition. Fingerprint recognition deals with comparing the structures of a person’s fingerprint with previously collected samples. On the other hand, facial involves structuring the details of a human face from a digital image. Iris recognition is an automated biometric system based on collecting detailed samples of an individual’s irises.
Based on application, the civil segment is expected to dominate in the biometrics market share as government authorities increasingly use these systems to maintain proper law and order. Corruption is reduced significantly.
Based on region, Asia-Pacific will maintain the lead in the biometrics market share due to growing technological advancements, a rise in awareness levels, economic growth, and reduced costs.
| Report Metric | Details |
| Report Name | Biometrics Market |
| The market size in 2021 | USD 15900 Million |
| The revenue forecast in 2028 | USD 39030 Million |
| Growth Rate | Compound Annual Growth Rate (CAGR) of 13.2% from 2022 to 2028 |
| Market size available for years | 2022-2028 |
| Forecast units | Value (USD) |
| Segments covered | Type, Application & Regions |
| Report coverage | Revenue & volume forecast, company share, competitive landscape, growth factors, and trends |
| Geographic regions covered | North America, Europe, Asia Pacific, Latin America, Middle East & Africa |
Ans. The global Biometrics market size is projected to reach US$ 39030 million by 2028, from US$ 15900 million in 2021.
Ans. Biometrics market is expected to grow at a compound annual growth rate of 13.2% from 2022 to 2028.
Ans. 3M Cogent, Inc., Crossmatch, M2SYS Technology, NEC Corporation, Safran Identity and Security, Aware, Inc., BIO-Key International, Inc., Fulcrum Biometrics LLC, HID Global Corporation
Table of Contents
1 Report Business Overview
1.1 Study Scope
1.2 Market Analysis by Type
1.2.1 Global Biometrics Market Size Growth Rate by Type, 2017 VS 2021 VS 2028
1.2.2 Fingerprint Recognition
1.2.3 Facial Recognition
1.2.4 Iris Recognition
1.3 Market by Application
1.3.1 Global Biometrics Market Size Growth Rate by Application, 2017 VS 2021 VS 2028
1.3.2 Military
1.3.3 Civil
1.4 Study Objectives
1.5 Years Considered
2 Global Growth Trends
2.1 Global Biometrics Market Perspective (2017-2028)
2.2 Biometrics Growth Trends by Region
2.2.1 Biometrics Market Size by Region: 2017 VS 2021 VS 2028
2.2.2 Biometrics Historic Market Size by Region (2017-2022)
2.2.3 Biometrics Forecasted Market Size by Region (2023-2028)
2.3 Biometrics Market Dynamics
2.3.1 Biometrics Industry Trends
2.3.2 Biometrics Market Drivers
2.3.3 Biometrics Market Challenges
2.3.4 Biometrics Market Restraints
3 Competition Landscape by Key Players
3.1 Global Top Biometrics Players by Revenue
3.1.1 Global Top Biometrics Players by Revenue (2017-2022)
3.1.2 Global Biometrics Revenue Market Share by Players (2017-2022)
3.2 Global Biometrics Market Share by Company Type (Tier 1, Tier 2, and Tier 3)
3.3 Players Covered: Ranking by Biometrics Revenue
3.4 Global Biometrics Market Concentration Ratio
3.4.1 Global Biometrics Market Concentration Ratio (CR5 and HHI)
3.4.2 Global Top 10 and Top 5 Companies by Biometrics Revenue in 2021
3.5 Biometrics Key Players Head office and Area Served
3.6 Key Players Biometrics Product Solution and Service
3.7 Date of Enter into Biometrics Market
3.8 Mergers & Acquisitions, Expansion Plans
4 Biometrics Breakdown Data by Type
4.1 Global Biometrics Historic Market Size by Type (2017-2022)
4.2 Global Biometrics Forecasted Market Size by Type (2023-2028)
5 Biometrics Breakdown Data by Application
5.1 Global Biometrics Historic Market Size by Application (2017-2022)
5.2 Global Biometrics Forecasted Market Size by Application (2023-2028)
6 North America
6.1 North America Biometrics Market Size (2017-2028)
6.2 North America Biometrics Market Size by Type
6.2.1 North America Biometrics Market Size by Type (2017-2022)
6.2.2 North America Biometrics Market Size by Type (2023-2028)
6.2.3 North America Biometrics Market Share by Type (2017-2028)
6.3 North America Biometrics Market Size by Application
6.3.1 North America Biometrics Market Size by Application (2017-2022)
6.3.2 North America Biometrics Market Size by Application (2023-2028)
6.3.3 North America Biometrics Market Share by Application (2017-2028)
6.4 North America Biometrics Market Size by Country
6.4.1 North America Biometrics Market Size by Country (2017-2022)
6.4.2 North America Biometrics Market Size by Country (2023-2028)
6.4.3 U.S.
6.4.4 Canada
7 Europe
7.1 Europe Biometrics Market Size (2017-2028)
7.2 Europe Biometrics Market Size by Type
7.2.1 Europe Biometrics Market Size by Type (2017-2022)
7.2.2 Europe Biometrics Market Size by Type (2023-2028)
7.2.3 Europe Biometrics Market Share by Type (2017-2028)
7.3 Europe Biometrics Market Size by Application
7.3.1 Europe Biometrics Market Size by Application (2017-2022)
7.3.2 Europe Biometrics Market Size by Application (2023-2028)
7.3.3 Europe Biometrics Market Share by Application (2017-2028)
7.4 Europe Biometrics Market Size by Country
7.4.1 Europe Biometrics Market Size by Country (2017-2022)
7.4.2 Europe Biometrics Market Size by Country (2023-2028)
7.4.3 Germany
7.4.4 France
7.4.5 U.K.
7.4.6 Italy
7.4.7 Russia
7.4.8 Nordic Countries
8 Asia-Pacific
8.1 Asia-Pacific Biometrics Market Size (2017-2028)
8.2 Asia-Pacific Biometrics Market Size by Type
8.2.1 Asia-Pacific Biometrics Market Size by Type (2017-2022)
8.2.2 Asia-Pacific Biometrics Market Size by Type (2023-2028)
8.2.3 Asia-Pacific Biometrics Market Share by Type (2017-2028)
8.3 Asia-Pacific Biometrics Market Size by Application
8.3.1 Asia-Pacific Biometrics Market Size by Application (2017-2022)
8.3.2 Asia-Pacific Biometrics Market Size by Application (2023-2028)
8.3.3 Asia-Pacific Biometrics Market Share by Application (2017-2028)
8.4 Asia-Pacific Biometrics Market Size by Region
8.4.1 Asia-Pacific Biometrics Market Size by Region (2017-2022)
8.4.2 Asia-Pacific Biometrics Market Size by Region (2023-2028)
8.4.3 China
8.4.4 Japan
8.4.5 South Korea
8.4.6 Southeast Asia
8.4.7 India
8.4.8 Australia
9 Latin America
9.1 Latin America Biometrics Market Size (2017-2028)
9.2 Latin America Biometrics Market Size by Type
9.2.1 Latin America Biometrics Market Size by Type (2017-2022)
9.2.2 Latin America Biometrics Market Size by Type (2023-2028)
9.2.3 Latin America Biometrics Market Share by Type (2017-2028)
9.3 Latin America Biometrics Market Size by Application
9.3.1 Latin America Biometrics Market Size by Application (2017-2022)
9.3.2 Latin America Biometrics Market Size by Application (2023-2028)
9.3.3 Latin America Biometrics Market Share by Application (2017-2028)
9.4 Latin America Biometrics Market Size by Country
9.4.1 Latin America Biometrics Market Size by Country (2017-2022)
9.4.2 Latin America Biometrics Market Size by Country (2023-2028)
9.4.3 Mexico
9.4.4 Brazil
10 Middle East & Africa
10.1 Middle East & Africa Biometrics Market Size (2017-2028)
10.2 Middle East & Africa Biometrics Market Size by Type
10.2.1 Middle East & Africa Biometrics Market Size by Type (2017-2022)
10.2.2 Middle East & Africa Biometrics Market Size by Type (2023-2028)
10.2.3 Middle East & Africa Biometrics Market Share by Type (2017-2028)
10.3 Middle East & Africa Biometrics Market Size by Application
10.3.1 Middle East & Africa Biometrics Market Size by Application (2017-2022)
10.3.2 Middle East & Africa Biometrics Market Size by Application (2023-2028)
10.3.3 Middle East & Africa Biometrics Market Share by Application (2017-2028)
10.4 Middle East & Africa Biometrics Market Size by Country
10.4.1 Middle East & Africa Biometrics Market Size by Country (2017-2022)
10.4.2 Middle East & Africa Biometrics Market Size by Country (2023-2028)
10.4.3 Turkey
10.4.4 Saudi Arabia
10.4.5 UAE
11 Key Players Profiles
11.1 3M Cogent, Inc.
11.1.1 3M Cogent, Inc. Company Details
11.1.2 3M Cogent, Inc. Business Overview
11.1.3 3M Cogent, Inc. Biometrics Introduction
11.1.4 3M Cogent, Inc. Revenue in Biometrics Business (2017-2022)
11.1.5 3M Cogent, Inc. Recent Developments
11.2 Crossmatch
11.2.1 Crossmatch Company Details
11.2.2 Crossmatch Business Overview
11.2.3 Crossmatch Biometrics Introduction
11.2.4 Crossmatch Revenue in Biometrics Business (2017-2022)
11.2.5 Crossmatch Recent Developments
11.3 M2SYS Technology
11.3.1 M2SYS Technology Company Details
11.3.2 M2SYS Technology Business Overview
11.3.3 M2SYS Technology Biometrics Introduction
11.3.4 M2SYS Technology Revenue in Biometrics Business (2017-2022)
11.3.5 M2SYS Technology Recent Developments
11.4 NEC Corporation
11.4.1 NEC Corporation Company Details
11.4.2 NEC Corporation Business Overview
11.4.3 NEC Corporation Biometrics Introduction
11.4.4 NEC Corporation Revenue in Biometrics Business (2017-2022)
11.4.5 NEC Corporation Recent Developments
11.5 Safran Identity and Security
11.5.1 Safran Identity and Security Company Details
11.5.2 Safran Identity and Security Business Overview
11.5.3 Safran Identity and Security Biometrics Introduction
11.5.4 Safran Identity and Security Revenue in Biometrics Business (2017-2022)
11.5.5 Safran Identity and Security Recent Developments
11.6 Aware, Inc.
11.6.1 Aware, Inc. Company Details
11.6.2 Aware, Inc. Business Overview
11.6.3 Aware, Inc. Biometrics Introduction
11.6.4 Aware, Inc. Revenue in Biometrics Business (2017-2022)
11.6.5 Aware, Inc. Recent Developments
11.7 BIO-Key International, Inc.
11.7.1 BIO-Key International, Inc. Company Details
11.7.2 BIO-Key International, Inc. Business Overview
11.7.3 BIO-Key International, Inc. Biometrics Introduction
11.7.4 BIO-Key International, Inc. Revenue in Biometrics Business (2017-2022)
11.7.5 BIO-Key International, Inc. Recent Developments
11.8 Fulcrum Biometrics LLC
11.8.1 Fulcrum Biometrics LLC Company Details
11.8.2 Fulcrum Biometrics LLC Business Overview
11.8.3 Fulcrum Biometrics LLC Biometrics Introduction
11.8.4 Fulcrum Biometrics LLC Revenue in Biometrics Business (2017-2022)
11.8.5 Fulcrum Biometrics LLC Recent Developments
11.9 HID Global Corporation
11.9.1 HID Global Corporation Company Details
11.9.2 HID Global Corporation Business Overview
11.9.3 HID Global Corporation Biometrics Introduction
11.9.4 HID Global Corporation Revenue in Biometrics Business (2017-2022)
11.9.5 HID Global Corporation Recent Developments
12 Analyst's Viewpoints/Conclusions
13 Appendix
13.1 Research Methodology
13.1.1 Methodology/Research Approach
13.1.2 Data Source
13.2 Author Details
13.3 Disclaimer
List of Tables
Table 1. Global Biometrics Market Size Growth Rate by Type (US$ Million), 2017 VS 2021 VS 2028
Table 2. Key Players of Fingerprint Recognition
Table 3. Key Players of Facial Recognition
Table 4. Key Players of Iris Recognition
Table 5. Global Biometrics Market Size Growth Rate by Application (US$ Million), 2017 VS 2021 VS 2028
Table 6. Global Biometrics Market Size by Region (US$ Million): 2017 VS 2021 VS 2028
Table 7. Global Biometrics Market Size by Region (2017-2022) & (US$ Million)
Table 8. Global Biometrics Market Share by Region (2017-2022)
Table 9. Global Biometrics Forecasted Market Size by Region (2023-2028) & (US$ Million)
Table 10. Global Biometrics Market Share by Region (2023-2028)
Table 11. Biometrics Market Trends
Table 12. Biometrics Market Drivers
Table 13. Biometrics Market Challenges
Table 14. Biometrics Market Restraints
Table 15. Global Biometrics Revenue by Players (2017-2022) & (US$ Million)
Table 16. Global Biometrics Revenue Share by Players (2017-2022)
Table 17. Global Top Biometrics by Company Type (Tier 1, Tier 2, and Tier 3) & (based on the Revenue in Biometrics as of 2021)
Table 18. Ranking of Global Top Biometrics Companies by Revenue (US$ Million) in 2021
Table 19. Global 5 Largest Players Market Share by Biometrics Revenue (CR5 and HHI) & (2017-2022)
Table 20. Key Players Headquarters and Area Served
Table 21. Key Players Biometrics Product Solution and Service
Table 22. Date of Enter into Biometrics Market
Table 23. Mergers & Acquisitions, Expansion Plans
Table 24. Global Biometrics Market Size by Type (2017-2022) & (US$ Million)
Table 25. Global Biometrics Revenue Market Share by Type (2017-2022)
Table 26. Global Biometrics Forecasted Market Size by Type (2023-2028) & (US$ Million)
Table 27. Global Biometrics Revenue Market Share by Type (2023-2028)
Table 28. Global Biometrics Market Size by Application (2017-2022) & (US$ Million)
Table 29. Global Biometrics Revenue Share by Application (2017-2022)
Table 30. Global Biometrics Forecasted Market Size by Application (2023-2028) & (US$ Million)
Table 31. Global Biometrics Revenue Share by Application (2023-2028)
Table 32. North America Biometrics Market Size by Type (2017-2022) & (US$ Million)
Table 33. North America Biometrics Market Size by Type (2023-2028) & (US$ Million)
Table 34. North America Biometrics Market Size by Application (2017-2022) & (US$ Million)
Table 35. North America Biometrics Market Size by Application (2023-2028) & (US$ Million)
Table 36. North America Biometrics Market Size by Country (2017-2022) & (US$ Million)
Table 37. North America Biometrics Market Size by Country (2023-2028) & (US$ Million)
Table 38. Europe Biometrics Market Size by Type (2017-2022) & (US$ Million)
Table 39. Europe Biometrics Market Size by Type (2023-2028) & (US$ Million)
Table 40. Europe Biometrics Market Size by Application (2017-2022) & (US$ Million)
Table 41. Europe Biometrics Market Size by Application (2023-2028) & (US$ Million)
Table 42. Europe Biometrics Market Size by Country (2017-2022) & (US$ Million)
Table 43. Europe Biometrics Market Size by Country (2023-2028) & (US$ Million)
Table 44. Asia Pacific Biometrics Market Size by Type (2017-2022) & (US$ Million)
Table 45. Asia Pacific Biometrics Market Size by Type (2023-2028) & (US$ Million)
Table 46. Asia Pacific Biometrics Market Size by Application (2017-2022) & (US$ Million)
Table 47. Asia Pacific Biometrics Market Size by Application (2023-2028) & (US$ Million)
Table 48. Asia Pacific Biometrics Market Size by Region (2017-2022) & (US$ Million)
Table 49. Asia Pacific Biometrics Market Size by Region (2023-2028) & (US$ Million)
Table 50. Latin America Biometrics Market Size by Type (2017-2022) & (US$ Million)
Table 51. Latin America Biometrics Market Size by Type (2023-2028) & (US$ Million)
Table 52. Latin America Biometrics Market Size by Application (2017-2022) & (US$ Million)
Table 53. Latin America Biometrics Market Size by Application (2023-2028) & (US$ Million)
Table 54. Latin America Biometrics Market Size by Country (2017-2022) & (US$ Million)
Table 55. Latin America Biometrics Market Size by Country (2023-2028) & (US$ Million)
Table 56. Middle East and Africa Biometrics Market Size by Type (2017-2022) & (US$ Million)
Table 57. Middle East and Africa Biometrics Market Size by Type (2023-2028) & (US$ Million)
Table 58. Middle East and Africa Biometrics Market Size by Application (2017-2022) & (US$ Million)
Table 59. Middle East and Africa Biometrics Market Size by Application (2023-2028) & (US$ Million)
Table 60. Middle East and Africa Biometrics Market Size by Country (2017-2022) & (US$ Million)
Table 61. Middle East and Africa Biometrics Market Size by Country (2023-2028) & (US$ Million)
Table 62. 3M Cogent, Inc. Company Details
Table 63. 3M Cogent, Inc. Business Overview
Table 64. 3M Cogent, Inc. Biometrics Product
Table 65. 3M Cogent, Inc. Revenue in Biometrics Business (2017-2022) & (US$ Million)
Table 66. 3M Cogent, Inc. Recent Developments
Table 67. Crossmatch Company Details
Table 68. Crossmatch Business Overview
Table 69. Crossmatch Biometrics Product
Table 70. Crossmatch Revenue in Biometrics Business (2017-2022) & (US$ Million)
Table 71. Crossmatch Recent Developments
Table 72. M2SYS Technology Company Details
Table 73. M2SYS Technology Business Overview
Table 74. M2SYS Technology Biometrics Product
Table 75. M2SYS Technology Revenue in Biometrics Business (2017-2022) & (US$ Million)
Table 76. M2SYS Technology Recent Developments
Table 77. NEC Corporation Company Details
Table 78. NEC Corporation Business Overview
Table 79. NEC Corporation Biometrics Product
Table 80. NEC Corporation Revenue in Biometrics Business (2017-2022) & (US$ Million)
Table 81. NEC Corporation Recent Developments
Table 82. Safran Identity and Security Company Details
Table 83. Safran Identity and Security Business Overview
Table 84. Safran Identity and Security Biometrics Product
Table 85. Safran Identity and Security Revenue in Biometrics Business (2017-2022) & (US$ Million)
Table 86. Safran Identity and Security Recent Developments
Table 87. Aware, Inc. Company Details
Table 88. Aware, Inc. Business Overview
Table 89. Aware, Inc. Biometrics Product
Table 90. Aware, Inc. Revenue in Biometrics Business (2017-2022) & (US$ Million)
Table 91. Aware, Inc. Recent Developments
Table 92. BIO-Key International, Inc. Company Details
Table 93. BIO-Key International, Inc. Business Overview
Table 94. BIO-Key International, Inc. Biometrics Product
Table 95. BIO-Key International, Inc. Revenue in Biometrics Business (2017-2022) & (US$ Million)
Table 96. BIO-Key International, Inc. Recent Developments
Table 97. Fulcrum Biometrics LLC Company Details
Table 98. Fulcrum Biometrics LLC Business Overview
Table 99. Fulcrum Biometrics LLC Biometrics Product
Table 100. Fulcrum Biometrics LLC Revenue in Biometrics Business (2017-2022) & (US$ Million)
Table 101. Fulcrum Biometrics LLC Recent Developments
Table 102. HID Global Corporation Company Details
Table 103. HID Global Corporation Business Overview
Table 104. HID Global Corporation Biometrics Product
Table 105. HID Global Corporation Revenue in Biometrics Business (2017-2022) & (US$ Million)
Table 106. HID Global Corporation Recent Developments
Table 107. Research Programs/Design for This Report
Table 108. Key Data Information from Secondary Sources
Table 109. Key Data Information from Primary Sources
List of Figures
Figure 1. Global Biometrics Market Share by Type: 2021 VS 2028
Figure 2. Fingerprint Recognition Features
Figure 3. Facial Recognition Features
Figure 4. Iris Recognition Features
Figure 5. Global Biometrics Market Share by Application: 2021 VS 2028
Figure 6. Military Case Studies
Figure 7. Civil Case Studies
Figure 8. Biometrics Report Years Considered
Figure 9. Global Biometrics Market Size (US$ Million), Year-over-Year: 2017-2028
Figure 10. Global Biometrics Market Size, (US$ Million), 2017 VS 2021 VS 2028
Figure 11. Global Biometrics Market Share by Region: 2021 VS 2028
Figure 12. Global Biometrics Market Share by Players in 2021
Figure 13. Global Top Biometrics Players by Company Type (Tier 1, Tier 2, and Tier 3) & (based on the Revenue in Biometrics as of 2021)
Figure 14. The Top 10 and 5 Players Market Share by Biometrics Revenue in 2021
Figure 15. North America Biometrics Market Size YoY (2017-2028) & (US$ Million)
Figure 16. North America Biometrics Market Size Market Share by Type (2017-2028)
Figure 17. North America Biometrics Market Size Market Share by Application (2017-2028)
Figure 18. North America Biometrics Market Size Share by Country (2017-2028)
Figure 19. United States Biometrics Market Size YoY Growth (2017-2028) & (US$ Million)
Figure 20. Canada Biometrics Market Size YoY Growth (2017-2028) & (US$ Million)
Figure 21. Europe Biometrics Market Size YoY (2017-2028) & (US$ Million)
Figure 22. Europe Biometrics Market Size Market Share by Type (2017-2028)
Figure 23. Europe Biometrics Market Size Market Share by Application (2017-2028)
Figure 24. Europe Biometrics Market Size Share by Country (2017-2028)
Figure 25. Germany Biometrics Market Size YoY Growth (2017-2028) & (US$ Million)
Figure 26. France Biometrics Market Size YoY Growth (2017-2028) & (US$ Million)
Figure 27. U.K. Biometrics Market Size YoY Growth (2017-2028) & (US$ Million)
Figure 28. Italy Biometrics Market Size YoY Growth (2017-2028) & (US$ Million)
Figure 29. Russia Biometrics Market Size YoY Growth (2017-2028) & (US$ Million)
Figure 30. Nordic Countries Biometrics Market Size YoY Growth (2017-2028) & (US$ Million)
Figure 31. Asia-Pacific Biometrics Market Size YoY (2017-2028) & (US$ Million)
Figure 32. Asia Pacific Biometrics Market Size Market Share by Type (2017-2028)
Figure 33. Asia Pacific Biometrics Market Size Market Share by Application (2017-2028)
Figure 34. Asia Pacific Biometrics Market Size Share by Region (2017-2028)
Figure 35. China Biometrics Market Size YoY Growth (2017-2028) & (US$ Million)
Figure 36. Japan Biometrics Market Size YoY Growth (2017-2028) & (US$ Million)
Figure 37. South Korea Biometrics Market Size YoY Growth (2017-2028) & (US$ Million)
Figure 38. Southeast Asia Biometrics Market Size YoY Growth (2017-2028) & (US$ Million)
Figure 39. India Biometrics Market Size YoY Growth (2017-2028) & (US$ Million)
Figure 40. Australia Biometrics Market Size YoY Growth (2017-2028) & (US$ Million)
List of Figures
Figure 41. Latin America Biometrics Market Size YoY (2017-2028) & (US$ Million)
Figure 42. Latin America Biometrics Market Size Market Share by Type (2017-2028)
Figure 43. Latin America Biometrics Market Size Market Share by Application (2017-2028)
Figure 44. Latin America Biometrics Market Size Share by Country (2017-2028)
Figure 45. Mexico Biometrics Market Size YoY Growth (2017-2028) & (US$ Million)
Figure 46. Brazil Biometrics Market Size YoY Growth (2017-2028) & (US$ Million)
Figure 47. Middle East & Africa Biometrics Market Size YoY (2017-2028) & (US$ Million)
Figure 48. Middle East and Africa Biometrics Market Size Market Share by Type (2017-2028)
Figure 49. Middle East and Africa Biometrics Market Size Market Share by Application (2017-2028)
Figure 50. Middle East and Africa Biometrics Market Size Share by Country (2017-2028)
Figure 51. Turkey Biometrics Market Size YoY Growth (2017-2028) & (US$ Million)
Figure 52. Saudi Arabia Biometrics Market Size YoY Growth (2017-2028) & (US$ Million)
Figure 53. UAE Biometrics Market Size YoY Growth (2017-2028) & (US$ Million)
Figure 54. 3M Cogent, Inc. Revenue Growth Rate in Biometrics Business (2017-2022)
Figure 55. Crossmatch Revenue Growth Rate in Biometrics Business (2017-2022)
Figure 56. M2SYS Technology Revenue Growth Rate in Biometrics Business (2017-2022)
Figure 57. NEC Corporation Revenue Growth Rate in Biometrics Business (2017-2022)
Figure 58. Safran Identity and Security Revenue Growth Rate in Biometrics Business (2017-2022)
Figure 59. Aware, Inc. Revenue Growth Rate in Biometrics Business (2017-2022)
Figure 60. BIO-Key International, Inc. Revenue Growth Rate in Biometrics Business (2017-2022)
Figure 61. Fulcrum Biometrics LLC Revenue Growth Rate in Biometrics Business (2017-2022)
Figure 62. HID Global Corporation Revenue Growth Rate in Biometrics Business (2017-2022)
Figure 63. Bottom-up and Top-down Approaches for This Report
Figure 64. Data Triangulation
Figure 65. Key Executives Interviewed
$4900
$7350
$9800
HAVE A QUERY?
OUR CUSTOMER

SIMILAR REPORTS