
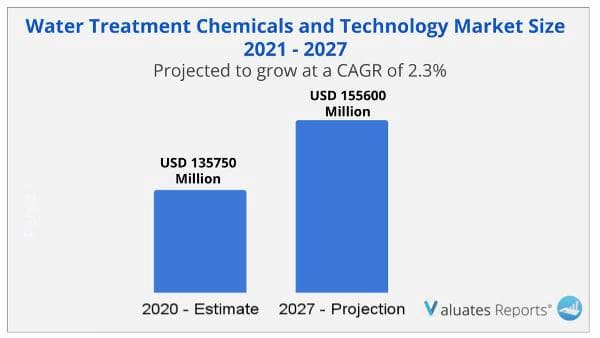
The global Water Treatment Chemicals market size is projected to reach US$ 155600 million by 2027, from US$ 135750 million in 2020, at a CAGR of 2.3% during 2021-2027. Rising demand for chemically treated water from different end-use segments, as well as rigorous regulatory and sustainability standards addressing the environment, are driving the water treatment chemicals market. Water distribution for industrial and domestic usage is problematic since freshwater resources account for only 2.5 percent of total water resources worldwide. The increasing gap between demand and supply demands efficient water recycling, which may be done by using water treatment chemicals. As a result, the market for water treatment chemicals and technologies is projected to increase in tandem with the need for clean water.
The Water Treatment Chemicals market is projected to increase due to rising demand for chemically treated water in different end-use categories. The increasing gap between demand and supply demands efficient water recycling, which may be done by using water treatment chemicals. As a result, wastewater consumption has risen dramatically in a number of end-use sectors, including oil and gas, power generation, mining, chemicals, and others. As a result of increased industrial activity, the demand for fresh and clean water for domestic, agricultural, and industrial purposes has increased dramatically in emerging economies. Consequently, demand for water treatment chemicals is anticipated to expand throughout the forecast period, propelling the Water Treatment Chemicals market forward.
The water treatment chemicals market is anticipated to develop even faster in emerging nations due to rising population and increasing urbanisation. Coagulants are used in water treatment to remove organic trash and microorganisms, as well as inorganics and hazardous substances including arsenic, chemical phosphorous, and fluoride. They're commonly employed as the first step in a pollution-reduction plan for developing countries, especially those with fast increasing metropolitan areas and no centralised wastewater treatment.
The Asia-Pacific area is anticipated to be the most profitable. The region's rising need for water treatment chemicals may be attributed to a variety of factors, including the region's growing population, greater industrial expansion, and tight environmental laws. Furthermore, as the number of end-use industries in the area rises, so does the number of innovations and advances in the field of water treatment chemicals, bolstering the expansion of the APAC water treatment chemicals market.
The industrial industry is projected to be the most profitable in terms of end-user segment. This is because the number of companies that use a lot of water in their production processes is increasing, necessitating the usage of process water treatment.
Coagulants and flocculants are projected to be the most profitable segment by kind. The sector is being driven by the increasing usage of these chemicals in municipal and wastewater treatment in different industries such as power, oil and gas, chemical, and petrochemical. Coagulants are used to reduce colour and turbidity from untreated, raw water. They are positively charged molecules that counteract the negative charges of particles. Organic and inorganic coagulants are the two kinds of coagulants.
The report provides a list of all the key players in the Water Treatment Chemicals and Technology market along with a detailed analysis of the strategies, which the companies are adopting. The strategies mainly include new product Developments, research, and Developments, and also provides revenue shares, company overview, and recent company Developments to remain competitive in the market.
|
Report Metric |
Details |
|
Report Name |
Water Treatment Chemicals and Technology Market |
|
The Market size value in 2020 |
135750 Million USD |
|
The Revenue forecast in 2027 |
155600 Million USD |
|
Growth Rate |
CAGR of 2.3% from 2021 to 2027 |
|
Base year considered |
2020 |
|
Forecast period |
2021-2027 |
|
Forecast units |
Value (USD) |
|
Segments covered |
Type, End-User, Offerings, and Region |
|
Report coverage |
Revenue & volume forecast, company share, competitive landscape, growth factors, and trends |
|
Geographic regions covered |
North America, Europe, Asia Pacific, Latin America, Middle East &Africa |
|
Companies covered |
3M, GE Water and Process Technologies, Honeywell International, Solvay, The Dow Chemical, ITT, Buckman Laboratories International, Pentair, BWA Water Additives, Calgon Carbon, Albemarle, Danaher, Flowserve, Best Water Technology. |
Ans. The global Water Treatment Chemicals and Technology market size is projected to reach US$ 155600 million by 2027, from US$ 135750 million in 2020.
Ans. The global Water Treatment Chemicals and Technology market is expected to grow at a compound annual growth rate of 2.3% from 2021 to 2027.
Ans. 3M, GE Water and Process Technologies, Honeywell International, Solvay, The Dow Chemical, ITT, Buckman Laboratories International, Pentair, BWA Water Additives, Calgon Carbon, Albemarle, Danaher, Flowserve, Best Water Technology.
Table of Contents
1 Water Treatment Chemicals and Technology Market Overview
1.1 Water Treatment Chemicals and Technology Product Overview
1.2 Water Treatment Chemicals and Technology Market Segment by Type
1.2.1 Coagulants and Flocculants
1.2.2 Corrosion and Scale Inhibitors
1.2.3 Anti-Foamants and Defoamers
1.2.4 Biocides
1.2.5 Activated Carbon
1.2.6 Others
1.3 Global Water Treatment Chemicals and Technology Market Size by Type
1.3.1 Global Water Treatment Chemicals and Technology Market Size Overview by Type (2016-2027)
1.3.2 Global Water Treatment Chemicals and Technology Historic Market Size Review by Type (2016-2021)
1.3.2.1 Global Water Treatment Chemicals and Technology Sales Breakdown in Volume by Type (2016-2021)
1.3.2.2 Global Water Treatment Chemicals and Technology Sales Breakdown in Value by Type (2016-2021)
1.3.2.3 Global Water Treatment Chemicals and Technology Average Selling Price (ASP) by Type (2016-2021)
1.3.3 Global Water Treatment Chemicals and Technology Forecasted Market Size by Type (2022-2027)
1.3.3.1 Global Water Treatment Chemicals and Technology Sales Breakdown in Volume by Type (2022-2027)
1.3.3.2 Global Water Treatment Chemicals and Technology Sales Breakdown in Value by Type (2022-2027)
1.3.3.3 Global Water Treatment Chemicals and Technology Average Selling Price (ASP) by Type (2022-2027)
1.4 Key Regions Market Size Segment by Type
1.4.1 North America Water Treatment Chemicals and Technology Sales Breakdown by Type (2016-2021)
1.4.2 Europe Water Treatment Chemicals and Technology Sales Breakdown by Type (2016-2021)
1.4.3 Asia-Pacific Water Treatment Chemicals and Technology Sales Breakdown by Type (2016-2021)
1.4.4 Latin America Water Treatment Chemicals and Technology Sales Breakdown by Type (2016-2021)
1.4.5 Middle East and Africa Water Treatment Chemicals and Technology Sales Breakdown by Type (2016-2021)
2 Global Water Treatment Chemicals and Technology Market Competition by Company
2.1 Global Top Players by Water Treatment Chemicals and Technology Sales (2016-2021)
2.2 Global Top Players by Water Treatment Chemicals and Technology Revenue (2016-2021)
2.3 Global Top Players Water Treatment Chemicals and Technology Price (2016-2021)
2.4 Global Top Manufacturers Water Treatment Chemicals and Technology Manufacturing Base Distribution, Sales Area, Product Type
2.5 Water Treatment Chemicals and Technology Market Competitive Situation and Trends
2.5.1 Water Treatment Chemicals and Technology Market Concentration Rate (2016-2021)
2.5.2 Global 5 and 10 Largest Manufacturers by Water Treatment Chemicals and Technology Sales and Revenue in 2020
2.6 Global Top Manufacturers by Company Type (Tier 1, Tier 2 and Tier 3) & (based on the Revenue in Water Treatment Chemicals and Technology as of 2020)
2.7 Date of Key Manufacturers Enter into Water Treatment Chemicals and Technology Market
2.8 Key Manufacturers Water Treatment Chemicals and Technology Product Offered
2.9 Mergers & Acquisitions, Expansion
3 Water Treatment Chemicals and Technology Status and Outlook by Region
3.1 Global Water Treatment Chemicals and Technology Market Size and CAGR by Region: 2016 VS 2021 VS 2026
3.2 Global Water Treatment Chemicals and Technology Historic Market Size by Region
3.2.1 Global Water Treatment Chemicals and Technology Sales in Volume by Region (2016-2021)
3.2.2 Global Water Treatment Chemicals and Technology Sales in Value by Region (2016-2021)
3.2.3 Global Water Treatment Chemicals and Technology Sales (Volume & Value) Price and Gross Margin (2016-2021)
3.3 Global Water Treatment Chemicals and Technology Forecasted Market Size by Region
3.3.1 Global Water Treatment Chemicals and Technology Sales in Volume by Region (2022-2027)
3.3.2 Global Water Treatment Chemicals and Technology Sales in Value by Region (2022-2027)
3.3.3 Global Water Treatment Chemicals and Technology Sales (Volume & Value), Price and Gross Margin (2022-2027)
4 Global Water Treatment Chemicals and Technology by Application
4.1 Water Treatment Chemicals and Technology Market Segment by Application
4.1.1 Municipal
4.1.2 Power
4.1.3 Chemical
4.1.4 Food and Beverage
4.1.5 Pulp and Paper
4.1.6 Others
4.2 Global Water Treatment Chemicals and Technology Market Size by Application
4.2.1 Global Water Treatment Chemicals and Technology Market Size Overview by Application (2016-2027)
4.2.2 Global Water Treatment Chemicals and Technology Historic Market Size Review by Application (2016-2021)
4.2.2.1 Global Water Treatment Chemicals and Technology Sales Breakdown in Volume, by Application (2016-2021)
4.2.2.2 Global Water Treatment Chemicals and Technology Sales Breakdown in Value, by Application (2016-2021)
4.2.2.3 Global Water Treatment Chemicals and Technology Average Selling Price (ASP) by Application (2016-2021)
4.2.3 Global Water Treatment Chemicals and Technology Forecasted Market Size by Application (2022-2027)
4.2.3.1 Global Water Treatment Chemicals and Technology Sales Breakdown in Volume, by Application (2022-2027)
4.2.3.2 Global Water Treatment Chemicals and Technology Sales Breakdown in Value, by Application (2022-2027)
4.2.3.3 Global Water Treatment Chemicals and Technology Average Selling Price (ASP) by Application (2022-2027)
4.3 Key Regions Market Size Segment by Application
4.3.1 North America Water Treatment Chemicals and Technology Sales Breakdown by Application (2016-2021)
4.3.2 Europe Water Treatment Chemicals and Technology Sales Breakdown by Application (2016-2021)
4.3.3 Asia-Pacific Water Treatment Chemicals and Technology Sales Breakdown by Application (2016-2021)
4.3.4 Latin America Water Treatment Chemicals and Technology Sales Breakdown by Application (2016-2021)
4.3.5 Middle East and Africa Water Treatment Chemicals and Technology Sales Breakdown by Application (2016-2021)
5 North America Water Treatment Chemicals and Technology by Country
5.1 North America Water Treatment Chemicals and Technology Historic Market Size by Country
5.1.1 North America Water Treatment Chemicals and Technology Sales in Volume by Country (2016-2021)
5.1.2 North America Water Treatment Chemicals and Technology Sales in Value by Country (2016-2021)
5.2 North America Water Treatment Chemicals and Technology Forecasted Market Size by Country
5.2.1 North America Water Treatment Chemicals and Technology Sales in Volume by Country (2022-2027)
5.2.2 North America Water Treatment Chemicals and Technology Sales in Value by Country (2022-2027)
6 Europe Water Treatment Chemicals and Technology by Country
6.1 Europe Water Treatment Chemicals and Technology Historic Market Size by Country
6.1.1 Europe Water Treatment Chemicals and Technology Sales in Volume by Country (2016-2021)
6.1.2 Europe Water Treatment Chemicals and Technology Sales in Value by Country (2016-2021)
6.2 Europe Water Treatment Chemicals and Technology Forecasted Market Size by Country
6.2.1 Europe Water Treatment Chemicals and Technology Sales in Volume by Country (2022-2027)
6.2.2 Europe Water Treatment Chemicals and Technology Sales in Value by Country (2022-2027)
7 Asia-Pacific Water Treatment Chemicals and Technology by Region
7.1 Asia-Pacific Water Treatment Chemicals and Technology Historic Market Size by Region
7.1.1 Asia-Pacific Water Treatment Chemicals and Technology Sales in Volume by Region (2016-2021)
7.1.2 Asia-Pacific Water Treatment Chemicals and Technology Sales in Value by Region (2016-2021)
7.2 Asia-Pacific Water Treatment Chemicals and Technology Forecasted Market Size by Region
7.2.1 Asia-Pacific Water Treatment Chemicals and Technology Sales in Volume by Region (2022-2027)
7.2.2 Asia-Pacific Water Treatment Chemicals and Technology Sales in Value by Region (2022-2027)
8 Latin America Water Treatment Chemicals and Technology by Country
8.1 Latin America Water Treatment Chemicals and Technology Historic Market Size by Country
8.1.1 Latin America Water Treatment Chemicals and Technology Sales in Volume by Country (2016-2021)
8.1.2 Latin America Water Treatment Chemicals and Technology Sales in Value by Country (2016-2021)
8.2 Latin America Water Treatment Chemicals and Technology Forecasted Market Size by Country
8.2.1 Latin America Water Treatment Chemicals and Technology Sales in Volume by Country (2022-2027)
8.2.2 Latin America Water Treatment Chemicals and Technology Sales in Value by Country (2022-2027)
9 Middle East and Africa Water Treatment Chemicals and Technology by Country
9.1 Middle East and Africa Water Treatment Chemicals and Technology Historic Market Size by Country
9.1.1 Middle East and Africa Water Treatment Chemicals and Technology Sales in Volume by Country (2016-2021)
9.1.2 Middle East and Africa Water Treatment Chemicals and Technology Sales in Value by Country (2016-2021)
9.2 Middle East and Africa Water Treatment Chemicals and Technology Forecasted Market Size by Country
9.2.1 Middle East and Africa Water Treatment Chemicals and Technology Sales in Volume by Country (2022-2027)
9.2.2 Middle East and Africa Water Treatment Chemicals and Technology Sales in Value by Country (2022-2027)
10 Company Profiles and Key Figures in Water Treatment Chemicals and Technology Business
10.1 3M
10.1.1 3M Corporation Information
10.1.2 3M Introduction and Business Overview
10.1.3 3M Water Treatment Chemicals and Technology Sales, Revenue and Gross Margin (2016-2021)
10.1.4 3M Water Treatment Chemicals and Technology Products Offered
10.1.5 3M Recent Development
10.2 GE Water and Process Technologies
10.2.1 GE Water and Process Technologies Corporation Information
10.2.2 GE Water and Process Technologies Introduction and Business Overview
10.2.3 GE Water and Process Technologies Water Treatment Chemicals and Technology Sales, Revenue and Gross Margin (2016-2021)
10.2.4 3M Water Treatment Chemicals and Technology Products Offered
10.2.5 GE Water and Process Technologies Recent Development
10.3 Honeywell International
10.3.1 Honeywell International Corporation Information
10.3.2 Honeywell International Introduction and Business Overview
10.3.3 Honeywell International Water Treatment Chemicals and Technology Sales, Revenue and Gross Margin (2016-2021)
10.3.4 Honeywell International Water Treatment Chemicals and Technology Products Offered
10.3.5 Honeywell International Recent Development
10.4 Solvay
10.4.1 Solvay Corporation Information
10.4.2 Solvay Introduction and Business Overview
10.4.3 Solvay Water Treatment Chemicals and Technology Sales, Revenue and Gross Margin (2016-2021)
10.4.4 Solvay Water Treatment Chemicals and Technology Products Offered
10.4.5 Solvay Recent Development
10.5 The Dow Chemical
10.5.1 The Dow Chemical Corporation Information
10.5.2 The Dow Chemical Introduction and Business Overview
10.5.3 The Dow Chemical Water Treatment Chemicals and Technology Sales, Revenue and Gross Margin (2016-2021)
10.5.4 The Dow Chemical Water Treatment Chemicals and Technology Products Offered
10.5.5 The Dow Chemical Recent Development
10.6 ITT
10.6.1 ITT Corporation Information
10.6.2 ITT Introduction and Business Overview
10.6.3 ITT Water Treatment Chemicals and Technology Sales, Revenue and Gross Margin (2016-2021)
10.6.4 ITT Water Treatment Chemicals and Technology Products Offered
10.6.5 ITT Recent Development
10.7 Buckman Laboratories International
10.7.1 Buckman Laboratories International Corporation Information
10.7.2 Buckman Laboratories International Introduction and Business Overview
10.7.3 Buckman Laboratories International Water Treatment Chemicals and Technology Sales, Revenue and Gross Margin (2016-2021)
10.7.4 Buckman Laboratories International Water Treatment Chemicals and Technology Products Offered
10.7.5 Buckman Laboratories International Recent Development
10.8 Pentair
10.8.1 Pentair Corporation Information
10.8.2 Pentair Introduction and Business Overview
10.8.3 Pentair Water Treatment Chemicals and Technology Sales, Revenue and Gross Margin (2016-2021)
10.8.4 Pentair Water Treatment Chemicals and Technology Products Offered
10.8.5 Pentair Recent Development
10.9 BWA Water Additives
10.9.1 BWA Water Additives Corporation Information
10.9.2 BWA Water Additives Introduction and Business Overview
10.9.3 BWA Water Additives Water Treatment Chemicals and Technology Sales, Revenue and Gross Margin (2016-2021)
10.9.4 BWA Water Additives Water Treatment Chemicals and Technology Products Offered
10.9.5 BWA Water Additives Recent Development
10.10 Calgon Carbon
10.10.1 Company Basic Information, Manufacturing Base and Competitors
10.10.2 Water Treatment Chemicals and Technology Product Category, Application and Specification
10.10.3 Calgon Carbon Water Treatment Chemicals and Technology Sales, Revenue, Price and Gross Margin (2016-2021)
10.10.4 Main Business Overview
10.10.5 Calgon Carbon Recent Development
10.11 Albemarle
10.11.1 Albemarle Corporation Information
10.11.2 Albemarle Introduction and Business Overview
10.11.3 Albemarle Water Treatment Chemicals and Technology Sales, Revenue and Gross Margin (2016-2021)
10.11.4 Albemarle Water Treatment Chemicals and Technology Products Offered
10.11.5 Albemarle Recent Development
10.12 Danaher
10.12.1 Danaher Corporation Information
10.12.2 Danaher Introduction and Business Overview
10.12.3 Danaher Water Treatment Chemicals and Technology Sales, Revenue and Gross Margin (2016-2021)
10.12.4 Danaher Water Treatment Chemicals and Technology Products Offered
10.12.5 Danaher Recent Development
10.13 Flowserve
10.13.1 Flowserve Corporation Information
10.13.2 Flowserve Introduction and Business Overview
10.13.3 Flowserve Water Treatment Chemicals and Technology Sales, Revenue and Gross Margin (2016-2021)
10.13.4 Flowserve Water Treatment Chemicals and Technology Products Offered
10.13.5 Flowserve Recent Development
10.14 Best Water Technology
10.14.1 Best Water Technology Corporation Information
10.14.2 Best Water Technology Introduction and Business Overview
10.14.3 Best Water Technology Water Treatment Chemicals and Technology Sales, Revenue and Gross Margin (2016-2021)
10.14.4 Best Water Technology Water Treatment Chemicals and Technology Products Offered
10.14.5 Best Water Technology Recent Development
11 Upstream, Opportunities, Challenges, Risks and Influences Factors Analysis
11.1 Water Treatment Chemicals and Technology Key Raw Materials
11.1.1 Key Raw Materials
11.1.2 Key Raw Materials Price
11.1.3 Raw Materials Key Suppliers
11.2 Manufacturing Cost Structure
11.2.1 Raw Materials
11.2.2 Labor Cost
11.2.3 Manufacturing Expenses
11.3 Water Treatment Chemicals and Technology Industrial Chain Analysis
11.4 Water Treatment Chemicals and Technology Market Dynamics
11.4.1 Industry Trends
11.4.2 Market Drivers
11.4.3 Market Challenges
11.4.4 Market Restraints
12 Market Strategy Analysis, Distributors
12.1 Sales Channel
12.2 Water Treatment Chemicals and Technology Distributors
12.3 Water Treatment Chemicals and Technology Downstream Customers
13 Research Findings and Conclusion
14 Appendix
14.1 Research Methodology
14.1.1 Methodology/Research Approach
14.1.1.1 Research Programs/Design
14.1.1.2 Market Size Estimation
14.1.1.3 Market Breakdown and Data Triangulation
14.1.2 Data Source
14.1.2.1 Secondary Sources
14.1.2.2 Primary Sources
14.2 Author Details
14.3 Disclaimer
List of Tables
Table 1. Major Company of Coagulants and Flocculants
Table 2. Major Company of Corrosion and Scale Inhibitors
Table 3. Major Company of Anti-Foamants and Defoamers
Table 4. Major Company of Biocides
Table 5. Major Company of Activated Carbon
Table 6. Major Company of Others
Table 7. Global Water Treatment Chemicals and Technology Sales by Type 2016 VS 2021 VS 2027 (US$ Million)
Table 8. Global Water Treatment Chemicals and Technology Sales by Type (2016-2021) & (K MT)
Table 9. Global Water Treatment Chemicals and Technology Sales Market Share in Volume by Type (2016-2021)
Table 10. Global Water Treatment Chemicals and Technology Sales by Type (2016-2021) & (US& Million)
Table 11. Global Water Treatment Chemicals and Technology Market Share in Value by Type (2016-2021)
Table 12. Global Water Treatment Chemicals and Technology Price by Type (2016-2021) & (USD/MT)
Table 13. Global Water Treatment Chemicals and Technology Sales by Type (2022-2027) & (K MT)
Table 14. Global Water Treatment Chemicals and Technology Sales Market Share in Volume by Type (2022-2027)
Table 15. Global Water Treatment Chemicals and Technology Sales by Type (2022-2027) & (US$ Million)
Table 16. Global Water Treatment Chemicals and Technology Sales Market Share in Value by Type (2022-2027)
Table 17. Global Water Treatment Chemicals and Technology Price by Type (2022-2027) & (USD/MT)
Table 18. North America Water Treatment Chemicals and Technology Sales by Type (2016-2021) & (K MT)
Table 19. North America Water Treatment Chemicals and Technology Sales by Type (2016-2021) & (US$ Million)
Table 20. Europe Water Treatment Chemicals and Technology Sales (K MT) by Type (2016-2021)
Table 21. Europe Water Treatment Chemicals and Technology Sales by Type (2016-2021) & (US$ Million)
Table 22. Asia-Pacific Water Treatment Chemicals and Technology Sales (K MT) by Type (2016-2021)
Table 23. Asia-Pacific Water Treatment Chemicals and Technology Sales by Type (2016-2021) & (US$ Million)
Table 24. Latin America Water Treatment Chemicals and Technology Sales (K MT) by Type (2016-2021)
Table 25. Latin America Water Treatment Chemicals and Technology Sales by Type (2016-2021) & (US$ Million)
Table 26. Middle East and Africa Water Treatment Chemicals and Technology Sales (K MT) by Type (2016-2021)
Table 27. Middle East and Africa Water Treatment Chemicals and Technology Sales by Type (2016-2021) & (US$ Million)
Table 28. Global Water Treatment Chemicals and Technology Sales by Company (2016-2021) & (K MT)
Table 29. Global Water Treatment Chemicals and Technology Sales Share by Company (2016-2021)
Table 30. Global Water Treatment Chemicals and Technology Revenue by Company (2016-2021) & (US$ Million)
Table 31. Global Water Treatment Chemicals and Technology Revenue Share by Company (2016-2021)
Table 32. Global Market Water Treatment Chemicals and Technology Price by Company (2016-2021) & (USD/MT)
Table 33. Global Water Treatment Chemicals and Technology Top Manufacturers Manufacturing Base Distribution and Sales Area
Table 34. Global Water Treatment Chemicals and Technology Manufacturers Market Concentration Ratio (CR5 and HHI)
Table 35. Global Top Manufacturers Market Share by Company Type (Tier 1, Tier 2 and Tier 3) & (based on the Revenue in Water Treatment Chemicals and Technology as of 2020
Table 36. Date of Key Manufacturers Enter into Water Treatment Chemicals and Technology Market
Table 37. Key Manufacturers Water Treatment Chemicals and Technology Product Type
Table 38. Mergers & Acquisitions, Expansion Plans
Table 39. Global Water Treatment Chemicals and Technology Market Size Comparison by Region (US$ Million): 2016 VS 2021 VS 2027
Table 40. Global Water Treatment Chemicals and Technology Sales by Region (2016-2021) & (K MT)
Table 41. Global Water Treatment Chemicals and Technology Sales Market Share in Volume by Region (2016-2021)
Table 42. Global Water Treatment Chemicals and Technology Sales by Region (2016-2021) & (US$ Million)
Table 43. Global Water Treatment Chemicals and Technology Sales Market Share in Value by Region (2016-2021)
Table 44. Global Water Treatment Chemicals and Technology Sales (K MT), Revenue (US$ Million), Price (USD/MT) and Gross Margin (2016-2021)
Table 45. Global Water Treatment Chemicals and Technology Sales by Region (2022-2027) & (K MT)
Table 46. Global Water Treatment Chemicals and Technology Sales Market Share in Volume by Region (2022-2027)
Table 47. Global Water Treatment Chemicals and Technology Sales by Region (2022-2027) & (US$ Million)
Table 48. Global Water Treatment Chemicals and Technology Sales Market Share in Value by Region (2022-2027)
Table 49. Global Water Treatment Chemicals and Technology Sales (K MT), Revenue (US$ Million), Price (USD/MT) and Gross Margin (2022-2027)
Table 50. Global Water Treatment Chemicals and Technology Sales by Application: 2016 VS 2021 VS 2027 (US$ Million)
Table 51. Global Water Treatment Chemicals and Technology Sales by Application (2016-2021) & (K MT)
Table 52. Global Water Treatment Chemicals and Technology Sales Market Share in Volume by Application (2016-2021)
Table 53. Global Water Treatment Chemicals and Technology Sales by Application (2016-2021) & (US$ Million)
Table 54. Global Water Treatment Chemicals and Technology Sales Market Share in Value by Application (2016-2021)
Table 55. Global Water Treatment Chemicals and Technology Price by Application (2016-2021) & (USD/MT)
Table 56. Global Water Treatment Chemicals and Technology Sales by Application (2022-2027) & (K MT)
Table 57. Global Water Treatment Chemicals and Technology Sales Market Share in Volume by Application (2022-2027)
Table 58. Global Water Treatment Chemicals and Technology Sales by Application (2022-2027) & (US$ Million)
Table 59. Global Water Treatment Chemicals and Technology Sales Market Share in Value by Application (2022-2027)
Table 60. Global Water Treatment Chemicals and Technology Price by Application (2022-2027) & (USD/MT)
Table 61. North America Water Treatment Chemicals and Technology Sales by Application (2016-2021) (K MT)
Table 62. North America Water Treatment Chemicals and Technology Sales by Application (2016-2021) & (US$ Million)
Table 63. North America Water Treatment Chemicals and Technology Sales Market Share in Value by Application in 2020
Table 64. Europe Water Treatment Chemicals and Technology Sales by Application (2016-2021) (K MT)
Table 65. Europe Water Treatment Chemicals and Technology Sales by Application (2016-2021) & (US$ Million)
Table 66. Europe Water Treatment Chemicals and Technology Sales Market Share in Value by Application in 2020
Table 67. Asia-Pacific Water Treatment Chemicals and Technology Sales by Application (2016-2021) (K MT)
Table 68. Asia-Pacific Water Treatment Chemicals and Technology Sales by Application (2016-2021) & (US$ Million)
Table 69. Asia-Pacific Water Treatment Chemicals and Technology Sales Market Share in Value by Application in 2020
Table 70. Latin America Water Treatment Chemicals and Technology Sales by Application (2016-2021) (K MT)
Table 71. Latin America Water Treatment Chemicals and Technology Sales by Application (2016-2021) & (US$ Million)
Table 72. Latin America Water Treatment Chemicals and Technology Sales Market Share in Value by Application in 2020
Table 73. Middle East and Africa Water Treatment Chemicals and Technology Sales by Application (2016-2021) (K MT)
Table 74. Middle East and Africa Water Treatment Chemicals and Technology Sales by Application (2016-2021) & (US$ Million)
Table 75. Middle East and Africa Water Treatment Chemicals and Technology Sales Market Share in Value by Application in 2020
Table 76. North America Water Treatment Chemicals and Technology Sales by Country (2016-2021) & (K MT)
Table 77. North America Water Treatment Chemicals and Technology Sales Market Share in Volume by Country (2016-2021)
Table 78. North America Water Treatment Chemicals and Technology Sales by Country (2016-2021) & (US$ Million)
Table 79. North America Water Treatment Chemicals and Technology Sales Market Share in Value by Country (2016-2021)
Table 80. North America Water Treatment Chemicals and Technology Sales by Country (2022-2027) & (K MT)
Table 81. North America Water Treatment Chemicals and Technology Sales Market Share in Volume by Country (2022-2027)
Table 82. North America Water Treatment Chemicals and Technology Sales by Country (2022-2027) & (US$ Million)
Table 83. North America Water Treatment Chemicals and Technology Sales Market Share in Value by Country (2022-2027)
Table 84. Europe Water Treatment Chemicals and Technology Sales by Country (2016-2021) & (K MT)
Table 85. Europe Water Treatment Chemicals and Technology Sales Market Share in Volume by Country (2016-2021)
Table 86. Europe Water Treatment Chemicals and Technology Sales by Country (2016-2021) & (US$ Million)
Table 87. Europe Water Treatment Chemicals and Technology Sales Market Share in Value by Country (2016-2021)
Table 88. Europe Water Treatment Chemicals and Technology Sales by Country (2022-2027) & (K MT)
Table 89. Europe Water Treatment Chemicals and Technology Sales Market Share in Volume by Country (2022-2027)
Table 90. Europe Water Treatment Chemicals and Technology Sales by Country (2022-2027) & (US$ Million)
Table 91. Europe Water Treatment Chemicals and Technology Sales Market Share in Value by Country (2022-2027)
Table 92. Asia-Pacific Water Treatment Chemicals and Technology Sales by Region (2016-2021) & (K MT)
Table 93. Asia-Pacific Water Treatment Chemicals and Technology Sales Market Share in Volume by Region (2016-2021)
Table 94. Asia-Pacific Water Treatment Chemicals and Technology Sales by Region (2016-2021) & (US$ Million)
Table 95. Asia-Pacific Water Treatment Chemicals and Technology Sales Market Share in Value by Region (2016-2021)
Table 96. Asia-Pacific Water Treatment Chemicals and Technology Sales by Region (2022-2027) & (K MT)
Table 97. Asia-Pacific Water Treatment Chemicals and Technology Sales Market Share in Volume by Region (2022-2027)
Table 98. Asia-Pacific Water Treatment Chemicals and Technology Sales by Region (2022-2027) & (US$ Million)
Table 99. Asia-Pacific Water Treatment Chemicals and Technology Sales Market Share in Value by Region (2022-2027)
Table 100. Latin America Water Treatment Chemicals and Technology Sales by Country (2016-2021) & (K MT)
Table 101. Latin America Water Treatment Chemicals and Technology Sales Market Share in Volume by Country (2016-2021)
Table 102. Latin America Water Treatment Chemicals and Technology Sales by Country (2016-2021) & (US$ Million)
Table 103. Latin America Water Treatment Chemicals and Technology Sales Market Share in Value by Country (2016-2021)
Table 104. Latin America Water Treatment Chemicals and Technology Sales by Country (2022-2027) & (K MT)
Table 105. Latin America Water Treatment Chemicals and Technology Sales Market Share in Volume by Country (2022-2027)
Table 106. Latin America Water Treatment Chemicals and Technology Sales by Country (2022-2027) & (US$ Million)
Table 107. Latin America Water Treatment Chemicals and Technology Sales Market Share in Value by Country (2022-2027)
Table 108. Middle East and Africa Water Treatment Chemicals and Technology Sales by Country (2016-2021) & (K MT)
Table 109. Middle East and Africa Water Treatment Chemicals and Technology Sales Market Share in Volume by Country (2016-2021)
Table 110. Middle East and Africa Water Treatment Chemicals and Technology Sales by Country (2016-2021) & (US$ Million)
Table 111. Middle East and Africa Water Treatment Chemicals and Technology Sales Market Share in Value by Country (2016-2021)
Table 112. Middle East and Africa Water Treatment Chemicals and Technology Sales by Country (2022-2027) & (K MT)
Table 113. Middle East and Africa Water Treatment Chemicals and Technology Sales Market Share in Volume by Country (2022-2027)
Table 114. Middle East and Africa Water Treatment Chemicals and Technology Sales by Country (2022-2027) & (US$ Million)
Table 115. Middle East and Africa Water Treatment Chemicals and Technology Sales Market Share in Value by Country (2022-2027)
Table 116. 3M Corporation Information
Table 117. 3M Introduction and Business Overview
Table 118. 3M Water Treatment Chemicals and Technology Sales (K MT), Revenue (Million USD), Price (USD/MT) and Gross Margin (2016-2021)
Table 119. 3M Water Treatment Chemicals and Technology Product
Table 120. 3M Recent Development
Table 121. GE Water and Process Technologies Corporation Information
Table 122. GE Water and Process Technologies Introduction and Business Overview
Table 123. GE Water and Process Technologies Water Treatment Chemicals and Technology Sales (K MT), Revenue (Million USD), Price (USD/MT) and Gross Margin (2016-2021)
Table 124. GE Water and Process Technologies Water Treatment Chemicals and Technology Product
Table 125. GE Water and Process Technologies Recent Development
Table 126. Honeywell International Corporation Information
Table 127. Honeywell International Introduction and Business Overview
Table 128. Honeywell International Water Treatment Chemicals and Technology Sales (K MT), Revenue (Million USD), Price (USD/MT) and Gross Margin (2016-2021)
Table 129. Honeywell International Water Treatment Chemicals and Technology Product
Table 130. Honeywell International Recent Development
Table 131. Solvay Corporation Information
Table 132. Solvay Introduction and Business Overview
Table 133. Solvay Water Treatment Chemicals and Technology Sales (K MT), Revenue (Million USD), Price (USD/MT) and Gross Margin (2016-2021)
Table 134. Solvay Water Treatment Chemicals and Technology Product
Table 135. Solvay Recent Development
Table 136. The Dow Chemical Corporation Information
Table 137. The Dow Chemical Introduction and Business Overview
Table 138. The Dow Chemical Water Treatment Chemicals and Technology Sales (K MT), Revenue (Million USD), Price (USD/MT) and Gross Margin (2016-2021)
Table 139. The Dow Chemical Water Treatment Chemicals and Technology Product
Table 140. The Dow Chemical Recent Development
Table 141. ITT Corporation Information
Table 142. ITT Introduction and Business Overview
Table 143. ITT Water Treatment Chemicals and Technology Sales (K MT), Revenue (Million USD), Price (USD/MT) and Gross Margin (2016-2021)
Table 144. ITT Water Treatment Chemicals and Technology Product
Table 145. ITT Recent Development
Table 146. Buckman Laboratories International Corporation Information
Table 147. Buckman Laboratories International Introduction and Business Overview
Table 148. Buckman Laboratories International Water Treatment Chemicals and Technology Sales (K MT), Revenue (Million USD), Price (USD/MT) and Gross Margin (2016-2021)
Table 149. Buckman Laboratories International Water Treatment Chemicals and Technology Product
Table 150. Buckman Laboratories International Recent Development
Table 151. Pentair Corporation Information
Table 152. Pentair Introduction and Business Overview
Table 153. Pentair Water Treatment Chemicals and Technology Sales (K MT), Revenue (Million USD), Price (USD/MT) and Gross Margin (2016-2021)
Table 154. Pentair Water Treatment Chemicals and Technology Product
Table 155. Pentair Recent Development
Table 156. BWA Water Additives Corporation Information
Table 157. BWA Water Additives Introduction and Business Overview
Table 158. BWA Water Additives Water Treatment Chemicals and Technology Sales (K MT), Revenue (Million USD), Price (USD/MT) and Gross Margin (2016-2021)
Table 159. BWA Water Additives Water Treatment Chemicals and Technology Product
Table 160. BWA Water Additives Recent Development
Table 161. Calgon Carbon Corporation Information
Table 162. Calgon Carbon Introduction and Business Overview
Table 163. Calgon Carbon Water Treatment Chemicals and Technology Sales (K MT), Revenue (Million USD), Price (USD/MT) and Gross Margin (2016-2021)
Table 164. Calgon Carbon Water Treatment Chemicals and Technology Product
Table 165. Calgon Carbon Recent Development
Table 166. Albemarle Corporation Information
Table 167. Albemarle Introduction and Business Overview
Table 168. Albemarle Water Treatment Chemicals and Technology Sales (K MT), Revenue (Million USD), Price (USD/MT) and Gross Margin (2016-2021)
Table 169. Albemarle Water Treatment Chemicals and Technology Product
Table 170. Albemarle Recent Development
Table 171. Danaher Corporation Information
Table 172. Danaher Introduction and Business Overview
Table 173. Danaher Water Treatment Chemicals and Technology Sales (K MT), Revenue (Million USD), Price (USD/MT) and Gross Margin (2016-2021)
Table 174. Danaher Water Treatment Chemicals and Technology Product
Table 175. Danaher Recent Development
Table 176. Flowserve Corporation Information
Table 177. Flowserve Introduction and Business Overview
Table 178. Flowserve Water Treatment Chemicals and Technology Sales (K MT), Revenue (Million USD), Price (USD/MT) and Gross Margin (2016-2021)
Table 179. Flowserve Water Treatment Chemicals and Technology Product
Table 180. Flowserve Recent Development
Table 181. Best Water Technology Corporation Information
Table 182. Best Water Technology Introduction and Business Overview
Table 183. Best Water Technology Water Treatment Chemicals and Technology Sales (K MT), Revenue (Million USD), Price (USD/MT) and Gross Margin (2016-2021)
Table 184. Best Water Technology Water Treatment Chemicals and Technology Product
Table 185. Best Water Technology Recent Development
Table 186. Key Raw Materials Lists
Table 187. Raw Materials Key Suppliers Lists
Table 188. Water Treatment Chemicals and Technology Market Trends
Table 189. Water Treatment Chemicals and Technology Market Drivers
Table 190. Water Treatment Chemicals and Technology Market Challenges
Table 191. Water Treatment Chemicals and Technology Market Restraints
Table 192. Water Treatment Chemicals and Technology Distributors List
Table 193. Water Treatment Chemicals and Technology Downstream Customers
Table 194. Research Programs/Design for This Report
Table 195. Key Data Information from Secondary Sources
Table 196. Key Data Information from Primary Sources
List of Figures
Figure 1. Water Treatment Chemicals and Technology Product Picture
Figure 2. Global Water Treatment Chemicals and Technology Market Size, 2016 VS 2021 VS 2027 (US$ Million)
Figure 3. Global Water Treatment Chemicals and Technology Market Size Status and Outlook (2016-2027) & (US$ Million)
Figure 4. Global Water Treatment Chemicals and Technology Sales Status and Outlook (2016-2027) & (K MT)
Figure 5. Product Picture of Coagulants and Flocculants
Figure 6. Global Coagulants and Flocculants Sales YoY Growth (2016-2021) & (K MT)
Figure 7. Product Picture of Corrosion and Scale Inhibitors
Figure 8. Global Corrosion and Scale Inhibitors Sales YoY Growth (2016-2021) & (K MT)
Figure 9. Product Picture of Anti-Foamants and Defoamers
Figure 10. Global Anti-Foamants and Defoamers Sales YoY Growth (2016-2021) & (K MT)
Figure 11. Product Picture of Biocides
Figure 12. Global Biocides Sales YoY Growth (2016-2021) & (K MT)
Figure 13. Product Picture of Activated Carbon
Figure 14. Global Activated Carbon Sales YoY Growth (2016-2021) & (K MT)
Figure 15. Product Picture of Others
Figure 16. Global Others Sales YoY Growth (2016-2021) & (K MT)
Figure 17. Global Water Treatment Chemicals and Technology Sales by Type (2016-2027) & (US$ Million)
Figure 18. Global Water Treatment Chemicals and Technology Sales Market Share in Volume by Type (2016-2021)
Figure 19. Global Water Treatment Chemicals and Technology Sales Market Share in Value by Type (2016-2021)
Figure 20. Global Water Treatment Chemicals and Technology Sales Market Share in Volume by Type (2022-2027)
Figure 21. Global Water Treatment Chemicals and Technology Sales Market Share in Value by Type (2022-2027)
Figure 22. North America Water Treatment Chemicals and Technology Sales Market Share in Volume by Type in 2020
Figure 23. North America Water Treatment Chemicals and Technology Sales Market Share in Value by Type in 2020
Figure 24. Europe Water Treatment Chemicals and Technology Sales Market Share in Volume by Type in 2020
Figure 25. Europe Water Treatment Chemicals and Technology Sales Market Share in Value by Type in 2020
Figure 26. Asia-Pacific Water Treatment Chemicals and Technology Sales Market Share in Volume by Type in 2020
Figure 27. Asia-Pacific Water Treatment Chemicals and Technology Sales Market Share in Value by Type in 2020
Figure 28. Latin America Water Treatment Chemicals and Technology Sales Market Share in Volume by Type in 2020
Figure 29. Latin America Water Treatment Chemicals and Technology Sales Market Share in Value by Type in 2020
Figure 30. Middle East and Africa Water Treatment Chemicals and Technology Sales Market Share in Volume by Type in 2020
Figure 31. Middle East and Africa Water Treatment Chemicals and Technology Sales Market Share in Value by Type in 2020
Figure 32. The 5 and 10 Largest Manufacturers in the World: Market Share by Water Treatment Chemicals and Technology Sales in 2020
Figure 33. The 5 and 10 Largest Manufacturers in the World: Market Share by Water Treatment Chemicals and Technology Revenue in 2020
Figure 34. Water Treatment Chemicals and Technology Market Share by Company Type (Tier 1, Tier 2, and Tier 3): 2016 VS 2020
Figure 35. Product Picture of Municipal
Figure 36. Global Municipal Sales YoY Growth (2016-2027) & (K MT)
Figure 37. Product Picture of Power
Figure 38. Global Power Sales YoY Growth (2016-2027) & (K MT)
Figure 39. Product Picture of Chemical
Figure 40. Global Chemical Sales YoY Growth (2016-2027) & (K MT)
Figure 41. Product Picture of Food and Beverage
Figure 42. Global Food and Beverage Sales YoY Growth (2016-2027) & (K MT)
Figure 43. Product Picture of Pulp and Paper
Figure 44. Global Pulp and Paper Sales YoY Growth (2016-2027) & (K MT)
Figure 45. Product Picture of Others
Figure 46. Global Others Sales YoY Growth (2016-2027) & (K MT)
Figure 47. Global Water Treatment Chemicals and Technology Sales by Application (2016-2027) & (US$ Million)
Figure 48. Global Water Treatment Chemicals and Technology Sales Market Share in Volume by Application (2016-2021)
Figure 49. Global Water Treatment Chemicals and Technology Sales Market Share in Value by Application (2016-2021)
Figure 50. Global Water Treatment Chemicals and Technology Sales Market Share in Volume by Application (2022-2027)
Figure 51. North America Water Treatment Chemicals and Technology Sales Market Share in Volume by Application in 2020
Figure 52. Latin America Water Treatment Chemicals and Technology Sales Market Share in Value by Application in 2020
Figure 53. Middle East and Africa Water Treatment Chemicals and Technology Sales Market Share in Value by Application in 2020
Figure 54. Key Raw Materials Price
Figure 55. Water Treatment Chemicals and Technology Manufacturing Cost Structure
Figure 56. Water Treatment Chemicals and Technology Industrial Chain Analysis
Figure 57. Channels of Distribution
Figure 58. Distributors Profiles
Figure 59. Bottom-up and Top-down Approaches for This Report
Figure 60. Data Triangulation
Figure 61. Key Executives Interviewed
$3350
$6700
HAVE A QUERY?
OUR CUSTOMER

SIMILAR REPORTS