
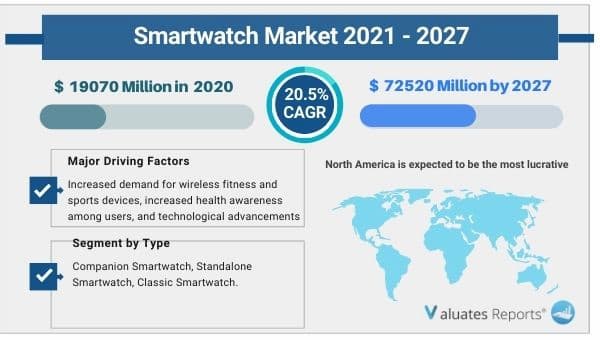
The global Smartwatch market size is projected to reach US$ 72520 million by 2027, from US$ 19070 million in 2020, at a CAGR of 20.5% during 2021-2027. A report titled, “Global Smartwatch Market Outlook 2022” has been recently published The dedicated analysts and researchers have carried out deep-seated research to put forth the present and future scenario of the Smartwatch market. They have provided an in-depth review with accuracy and reliability to give the readers an overall picture.
High-impact rendering factors and drivers have been studied in this report to aid the readers to understand the general development. Moreover, the report includes restraints and challenges that may act as stumbling blocks on the way of the players. This will assist the users to be attentive and make informed decisions related to business. Specialists have also laid their focus on the upcoming business prospects.
The readers in the section will understand how the Smartwatch market scenario changed across the globe during the pandemic and post-pandemic. The study is done keeping in view the changes in aspects such as production, demand, consumption, supply chain. The industry experts have also highlighted the key factors that will help create opportunities for players and stabilize the overall industry in the years to come.
Key segments including type, and application have been elaborated in this report. The consultants have studied every segment and provided the market size using historical data. They have also talked about the growth opportunities that the segment may pose in the future. This study bestows production and revenue data by type, and application during the historical period (2016-2021) and forecast period (2022-2027).
This section of the report provides key insights regarding various regions and the key players operating in each region. Economic, social, environmental, technological, and political factors have been taken into consideration while assessing the growth of the particular region/country. The readers will also get their hands on the revenue and production data of each region and country for the period 2016-2027. This information derived through comprehensive research will help the reader to get familiar with the potential value of the investment in a particular region. North America, Europe, China, Japan and South Korea are the major regions studied in the research report.
In this section, the readers will gain an understanding of the key players competing. The experts have studied the key growth strategies, such as innovative trends and developments, intensification of product portfolio, mergers and acquisitions, collaborations, new product innovation, and geographical expansion, undertaken by these participants to maintain their presence. Apart from business strategies, the study includes current developments and key financials. The readers will also get access to the data related to global revenue, price, and production by manufacturers for the period 2016-2021. This all-inclusive report will certainly serve the clients to stay updated and make effective decisions in their businesses.
|
Report Metric |
Details |
|
Report Name |
Smartwatch Market |
|
The market size in 2020 |
USD 19070 Million |
|
The revenue forecast in 2027 |
USD 72520 Million |
|
Growth Rate |
Compound Annual Growth Rate (CAGR) of 20.5% from 2021 to 2027 |
|
Market size available for years |
2021-2027 |
|
Forecast units |
Value (USD) |
|
Segments covered |
By Type, Application and Region |
|
Report coverage |
Revenue & volume forecast, company share, competitive landscape, growth factors, and trends |
|
Geographic regions covered |
North America, Europe, Asia Pacific, Latin America, Middle East & Africa |
Ans. The global Smartwatch market size is projected to reach US$ 72520 million by 2027, from US$ 19070 million in 2020.
Ans. The global Smartwatch market is expected to grow at a compound annual growth rate of 20.5% from 2021 to 2027.
Ans. Some of the major companies are Apple, Samsung Group, Lenovo Group, Garmin, Fitbit, LG Electronics, Huawei Technologies, Fossil Group.
Table of Contents
1 Smartwatch Market Overview
1.1 Product Overview and Scope of Smartwatch
1.2 Smartwatch Segment by Type
1.2.1 Global Smartwatch Market Size Growth Rate Analysis by Type 2021 VS 2027
1.2.2 Companion Smartwatch
1.2.3 Standalone Smartwatch
1.2.4 Classic Smartwatch
1.3 Smartwatch Segment by Application
1.3.1 Global Smartwatch Consumption Comparison by Application: 2016 VS 2021 VS 2027
1.3.2 Personal Use
1.3.3 Commerical Use
1.4 Global Market Growth Prospects
1.4.1 Global Smartwatch Revenue Estimates and Forecasts (2016-2027)
1.4.2 Global Smartwatch Production Estimates and Forecasts (2016-2027)
1.5 Global Market Size by Region
1.5.1 Global Smartwatch Market Size Estimates and Forecasts by Region: 2016 VS 2021 VS 2027
1.5.2 North America Smartwatch Estimates and Forecasts (2016-2027)
1.5.3 Europe Smartwatch Estimates and Forecasts (2016-2027)
1.5.4 China Smartwatch Estimates and Forecasts (2016-2027)
1.5.5 Japan Smartwatch Estimates and Forecasts (2016-2027)
1.5.6 South Korea Smartwatch Estimates and Forecasts (2016-2027)
2 Market Competition by Manufacturers
2.1 Global Smartwatch Production Market Share by Manufacturers (2016-2021)
2.2 Global Smartwatch Revenue Market Share by Manufacturers (2016-2021)
2.3 Smartwatch Market Share by Company Type (Tier 1, Tier 2 and Tier 3)
2.4 Global Smartwatch Average Price by Manufacturers (2016-2021)
2.5 Manufacturers Smartwatch Production Sites, Area Served, Product Types
2.6 Smartwatch Market Competitive Situation and Trends
2.6.1 Smartwatch Market Concentration Rate
2.6.2 Global 5 and 10 Largest Smartwatch Players Market Share by Revenue
2.6.3 Mergers & Acquisitions, Expansion
3 Production and Capacity by Region
3.1 Global Production of Smartwatch Market Share by Region (2016-2021)
3.2 Global Smartwatch Revenue Market Share by Region (2016-2021)
3.3 Global Smartwatch Production, Revenue, Price and Gross Margin (2016-2021)
3.4 North America Smartwatch Production
3.4.1 North America Smartwatch Production Growth Rate (2016-2021)
3.4.2 North America Smartwatch Production, Revenue, Price and Gross Margin (2016-2021)
3.5 Europe Smartwatch Production
3.5.1 Europe Smartwatch Production Growth Rate (2016-2021)
3.5.2 Europe Smartwatch Production, Revenue, Price and Gross Margin (2016-2021)
3.6 China Smartwatch Production
3.6.1 China Smartwatch Production Growth Rate (2016-2021)
3.6.2 China Smartwatch Production, Revenue, Price and Gross Margin (2016-2021)
3.7 Japan Smartwatch Production
3.7.1 Japan Smartwatch Production Growth Rate (2016-2021)
3.7.2 Japan Smartwatch Production, Revenue, Price and Gross Margin (2016-2021)
3.8 South Korea Smartwatch Production
3.8.1 South Korea Smartwatch Production Growth Rate (2016-2021)
3.8.2 South Korea Smartwatch Production, Revenue, Price and Gross Margin (2016-2021)
4 Global Smartwatch Consumption by Region
4.1 Global Smartwatch Consumption by Region
4.1.1 Global Smartwatch Consumption by Region
4.1.2 Global Smartwatch Consumption Market Share by Region
4.2 North America
4.2.1 North America Smartwatch Consumption by Country
4.2.2 U.S.
4.2.3 Canada
4.3 Europe
4.3.1 Europe Smartwatch Consumption by Country
4.3.2 Germany
4.3.3 France
4.3.4 U.K.
4.3.5 Italy
4.3.6 Russia
4.4 Asia Pacific
4.4.1 Asia Pacific Smartwatch Consumption by Region
4.4.2 China
4.4.3 Japan
4.4.4 South Korea
4.4.5 Taiwan
4.4.6 Southeast Asia
4.4.7 India
4.4.8 Australia
4.5 Latin America
4.5.1 Latin America Smartwatch Consumption by Country
4.5.2 Mexico
4.5.3 Brazil
5 Production, Revenue, Price Trend by Type
5.1 Global Smartwatch Production Market Share by Type (2016-2021)
5.2 Global Smartwatch Revenue Market Share by Type (2016-2021)
5.3 Global Smartwatch Price by Type (2016-2021)
6 Consumption Analysis by Application
6.1 Global Smartwatch Consumption Market Share by Application (2016-2021)
6.2 Global Smartwatch Consumption Growth Rate by Application (2016-2021)
7 Key Companies Profiled
7.1 Apple
7.1.1 Apple Smartwatch Corporation Information
7.1.2 Apple Smartwatch Product Portfolio
7.1.3 Apple Smartwatch Production, Revenue, Price and Gross Margin (2016-2021)
7.1.4 Apple Main Business and Markets Served
7.1.5 Apple Recent Developments/Updates
7.2 Samsung Group
7.2.1 Samsung Group Smartwatch Corporation Information
7.2.2 Samsung Group Smartwatch Product Portfolio
7.2.3 Samsung Group Smartwatch Production, Revenue, Price and Gross Margin (2016-2021)
7.2.4 Samsung Group Main Business and Markets Served
7.2.5 Samsung Group Recent Developments/Updates
7.3 Lenovo Group
7.3.1 Lenovo Group Smartwatch Corporation Information
7.3.2 Lenovo Group Smartwatch Product Portfolio
7.3.3 Lenovo Group Smartwatch Production, Revenue, Price and Gross Margin (2016-2021)
7.3.4 Lenovo Group Main Business and Markets Served
7.3.5 Lenovo Group Recent Developments/Updates
7.4 Garmin
7.4.1 Garmin Smartwatch Corporation Information
7.4.2 Garmin Smartwatch Product Portfolio
7.4.3 Garmin Smartwatch Production, Revenue, Price and Gross Margin (2016-2021)
7.4.4 Garmin Main Business and Markets Served
7.4.5 Garmin Recent Developments/Updates
7.5 Fitbit
7.5.1 Fitbit Smartwatch Corporation Information
7.5.2 Fitbit Smartwatch Product Portfolio
7.5.3 Fitbit Smartwatch Production, Revenue, Price and Gross Margin (2016-2021)
7.5.4 Fitbit Main Business and Markets Served
7.5.5 Fitbit Recent Developments/Updates
7.6 LG Electronics
7.6.1 LG Electronics Smartwatch Corporation Information
7.6.2 LG Electronics Smartwatch Product Portfolio
7.6.3 LG Electronics Smartwatch Production, Revenue, Price and Gross Margin (2016-2021)
7.6.4 LG Electronics Main Business and Markets Served
7.6.5 LG Electronics Recent Developments/Updates
7.7 Huawei Technologies
7.7.1 Huawei Technologies Smartwatch Corporation Information
7.7.2 Huawei Technologies Smartwatch Product Portfolio
7.7.3 Huawei Technologies Smartwatch Production, Revenue, Price and Gross Margin (2016-2021)
7.7.4 Huawei Technologies Main Business and Markets Served
7.7.5 Huawei Technologies Recent Developments/Updates
7.8 Fossil Group
7.8.1 Fossil Group Smartwatch Corporation Information
7.8.2 Fossil Group Smartwatch Product Portfolio
7.8.3 Fossil Group Smartwatch Production, Revenue, Price and Gross Margin (2016-2021)
7.8.4 Fossil Group Main Business and Markets Served
7.7.5 Fossil Group Recent Developments/Updates
8 Smartwatch Manufacturing Cost Analysis
8.1 Smartwatch Key Raw Materials Analysis
8.1.1 Key Raw Materials
8.1.2 Key Raw Materials Price Trend
8.1.3 Key Suppliers of Raw Materials
8.2 Proportion of Manufacturing Cost Structure
8.3 Manufacturing Process Analysis of Smartwatch
8.4 Smartwatch Industrial Chain Analysis
9 Marketing Channel, Distributors and Customers
9.1 Marketing Channel
9.2 Smartwatch Distributors List
9.3 Smartwatch Customers
10 Market Dynamics
10.1 Smartwatch Industry Trends
10.2 Smartwatch Growth Drivers
10.3 Smartwatch Market Challenges
10.4 Smartwatch Market Restraints
11 Production and Supply Forecast
11.1 Global Forecasted Production of Smartwatch by Region (2022-2027)
11.2 North America Smartwatch Production, Revenue Forecast (2022-2027)
11.3 Europe Smartwatch Production, Revenue Forecast (2022-2027)
11.4 China Smartwatch Production, Revenue Forecast (2022-2027)
11.5 Japan Smartwatch Production, Revenue Forecast (2022-2027)
11.6 South Korea Smartwatch Production, Revenue Forecast (2022-2027)
12 Consumption and Demand Forecast
12.1 Global Forecasted Demand Analysis of Smartwatch
12.2 North America Forecasted Consumption of Smartwatch by Country
12.3 Europe Market Forecasted Consumption of Smartwatch by Country
12.4 Asia Pacific Market Forecasted Consumption of Smartwatch by Region
12.5 Latin America Forecasted Consumption of Smartwatch by Country
13 Forecast by Type and by Application (2022-2027)
13.1 Global Production, Revenue and Price Forecast by Type (2022-2027)
13.1.1 Global Forecasted Production of Smartwatch by Type (2022-2027)
13.1.2 Global Forecasted Revenue of Smartwatch by Type (2022-2027)
13.1.3 Global Forecasted Price of Smartwatch by Type (2022-2027)
13.2 Global Forecasted Consumption of Smartwatch by Application (2022-2027)
14 Research Finding and Conclusion
15 Methodology and Data Source
15.1 Methodology/Research Approach
15.1.1 Research Programs/Design
15.1.2 Market Size Estimation
15.1.3 Market Breakdown and Data Triangulation
15.2 Data Source
15.2.1 Secondary Sources
15.2.2 Primary Sources
15.3 Author List
15.4 Disclaimer
List of Tables
Table 1. Global Smartwatch Market Size by Type (K Units) & (US$ Million) (2021 VS 2027)
Table 2. Global Smartwatch Consumption (K Units) Comparison by Application: 2016 VS 2021 VS 2027
Table 3. Smartwatch Market Size Comparison by Region: 2016 VS 2021 VS 2027
Table 4. Global Smartwatch Production (K Units) by Manufacturers
Table 5. Global Smartwatch Production (K Units) by Manufacturers (2016-2021)
Table 6. Global Smartwatch Production Market Share by Manufacturers (2016-2021)
Table 7. Global Smartwatch Revenue (US$ Million) by Manufacturers (2016-2021)
Table 8. Global Smartwatch Revenue Share by Manufacturers (2016-2021)
Table 9. Company Type (Tier 1, Tier 2 and Tier 3) & (based on the Revenue in Smartwatch as of 2020)
Table 10. Global Market Smartwatch Average Price (USD/Unit) of Key Manufacturers (2016-2021)
Table 11. Manufacturers Smartwatch Production Sites and Area Served
Table 12. Manufacturers Smartwatch Product Types
Table 13. Mergers & Acquisitions, Expansion
Table 14. Global Smartwatch Production (K Units) by Region (2016-2021)
Table 15. Global Smartwatch Revenue (US$ Million) by Region (2016-2021)
Table 16. Global Smartwatch Revenue Market Share by Region (2016-2021)
Table 17. Global Smartwatch Production (K Units), Revenue (US$ Million), Price (USD/Unit) and Gross Margin (2016-2021)
Table 18. North America Smartwatch Production (K Units), Revenue (US$ Million), Price (USD/Unit) and Gross Margin (2016-2021)
Table 19. Europe Smartwatch Production (K Units), Revenue (US$ Million), Price (USD/Unit) and Gross Margin (2016-2021)
Table 20. China Smartwatch Production (K Units), Revenue (US$ Million), Price (USD/Unit) and Gross Margin (2016-2021)
Table 21. Japan Smartwatch Production (K Units), Revenue (US$ Million), Price (USD/Unit) and Gross Margin (2016-2021)
Table 22. South Korea Smartwatch Production (K Units), Revenue (US$ Million), Price (USD/Unit) and Gross Margin (2016-2021)
Table 23. Global Smartwatch Consumption Market by Region (2016-2021) & (K Units)
Table 24. Global Smartwatch Consumption Market Share by Region (2016-2021)
Table 25. North America Smartwatch Consumption by Country (2016-2021) & (K Units)
Table 26. Europe Smartwatch Consumption by Country (2016-2021) & (K Units)
Table 27. Asia Pacific Smartwatch Consumption by Region (2016-2021) & (K Units)
Table 28. Latin America Smartwatch Consumption by Countries (2016-2021) & (K Units)
Table 29. Global Smartwatch Production (K Units) by Type (2016-2021)
Table 30. Global Smartwatch Production Market Share by Type (2016-2021)
Table 31. Global Smartwatch Revenue (US$ Million) by Type (2016-2021)
Table 32. Global Smartwatch Revenue Share by Type (2016-2021)
Table 33. Global Smartwatch Price (USD/Unit) by Type (2016-2021)
Table 34. Global Smartwatch Consumption by Application (2016-2021) & (K Units)
Table 35. Global Smartwatch Consumption Market Share by Application (2016-2021)
Table 36. Global Smartwatch Consumption Growth Rate by Application (2016-2021)
Table 37. Apple Smartwatch Corporation Information
Table 38. Apple Specification and Application
Table 39. Apple Smartwatch Production (K Units), Revenue (US$ Million), Price (USD/Unit) and Gross Margin (2016-2021)
Table 40. Apple Main Business and Markets Served
Table 41. Apple Recent Developments/Updates
Table 42. Samsung Group Smartwatch Corporation Information
Table 43. Samsung Group Specification and Application
Table 44. Samsung Group Smartwatch Production (K Units), Revenue (US$ Million), Price (USD/Unit) and Gross Margin (2016-2021)
Table 45. Samsung Group Main Business and Markets Served
Table 46. Samsung Group Recent Developments/Updates
Table 47. Lenovo Group Smartwatch Corporation Information
Table 48. Lenovo Group Specification and Application
Table 49. Lenovo Group Smartwatch Production (K Units), Revenue (US$ Million), Price (USD/Unit) and Gross Margin (2016-2021)
Table 50. Lenovo Group Main Business and Markets Served
Table 51. Lenovo Group Recent Developments/Updates
Table 52. Garmin Smartwatch Corporation Information
Table 53. Garmin Specification and Application
Table 54. Garmin Smartwatch Production (K Units), Revenue (US$ Million), Price (USD/Unit) and Gross Margin (2016-2021)
Table 55. Garmin Main Business and Markets Served
Table 56. Garmin Recent Developments/Updates
Table 57. Fitbit Smartwatch Corporation Information
Table 58. Fitbit Specification and Application
Table 59. Fitbit Smartwatch Production (K Units), Revenue (US$ Million), Price (USD/Unit) and Gross Margin (2016-2021)
Table 60. Fitbit Main Business and Markets Served
Table 61. Fitbit Recent Developments/Updates
Table 62. LG Electronics Smartwatch Corporation Information
Table 63. LG Electronics Specification and Application
Table 64. LG Electronics Smartwatch Production (K Units), Revenue (US$ Million), Price (USD/Unit) and Gross Margin (2016-2021)
Table 65. LG Electronics Main Business and Markets Served
Table 66. LG Electronics Recent Developments/Updates
Table 67. Huawei Technologies Smartwatch Corporation Information
Table 68. Huawei Technologies Specification and Application
Table 69. Huawei Technologies Smartwatch Production (K Units), Revenue (US$ Million), Price (USD/Unit) and Gross Margin (2016-2021)
Table 70. Huawei Technologies Main Business and Markets Served
Table 71. Huawei Technologies Recent Developments/Updates
Table 72. Fossil Group Smartwatch Corporation Information
Table 73. Fossil Group Specification and Application
Table 74. Fossil Group Smartwatch Production (K Units), Revenue (US$ Million), Price (USD/Unit) and Gross Margin (2016-2021)
Table 75. Fossil Group Main Business and Markets Served
Table 76. Fossil Group Recent Developments/Updates
Table 77. Production Base and Market Concentration Rate of Raw Material
Table 78. Key Suppliers of Raw Materials
Table 79. Smartwatch Distributors List
Table 80. Smartwatch Customers List
Table 81. Smartwatch Market Trends
Table 82. Smartwatch Growth Drivers
Table 83. Smartwatch Market Challenges
Table 84. Smartwatch Market Restraints
Table 85. Global Smartwatch Production (K Units) Forecast by Region (2022-2027)
Table 86. North America Smartwatch Consumption Forecast by Country (2022-2027) & (K Units)
Table 87. Europe Smartwatch Consumption Forecast by Country (2022-2027) & (K Units)
Table 88. Asia Pacific Smartwatch Consumption Forecast by Region (2022-2027) & (K Units)
Table 89. Latin America Smartwatch Consumption Forecast by Country (2022-2027) & (K Units)
Table 90. Global Smartwatch Production Forecast by Type (2022-2027) & (K Units)
Table 91. Global Smartwatch Revenue Forecast by Type (2022-2027) & (US$ Million)
Table 92. Global Smartwatch Price Forecast by Type (2022-2027) & (USD/Unit)
Table 93. Global Smartwatch Consumption (K Units) Forecast by Application (2022-2027)
Table 94. Research Programs/Design for This Report
Table 95. Key Data Information from Secondary Sources
Table 96. Key Data Information from Primary Sources
List of Figures
Figure 1. Product Picture of Smartwatch
Figure 2. Global Smartwatch Market Share by Type: 2020 VS 2027
Figure 3. Companion Smartwatch Product Picture
Figure 4. Standalone Smartwatch Product Picture
Figure 5. Classic Smartwatch Product Picture
Figure 6. Global Smartwatch Market Share by Application: 2020 VS 2027
Figure 7. Personal Use
Figure 8. Commerical Use
Figure 9. Global Smartwatch Revenue (US$ Million), 2016 VS 2021 VS 2027
Figure 10. Global Smartwatch Revenue (US$ Million) (2016-2027)
Figure 11. Global Smartwatch Production (K Units) & (2016-2027)
Figure 12. North America Smartwatch Revenue (US$ Million) and Growth Rate (2016-2027)
Figure 13. Europe Smartwatch Revenue (US$ Million) and Growth Rate (2016-2027)
Figure 14. China Smartwatch Revenue (US$ Million) and Growth Rate (2016-2027)
Figure 15. Japan Smartwatch Revenue (US$ Million) and Growth Rate (2016-2027)
Figure 16. South Korea Smartwatch Revenue (US$ Million) and Growth Rate (2016-2027)
Figure 17. Smartwatch Production Share by Manufacturers in 2020
Figure 18. Global Smartwatch Revenue Share by Manufacturers in 2020
Figure 19. Smartwatch Market Share by Company Type (Tier 1, Tier 2 and Tier 3): 2016 VS 2020
Figure 20. Global Market Smartwatch Average Price (USD/Unit) of Key Manufacturers in 2020
Figure 21. The Global 5 and 10 Largest Players: Market Share by Smartwatch Revenue in 2020
Figure 22. Global Smartwatch Production Market Share by Region (2016-2021)
Figure 23. North America Smartwatch Production (K Units) Growth Rate (2016-2021)
Figure 24. Europe Smartwatch Production (K Units) Growth Rate (2016-2021)
Figure 25. China Smartwatch Production (K Units) Growth Rate (2016-2021)
Figure 26. Japan Smartwatch Production (K Units) Growth Rate (2016-2021)
Figure 27. South Korea Smartwatch Production (K Units) Growth Rate (2016-2021)
Figure 28. Global Smartwatch Consumption Market Share by Region (2016-2021)
Figure 29. Global Smartwatch Consumption Market Share by Region in 2020
Figure 30. North America Smartwatch Consumption and Growth Rate (2016-2021) & (K Units)
Figure 31. North America Smartwatch Consumption Market Share by Country in 2020
Figure 32. Canada Smartwatch Consumption Growth Rate (2016-2021) & (K Units)
Figure 33. U.S. Smartwatch Consumption Growth Rate (2016-2021) & (K Units)
Figure 34. Europe Smartwatch Consumption Growth Rate (2016-2021) & (K Units)
Figure 35. Europe Smartwatch Consumption Market Share by Country in 2020
Figure 36. Germany America Smartwatch Consumption and Growth Rate (2016-2021) & (K Units)
Figure 37. France Smartwatch Consumption and Growth Rate (2016-2021) & (K Units)
Figure 38. U.K. Smartwatch Consumption and Growth Rate (2016-2021) & (K Units)
Figure 39. Italy Smartwatch Consumption and Growth Rate (2016-2021) & (K Units)
Figure 40. Russia Smartwatch Consumption and Growth Rate (2016-2021) & (K Units)
Figure 41. Asia Pacific Smartwatch Consumption and Growth Rate (2016-2021) & (K Units)
Figure 42. Asia Pacific Smartwatch Consumption Market Share by Regions in 2020
Figure 43. China Smartwatch Consumption and Growth Rate (2016-2021) & (K Units)
Figure 44. Japan Smartwatch Consumption and Growth Rate (2016-2021) & (K Units)
Figure 45. South Korea Smartwatch Consumption and Growth Rate (2016-2021) & (K Units)
Figure 46. Taiwan Smartwatch Consumption and Growth Rate (2016-2021) & (K Units)
Figure 47. Southeast Asia Smartwatch Consumption and Growth Rate (2016-2021) & (K Units)
Figure 48. India Smartwatch Consumption and Growth Rate (2016-2021) & (K Units)
Figure 49. Australia Smartwatch Consumption and Growth Rate (2016-2021) & (K Units)
Figure 50. Latin America Smartwatch Consumption and Growth Rate (2016-2021) & (K Units)
Figure 51. Latin America Smartwatch Consumption Market Share by Country in 2020
Figure 52. Mexico Smartwatch Consumption and Growth Rate (2016-2021) & (K Units)
Figure 53. Brazil Smartwatch Consumption and Growth Rate (2016-2021) & (K Units)
Figure 54. Production Market Share of Smartwatch by Type (2016-2021)
Figure 55. Production Market Share of Smartwatch by Type in 2020
Figure 56. Revenue Share of Smartwatch by Type (2016-2021)
Figure 57. Revenue Market Share of Smartwatch by Type in 2020
Figure 58. Global Smartwatch Consumption Market Share by Application (2016-2021)
Figure 59. Global Smartwatch Consumption Market Share by Application in 2020
Figure 60. Global Smartwatch Consumption Growth Rate by Application (2016-2021)
Figure 61. Key Raw Materials Price Trend
Figure 62. Manufacturing Cost Structure of Smartwatch
Figure 63. Manufacturing Process Analysis of Smartwatch
Figure 64. Smartwatch Industrial Chain Analysis
Figure 65. Channels of Distribution
Figure 66. Distributors Profiles
Figure 67. Global Smartwatch Production Market Share Forecast by Region (2022-2027)
Figure 68. North America Smartwatch Production (K Units) Growth Rate Forecast (2022-2027)
Figure 69. Europe Smartwatch Production (K Units) Growth Rate Forecast (2022-2027)
Figure 70. China Smartwatch Production (K Units) Growth Rate Forecast (2022-2027)
Figure 71. Japan Smartwatch Production (K Units) Growth Rate Forecast (2022-2027)
Figure 72. South Korea Smartwatch Production (K Units) Growth Rate Forecast (2022-2027)
Figure 73. Global Forecasted Demand Analysis of Smartwatch (2015-2027) & (K Units)
Figure 74. Global Smartwatch Production Market Share Forecast by Type (2022-2027)
Figure 75. Global Smartwatch Revenue Market Share Forecast by Type (2022-2027)
Figure 76. Global Smartwatch Consumption Forecast by Application (2022-2027)
Figure 77. Bottom-up and Top-down Approaches for This Report
Figure 78. Data Triangulation
$2900
$5800
HAVE A QUERY?
OUR CUSTOMER
