
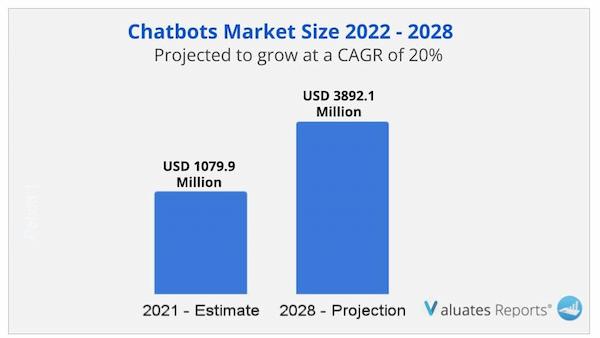
The global Chatbots market size is projected to reach USD 3892.1 Million by 2028, from USD 1079.9 Million in 2021, at a CAGR of 20.0% during 2022-2028.
A chatbot is a computer program or an artificial intelligence which conducts a conversation via auditory or textual methods.
The major drivers for upsurge in demand for chatbot software and services include increasing penetration of websites and mobile applications, proliferating demand of intelligent customer engagement, strong need to understand consumer behavior, and adoption of cloud-based technology
With industry-standard accuracy in analysis and high data integrity, the report makes a brilliant attempt to unveil key opportunities available in the global Chatbots market to help players in achieving a strong market position. Buyers of the report can access verified and reliable market forecasts, including those for the overall size of the global Chatbots market in terms of revenue.
Overall, the report proves to be an effective tool that players can use to gain a competitive edge over their competitors and ensure lasting success in the global Chatbots market. All of the findings, data, and information provided in the report are validated and revalidated with the help of trustworthy sources. The analysts who have authored the report took a unique and industry-best research and analysis approach for an in-depth study of the global Chatbots market.
This section of the report has explored the overall status of the Covid scenario and has offered valuable insights into the changes in supply chain disruption, fluctuations in demand, etc. The analysts have also focused on the key measures that the companies are opting to withstand the harsh scenario.
The report has been segmented into product and application segments. The researchers have documented all the products present today in the Chatbots market. They have also shed light on the new product innovations and launches by the key players. In the segmental analysis, the analysts have provided revenue forecast figures based on type and application for the period 2017-2028. They have also discussed about the growth rate and potential of each segment for the period 2017-2028.
|
Report Metric |
Details |
|
Report Name |
Chatbots Market |
|
Market size value in 2021 |
USD 1079.9 Million |
|
Revenue forecast in 2028 |
USD 3892.1 Million |
|
Growth Rate |
CAGR 20.0% |
|
Base year considered |
2021 |
|
Forecast Period |
2022-2028 |
|
By Type |
Software, Services |
|
By Application |
Websites, Contact Centers, Mobile Platform, Social Media |
Ans. The global Chatbots market size is projected to reach US$ 3892.1 million by 2028, from US$ 1079.9 million in 2021, at a CAGR of 20.0% during 2022-2028.
Ans. Global flow battery main players include Artificial Solutions, IBM Watson, Naunce Communications, eGain Coporation, Creative Virtual, Next IT Corp, CX Company, Speaktoit
Ans. Yes, the report includes a COVID-19 impact analysis. Also, it is further extended into every individual segment of the report.
1.1 Study Scope
1.2 Market Analysis by Type
1.2.1 Global Chatbots Market Size Growth Rate by Type, 2017 VS 2021 VS 2028
1.2.2 Software
1.2.3 Services
1.3 Market by Application
1.3.1 Global Chatbots Market Size Growth Rate by Application, 2017 VS 2021 VS 2028
1.3.2 Websites
1.3.3 Contact Centers
1.3.4 Social Media
1.3.5 Mobile Platform
1.4 Study Objectives
1.5 Years Considered
2 Global Growth Trends
2.1 Global Chatbots Market Perspective (2017-2028)
2.2 Chatbots Growth Trends by Region
2.2.1 Chatbots Market Size by Region: 2017 VS 2021 VS 2028
2.2.2 Chatbots Historic Market Size by Region (2017-2022)
2.2.3 Chatbots Forecasted Market Size by Region (2023-2028)
2.3 Chatbots Market Dynamics
2.3.1 Chatbots Industry Trends
2.3.2 Chatbots Market Drivers
2.3.3 Chatbots Market Challenges
2.3.4 Chatbots Market Restraints
3 Competition Landscape by Key Players
3.1 Global Top Chatbots Players by Revenue
3.1.1 Global Top Chatbots Players by Revenue (2017-2022)
3.1.2 Global Chatbots Revenue Market Share by Players (2017-2022)
3.2 Global Chatbots Market Share by Company Type (Tier 1, Tier 2, and Tier 3)
3.3 Players Covered: Ranking by Chatbots Revenue
3.4 Global Chatbots Market Concentration Ratio
3.4.1 Global Chatbots Market Concentration Ratio (CR5 and HHI)
3.4.2 Global Top 10 and Top 5 Companies by Chatbots Revenue in 2021
3.5 Chatbots Key Players Head office and Area Served
3.6 Key Players Chatbots Product Solution and Service
3.7 Date of Enter into Chatbots Market
3.8 Mergers & Acquisitions, Expansion Plans
4 Chatbots Breakdown Data by Type
4.1 Global Chatbots Historic Market Size by Type (2017-2022)
4.2 Global Chatbots Forecasted Market Size by Type (2023-2028)
5 Chatbots Breakdown Data by Application
5.1 Global Chatbots Historic Market Size by Application (2017-2022)
5.2 Global Chatbots Forecasted Market Size by Application (2023-2028)
6 North America
6.1 North America Chatbots Market Size (2017-2028)
6.2 North America Chatbots Market Size by Type
6.2.1 North America Chatbots Market Size by Type (2017-2022)
6.2.2 North America Chatbots Market Size by Type (2023-2028)
6.2.3 North America Chatbots Market Share by Type (2017-2028)
6.3 North America Chatbots Market Size by Application
6.3.1 North America Chatbots Market Size by Application (2017-2022)
6.3.2 North America Chatbots Market Size by Application (2023-2028)
6.3.3 North America Chatbots Market Share by Application (2017-2028)
6.4 North America Chatbots Market Size by Country
6.4.1 North America Chatbots Market Size by Country (2017-2022)
6.4.2 North America Chatbots Market Size by Country (2023-2028)
6.4.3 U.S.
6.4.4 Canada
7 Europe
7.1 Europe Chatbots Market Size (2017-2028)
7.2 Europe Chatbots Market Size by Type
7.2.1 Europe Chatbots Market Size by Type (2017-2022)
7.2.2 Europe Chatbots Market Size by Type (2023-2028)
7.2.3 Europe Chatbots Market Share by Type (2017-2028)
7.3 Europe Chatbots Market Size by Application
7.3.1 Europe Chatbots Market Size by Application (2017-2022)
7.3.2 Europe Chatbots Market Size by Application (2023-2028)
7.3.3 Europe Chatbots Market Share by Application (2017-2028)
7.4 Europe Chatbots Market Size by Country
7.4.1 Europe Chatbots Market Size by Country (2017-2022)
7.4.2 Europe Chatbots Market Size by Country (2023-2028)
7.4.3 Germany
7.4.4 France
7.4.5 U.K.
7.4.6 Italy
7.4.7 Russia
7.4.8 Nordic Countries
8 Asia-Pacific
8.1 Asia-Pacific Chatbots Market Size (2017-2028)
8.2 Asia-Pacific Chatbots Market Size by Type
8.2.1 Asia-Pacific Chatbots Market Size by Type (2017-2022)
8.2.2 Asia-Pacific Chatbots Market Size by Type (2023-2028)
8.2.3 Asia-Pacific Chatbots Market Share by Type (2017-2028)
8.3 Asia-Pacific Chatbots Market Size by Application
8.3.1 Asia-Pacific Chatbots Market Size by Application (2017-2022)
8.3.2 Asia-Pacific Chatbots Market Size by Application (2023-2028)
8.3.3 Asia-Pacific Chatbots Market Share by Application (2017-2028)
8.4 Asia-Pacific Chatbots Market Size by Region
8.4.1 Asia-Pacific Chatbots Market Size by Region (2017-2022)
8.4.2 Asia-Pacific Chatbots Market Size by Region (2023-2028)
8.4.3 China
8.4.4 Japan
8.4.5 South Korea
8.4.6 Southeast Asia
8.4.7 India
8.4.8 Australia
9 Latin America
9.1 Latin America Chatbots Market Size (2017-2028)
9.2 Latin America Chatbots Market Size by Type
9.2.1 Latin America Chatbots Market Size by Type (2017-2022)
9.2.2 Latin America Chatbots Market Size by Type (2023-2028)
9.2.3 Latin America Chatbots Market Share by Type (2017-2028)
9.3 Latin America Chatbots Market Size by Application
9.3.1 Latin America Chatbots Market Size by Application (2017-2022)
9.3.2 Latin America Chatbots Market Size by Application (2023-2028)
9.3.3 Latin America Chatbots Market Share by Application (2017-2028)
9.4 Latin America Chatbots Market Size by Country
9.4.1 Latin America Chatbots Market Size by Country (2017-2022)
9.4.2 Latin America Chatbots Market Size by Country (2023-2028)
9.4.3 Mexico
9.4.4 Brazil
10 Middle East & Africa
10.1 Middle East & Africa Chatbots Market Size (2017-2028)
10.2 Middle East & Africa Chatbots Market Size by Type
10.2.1 Middle East & Africa Chatbots Market Size by Type (2017-2022)
10.2.2 Middle East & Africa Chatbots Market Size by Type (2023-2028)
10.2.3 Middle East & Africa Chatbots Market Share by Type (2017-2028)
10.3 Middle East & Africa Chatbots Market Size by Application
10.3.1 Middle East & Africa Chatbots Market Size by Application (2017-2022)
10.3.2 Middle East & Africa Chatbots Market Size by Application (2023-2028)
10.3.3 Middle East & Africa Chatbots Market Share by Application (2017-2028)
10.4 Middle East & Africa Chatbots Market Size by Country
10.4.1 Middle East & Africa Chatbots Market Size by Country (2017-2022)
10.4.2 Middle East & Africa Chatbots Market Size by Country (2023-2028)
10.4.3 Turkey
10.4.4 Saudi Arabia
10.4.5 UAE
11 Key Players Profiles
11.1 Artificial Solutions
11.1.1 Artificial Solutions Company Details
11.1.2 Artificial Solutions Business Overview
11.1.3 Artificial Solutions Chatbots Introduction
11.1.4 Artificial Solutions Revenue in Chatbots Business (2017-2022)
11.1.5 Artificial Solutions Recent Developments
11.2 IBM Watson
11.2.1 IBM Watson Company Details
11.2.2 IBM Watson Business Overview
11.2.3 IBM Watson Chatbots Introduction
11.2.4 IBM Watson Revenue in Chatbots Business (2017-2022)
11.2.5 IBM Watson Recent Developments
11.3 Naunce Communications
11.3.1 Naunce Communications Company Details
11.3.2 Naunce Communications Business Overview
11.3.3 Naunce Communications Chatbots Introduction
11.3.4 Naunce Communications Revenue in Chatbots Business (2017-2022)
11.3.5 Naunce Communications Recent Developments
11.4 eGain Coporation
11.4.1 eGain Coporation Company Details
11.4.2 eGain Coporation Business Overview
11.4.3 eGain Coporation Chatbots Introduction
11.4.4 eGain Coporation Revenue in Chatbots Business (2017-2022)
11.4.5 eGain Coporation Recent Developments
11.5 Creative Virtual
11.5.1 Creative Virtual Company Details
11.5.2 Creative Virtual Business Overview
11.5.3 Creative Virtual Chatbots Introduction
11.5.4 Creative Virtual Revenue in Chatbots Business (2017-2022)
11.5.5 Creative Virtual Recent Developments
11.6 Next IT Corp.
11.6.1 Next IT Corp. Company Details
11.6.2 Next IT Corp. Business Overview
11.6.3 Next IT Corp. Chatbots Introduction
11.6.4 Next IT Corp. Revenue in Chatbots Business (2017-2022)
11.6.5 Next IT Corp. Recent Developments
11.7 CX Company
11.7.1 CX Company Company Details
11.7.2 CX Company Business Overview
11.7.3 CX Company Chatbots Introduction
11.7.4 CX Company Revenue in Chatbots Business (2017-2022)
11.7.5 CX Company Recent Developments
11.8 Speaktoit
11.8.1 Speaktoit Company Details
11.8.2 Speaktoit Business Overview
11.8.3 Speaktoit Chatbots Introduction
11.8.4 Speaktoit Revenue in Chatbots Business (2017-2022)
11.8.5 Speaktoit Recent Developments
11.9 Customer
11.9.1 Customer Company Details
11.9.2 Customer Business Overview
11.9.3 Customer Chatbots Introduction
11.9.4 Customer Revenue in Chatbots Business (2017-2022)
11.9.5 Customer Recent Developments
11.10 Codebaby
11.10.1 Codebaby Company Details
11.10.2 Codebaby Business Overview
11.10.3 Codebaby Chatbots Introduction
11.10.4 Codebaby Revenue in Chatbots Business (2017-2022)
11.10.5 Codebaby Recent Developments
12 Analyst's Viewpoints/Conclusions
13 Appendix
13.1 Research Methodology
13.1.1 Methodology/Research Approach
13.1.2 Data Source
13.2 Author Details
13.3 Disclaimer
List of Tables
Table 1. Global Chatbots Market Size Growth Rate by Type (US$ Million), 2017 VS 2021 VS 2028
Table 2. Key Players of Software
Table 3. Key Players of Services
Table 4. Global Chatbots Market Size Growth Rate by Application (US$ Million), 2017 VS 2021 VS 2028
Table 5. Global Chatbots Market Size by Region (US$ Million): 2017 VS 2021 VS 2028
Table 6. Global Chatbots Market Size by Region (2017-2022) & (US$ Million)
Table 7. Global Chatbots Market Share by Region (2017-2022)
Table 8. Global Chatbots Forecasted Market Size by Region (2023-2028) & (US$ Million)
Table 9. Global Chatbots Market Share by Region (2023-2028)
Table 10. Chatbots Market Trends
Table 11. Chatbots Market Drivers
Table 12. Chatbots Market Challenges
Table 13. Chatbots Market Restraints
Table 14. Global Chatbots Revenue by Players (2017-2022) & (US$ Million)
Table 15. Global Chatbots Revenue Share by Players (2017-2022)
Table 16. Global Top Chatbots by Company Type (Tier 1, Tier 2, and Tier 3) & (based on the Revenue in Chatbots as of 2021)
Table 17. Ranking of Global Top Chatbots Companies by Revenue (US$ Million) in 2021
Table 18. Global 5 Largest Players Market Share by Chatbots Revenue (CR5 and HHI) & (2017-2022)
Table 19. Key Players Headquarters and Area Served
Table 20. Key Players Chatbots Product Solution and Service
Table 21. Date of Enter into Chatbots Market
Table 22. Mergers & Acquisitions, Expansion Plans
Table 23. Global Chatbots Market Size by Type (2017-2022) & (US$ Million)
Table 24. Global Chatbots Revenue Market Share by Type (2017-2022)
Table 25. Global Chatbots Forecasted Market Size by Type (2023-2028) & (US$ Million)
Table 26. Global Chatbots Revenue Market Share by Type (2023-2028)
Table 27. Global Chatbots Market Size by Application (2017-2022) & (US$ Million)
Table 28. Global Chatbots Revenue Share by Application (2017-2022)
Table 29. Global Chatbots Forecasted Market Size by Application (2023-2028) & (US$ Million)
Table 30. Global Chatbots Revenue Share by Application (2023-2028)
Table 31. North America Chatbots Market Size by Type (2017-2022) & (US$ Million)
Table 32. North America Chatbots Market Size by Type (2023-2028) & (US$ Million)
Table 33. North America Chatbots Market Size by Application (2017-2022) & (US$ Million)
Table 34. North America Chatbots Market Size by Application (2023-2028) & (US$ Million)
Table 35. North America Chatbots Market Size by Country (2017-2022) & (US$ Million)
Table 36. North America Chatbots Market Size by Country (2023-2028) & (US$ Million)
Table 37. Europe Chatbots Market Size by Type (2017-2022) & (US$ Million)
Table 38. Europe Chatbots Market Size by Type (2023-2028) & (US$ Million)
Table 39. Europe Chatbots Market Size by Application (2017-2022) & (US$ Million)
Table 40. Europe Chatbots Market Size by Application (2023-2028) & (US$ Million)
Table 41. Europe Chatbots Market Size by Country (2017-2022) & (US$ Million)
Table 42. Europe Chatbots Market Size by Country (2023-2028) & (US$ Million)
Table 43. Asia Pacific Chatbots Market Size by Type (2017-2022) & (US$ Million)
Table 44. Asia Pacific Chatbots Market Size by Type (2023-2028) & (US$ Million)
Table 45. Asia Pacific Chatbots Market Size by Application (2017-2022) & (US$ Million)
Table 46. Asia Pacific Chatbots Market Size by Application (2023-2028) & (US$ Million)
Table 47. Asia Pacific Chatbots Market Size by Region (2017-2022) & (US$ Million)
Table 48. Asia Pacific Chatbots Market Size by Region (2023-2028) & (US$ Million)
Table 49. Latin America Chatbots Market Size by Type (2017-2022) & (US$ Million)
Table 50. Latin America Chatbots Market Size by Type (2023-2028) & (US$ Million)
Table 51. Latin America Chatbots Market Size by Application (2017-2022) & (US$ Million)
Table 52. Latin America Chatbots Market Size by Application (2023-2028) & (US$ Million)
Table 53. Latin America Chatbots Market Size by Country (2017-2022) & (US$ Million)
Table 54. Latin America Chatbots Market Size by Country (2023-2028) & (US$ Million)
Table 55. Middle East and Africa Chatbots Market Size by Type (2017-2022) & (US$ Million)
Table 56. Middle East and Africa Chatbots Market Size by Type (2023-2028) & (US$ Million)
Table 57. Middle East and Africa Chatbots Market Size by Application (2017-2022) & (US$ Million)
Table 58. Middle East and Africa Chatbots Market Size by Application (2023-2028) & (US$ Million)
Table 59. Middle East and Africa Chatbots Market Size by Country (2017-2022) & (US$ Million)
Table 60. Middle East and Africa Chatbots Market Size by Country (2023-2028) & (US$ Million)
Table 61. Artificial Solutions Company Details
Table 62. Artificial Solutions Business Overview
Table 63. Artificial Solutions Chatbots Product
Table 64. Artificial Solutions Revenue in Chatbots Business (2017-2022) & (US$ Million)
Table 65. Artificial Solutions Recent Developments
Table 66. IBM Watson Company Details
Table 67. IBM Watson Business Overview
Table 68. IBM Watson Chatbots Product
Table 69. IBM Watson Revenue in Chatbots Business (2017-2022) & (US$ Million)
Table 70. IBM Watson Recent Developments
Table 71. Naunce Communications Company Details
Table 72. Naunce Communications Business Overview
Table 73. Naunce Communications Chatbots Product
Table 74. Naunce Communications Revenue in Chatbots Business (2017-2022) & (US$ Million)
Table 75. Naunce Communications Recent Developments
Table 76. eGain Coporation Company Details
Table 77. eGain Coporation Business Overview
Table 78. eGain Coporation Chatbots Product
Table 79. eGain Coporation Revenue in Chatbots Business (2017-2022) & (US$ Million)
Table 80. eGain Coporation Recent Developments
Table 81. Creative Virtual Company Details
Table 82. Creative Virtual Business Overview
Table 83. Creative Virtual Chatbots Product
Table 84. Creative Virtual Revenue in Chatbots Business (2017-2022) & (US$ Million)
Table 85. Creative Virtual Recent Developments
Table 86. Next IT Corp. Company Details
Table 87. Next IT Corp. Business Overview
Table 88. Next IT Corp. Chatbots Product
Table 89. Next IT Corp. Revenue in Chatbots Business (2017-2022) & (US$ Million)
Table 90. Next IT Corp. Recent Developments
Table 91. CX Company Company Details
Table 92. CX Company Business Overview
Table 93. CX Company Chatbots Product
Table 94. CX Company Revenue in Chatbots Business (2017-2022) & (US$ Million)
Table 95. CX Company Recent Developments
Table 96. Speaktoit Company Details
Table 97. Speaktoit Business Overview
Table 98. Speaktoit Chatbots Product
Table 99. Speaktoit Revenue in Chatbots Business (2017-2022) & (US$ Million)
Table 100. Speaktoit Recent Developments
Table 101. Customer Company Details
Table 102. Customer Business Overview
Table 103. Customer Chatbots Product
Table 104. Customer Revenue in Chatbots Business (2017-2022) & (US$ Million)
Table 105. Customer Recent Developments
Table 106. Codebaby Company Details
Table 107. Codebaby Business Overview
Table 108. Codebaby Chatbots Product
Table 109. Codebaby Revenue in Chatbots Business (2017-2022) & (US$ Million)
Table 110. Codebaby Recent Developments
Table 111. Research Programs/Design for This Report
Table 112. Key Data Information from Secondary Sources
Table 113. Key Data Information from Primary Sources
List of Figures
Figure 1. Global Chatbots Market Share by Type: 2021 VS 2028
Figure 2. Software Features
Figure 3. Services Features
Figure 4. Global Chatbots Market Share by Application: 2021 VS 2028
Figure 5. Websites Case Studies
Figure 6. Contact Centers Case Studies
Figure 7. Social Media Case Studies
Figure 8. Mobile Platform Case Studies
Figure 9. Chatbots Report Years Considered
Figure 10. Global Chatbots Market Size (US$ Million), Year-over-Year: 2017-2028
Figure 11. Global Chatbots Market Size, (US$ Million), 2017 VS 2021 VS 2028
Figure 12. Global Chatbots Market Share by Region: 2021 VS 2028
Figure 13. Global Chatbots Market Share by Players in 2021
Figure 14. Global Top Chatbots Players by Company Type (Tier 1, Tier 2, and Tier 3) & (based on the Revenue in Chatbots as of 2021)
Figure 15. The Top 10 and 5 Players Market Share by Chatbots Revenue in 2021
Figure 16. North America Chatbots Market Size YoY (2017-2028) & (US$ Million)
Figure 17. North America Chatbots Market Size Market Share by Type (2017-2028)
Figure 18. North America Chatbots Market Size Market Share by Application (2017-2028)
Figure 19. North America Chatbots Market Size Share by Country (2017-2028)
Figure 20. United States Chatbots Market Size YoY Growth (2017-2028) & (US$ Million)
Figure 21. Canada Chatbots Market Size YoY Growth (2017-2028) & (US$ Million)
Figure 22. Europe Chatbots Market Size YoY (2017-2028) & (US$ Million)
Figure 23. Europe Chatbots Market Size Market Share by Type (2017-2028)
Figure 24. Europe Chatbots Market Size Market Share by Application (2017-2028)
Figure 25. Europe Chatbots Market Size Share by Country (2017-2028)
Figure 26. Germany Chatbots Market Size YoY Growth (2017-2028) & (US$ Million)
Figure 27. France Chatbots Market Size YoY Growth (2017-2028) & (US$ Million)
Figure 28. U.K. Chatbots Market Size YoY Growth (2017-2028) & (US$ Million)
Figure 29. Italy Chatbots Market Size YoY Growth (2017-2028) & (US$ Million)
Figure 30. Russia Chatbots Market Size YoY Growth (2017-2028) & (US$ Million)
Figure 31. Nordic Countries Chatbots Market Size YoY Growth (2017-2028) & (US$ Million)
Figure 32. Asia-Pacific Chatbots Market Size YoY (2017-2028) & (US$ Million)
Figure 33. Asia Pacific Chatbots Market Size Market Share by Type (2017-2028)
Figure 34. Asia Pacific Chatbots Market Size Market Share by Application (2017-2028)
Figure 35. Asia Pacific Chatbots Market Size Share by Region (2017-2028)
Figure 36. China Chatbots Market Size YoY Growth (2017-2028) & (US$ Million)
Figure 37. Japan Chatbots Market Size YoY Growth (2017-2028) & (US$ Million)
Figure 38. South Korea Chatbots Market Size YoY Growth (2017-2028) & (US$ Million)
Figure 39. Southeast Asia Chatbots Market Size YoY Growth (2017-2028) & (US$ Million)
Figure 40. India Chatbots Market Size YoY Growth (2017-2028) & (US$ Million)
Figure 41. Australia Chatbots Market Size YoY Growth (2017-2028) & (US$ Million)
List of Figures
Figure 42. Latin America Chatbots Market Size YoY (2017-2028) & (US$ Million)
Figure 43. Latin America Chatbots Market Size Market Share by Type (2017-2028)
Figure 44. Latin America Chatbots Market Size Market Share by Application (2017-2028)
Figure 45. Latin America Chatbots Market Size Share by Country (2017-2028)
Figure 46. Mexico Chatbots Market Size YoY Growth (2017-2028) & (US$ Million)
Figure 47. Brazil Chatbots Market Size YoY Growth (2017-2028) & (US$ Million)
Figure 48. Middle East & Africa Chatbots Market Size YoY (2017-2028) & (US$ Million)
Figure 49. Middle East and Africa Chatbots Market Size Market Share by Type (2017-2028)
Figure 50. Middle East and Africa Chatbots Market Size Market Share by Application (2017-2028)
Figure 51. Middle East and Africa Chatbots Market Size Share by Country (2017-2028)
Figure 52. Turkey Chatbots Market Size YoY Growth (2017-2028) & (US$ Million)
Figure 53. Saudi Arabia Chatbots Market Size YoY Growth (2017-2028) & (US$ Million)
Figure 54. UAE Chatbots Market Size YoY Growth (2017-2028) & (US$ Million)
Figure 55. Artificial Solutions Revenue Growth Rate in Chatbots Business (2017-2022)
Figure 56. IBM Watson Revenue Growth Rate in Chatbots Business (2017-2022)
Figure 57. Naunce Communications Revenue Growth Rate in Chatbots Business (2017-2022)
Figure 58. eGain Coporation Revenue Growth Rate in Chatbots Business (2017-2022)
Figure 59. Creative Virtual Revenue Growth Rate in Chatbots Business (2017-2022)
Figure 60. Next IT Corp. Revenue Growth Rate in Chatbots Business (2017-2022)
Figure 61. CX Company Revenue Growth Rate in Chatbots Business (2017-2022)
Figure 62. Speaktoit Revenue Growth Rate in Chatbots Business (2017-2022)
Figure 63. Customer Revenue Growth Rate in Chatbots Business (2017-2022)
Figure 64. Codebaby Revenue Growth Rate in Chatbots Business (2017-2022)
Figure 65. Bottom-up and Top-down Approaches for This Report
Figure 66. Data Triangulation
Figure 67. Key Executives Interviewed
$4900
$9800
HAVE A QUERY?
OUR CUSTOMER
