
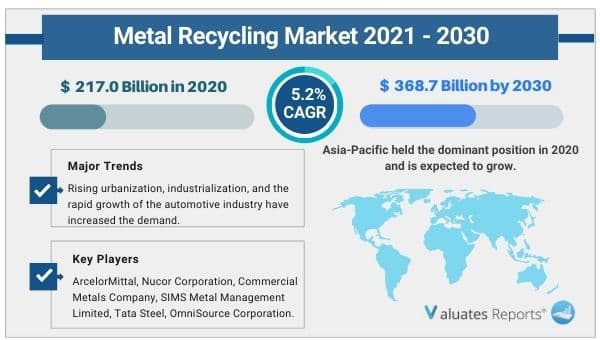
The global metal recycling market size was USD 217.0 Billion in 2020 and is expected to reach USD 368.7 Billion by 2030, registering a CAGR of 5.2% from 2021 to 2030. The conducive government initiatives for recycling scrap metal for reducing greenhouse gas emissions are expected to fuel the growth of the metal recycling market during the forecast period. The growing construction industry has resulted in more buildings thereby leading to the disposal of building waste into landfills. These wastages will significantly boost the growth of the market in the coming years.
However, the unorganized flow of waste metals and less penetration of scrap collection zones will restrict the market growth during the forecast period.
The rapid pace of industrialization
The booming urbanization has accelerated the global economy. The pace at which the developed and developing economies are moving towards industrialization is exponential. The rising commercial, residential projects, and growing income levels have created a huge demand for the scrap metal industry. Metal recyclers free up construction and industrial spaces from piles of metal waste. Moreover, they are reusable and can be recycled again and again. These factors will propel the growth of the metal recycling market in the upcoming years.
Government policies
The growing population growth has led to environmental degradation due to excessive consumption and waste disposal. Government authorities around the world are enacting policies to improve recycling efficiency and tackle environmental problems such as greenhouse gas emissions. This is done by eliminating waste dumping through scrap metal recycling. This will propel the growth of the metal recycling market during the forecast period.
Constructive industry
The construction industry is expanding at a rapid rate. The need for clearing piles of metal wastes from construction sites has augmented the need for scrap recyclers. Recycling provides huge benefits such as it ensures on-site safety, enhancing the environment, and provides extra income to people involved in the buying and selling of waste metals. Thus the growing construction activities will surge the growth of the metal recycling market in the subsequent years.
Unorganized sector and less presence of collection zones
The scrap metal industry will suffer due to unorganized dumping, recycling, and flow of waste metal materials. Moreover, the lesser number of scrap collection zones will further hamper the industry penetration. These factors will restrict the metal recycling market expansion during the forecast period.
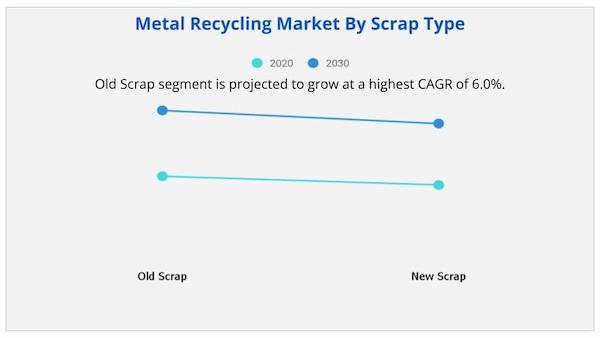
Based on scrap type, the old scrap type segment is expected to provide lucrative opportunities for growth in the metal recycling market share and will grow at a CAGR of 6.0%.
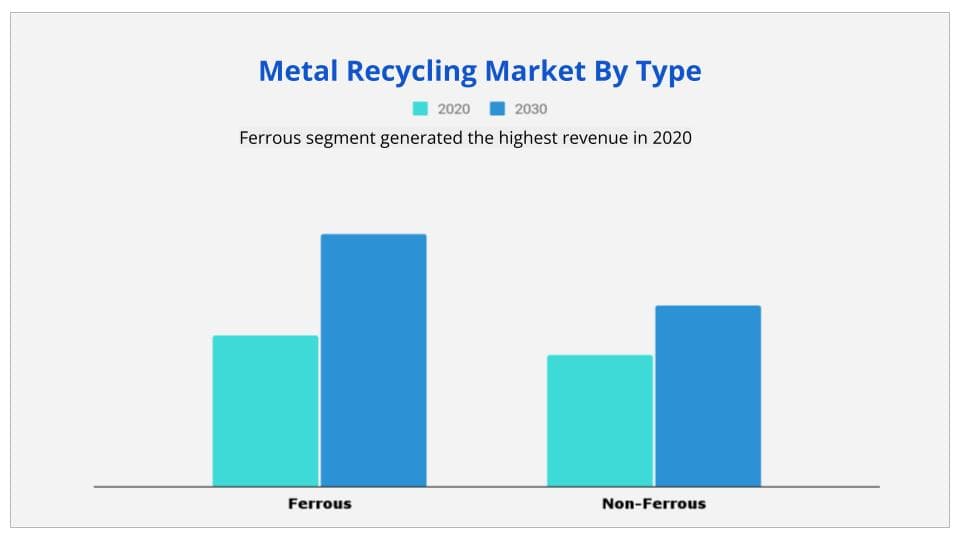
Based on metal type, the ferrous segment is expected to provide immense opportunities for growth in the metal recycling market share and will grow at 7.4% CAGR.
Based on end-user, the automotive segment will provide lucrative opportunities for growth in the metal recycling market share. While the electronics and equipment segment will grow the fastest.
Based on region, the Asia-pacific segment will grow at a CAGR of 45.5% during the forecast period.
|
Report Metric |
Details |
|
Report Name |
Metal Recycling Market |
|
Market size value in 2020 |
USD 217.0 Billion |
|
Revenue forecast in 2030 |
USD 368.7 Billion |
|
Growth Rate |
5.2% |
|
Base year considered |
2020 |
|
Forecast Period |
2021-2030 |
|
By Metal Type |
Ferrous and Non-Ferrous Metals |
|
By Scrap Type |
Old Scrap, and New Scrap |
|
End User |
Building & Construction, Packaging, Automotive, Industrial Machinery, Electronics & Electrical Equipment, Shipbuilding |
|
Report Coverage |
Revenue & volume forecast, company share, competitive landscape, growth factors, and trends |
|
Segments Covered |
By Type, Application, and Region |
|
Geographic Regions Covered |
North America, Europe, Asia Pacific, Latin America, Middle East & Africa |
Ans. The global metal recycling market size was $217.0 billion in 2020 and is expected to reach $368.7 billion by 2030, registering a CAGR of 5.2% from 2021 to 2030..
Ans. Major players such as Nucor Corporation, Commercial Metals Company, Aurubis AG, Dowa Holdings Co.Ltd. and others are adopting business expansion as key development strategy to improve the geographical presence of the metal recycling market.
3. Does the report provides covid-19 impact analysis?
Ans. Yes, the report includes a COVID-19 impact analysis. Also, it is further extended into every individual segment of the report.
List of Figures
FIG. 1 GLOBAL METAL RECYCLING MARKET, BY GEOGRAPHY, 2020-2030 ($MILLION)
FIG. 2 TOP IMPACTING FACTORS
FIG. 3 TOP INVESTMENT POCKETS
FIG. 4 TOP WINNING STRATEGY ANALYSIS OF METAL RECYCLING MARKET
FIG. 5 TOP WINNING STRATEGY ANALYSIS OF METAL RECYCLING MARKET (% COMPARISON)
FIG. 6 PORTERS FIVE FORCES ANALYSIS OF METAL RECYCLING MARKET
FIG. 7 VALUE CHAIN ANALYSIS OF METAL RECYCLING MARKET
FIG. 8 MARKET SHARE ANALYSIS, 2020
FIG. 9 COMPARATIVE ANALYSIS OF GLOBAL METAL GLOBAL METAL RECYCLING MARKET, BY METAL TYPE, 2020 & 2030 (%)
FIG. 10 STEEL SCRAP USE FOR STEELMAKING IN THE WORLD (MILLION TONNES)
FIG. 11 COMPARATIVE ANALYSIS OF GLOBAL METAL FERROUS METAL RECYCLING MARKET, 2020 & 2030 (%)
FIG. 12 GLOBAL FERROUS METAL RECYCLING MARKET REVENUE, 2020-2030 ($MILLION)
FIG. 13 FERROUS METAL RECYCLING MARKET BY GEOGRAPHY, 2020-2030 (%)
FIG. 14 COMPARATIVE ANALYSIS OF GLOBAL METAL NON-FERROUS METAL RECYCLING MARKET, 2020 & 2030 (%)
FIG. 15 GLOBAL NON-FERROUS METAL RECYCLING MARKET REVENUE, 2020-2030 ($MILLION)
FIG. 16 NON-FERROUS METAL RECYCLING MARKET BY GEOGRAPHY, 2020-2030 (%)
FIG. 17 COMPARATIVE ANALYSIS OF GLOBAL METAL RECYCLING MARKET BY END-USER INDUSTRY, 2020 & 2030 (%)
FIG. 18 COMPARATIVE ANALYSIS OF METAL AUTOMOTIVE METAL RECYCLING MARKET, BY GEOGRAPHY, 2020 & 2030 (%)
FIG. 19 END-OF-LIFE VEHICLE METAL RECYCLING VALUE CHAIN
FIG. 20 GLOBAL AUTOMOTIVE METAL RECYCLING MARKET REVENUE, 2020-2030 ($MILLION)
FIG. 21 AUTOMOTIVE METAL RECYCLING MARKET BY GEOGRAPHY, 2020-2030 (%)
FIG. 22 COMPARATIVE ANALYSIS OF METAL PACKAGING METAL RECYCLING MARKET, BY GEOGRAPHY, 2020 & 2030 (%)
FIG. 23 METAL PACKAGING RECYCLING RATES AROUND THE WORLD
FIG. 24 GLOBAL PACKAGING METAL RECYCLING MARKET REVENUE, 2020-2030 ($MILLION)
FIG. 25 PACKAGING METAL RECYCLING MARKET ANALYSIS BY GEOGRAPHY, 2020-2030 (%)
FIG. 26 COMPARATIVE ANALYSIS OF METAL BUILDING & CONSTRUCTION METAL RECYCLING MARKET, BY GEOGRAPHY, 2020 & 2030 (%)
FIG. 27 GLOBAL BUILDING & CONSTRUCTION METAL RECYCLING MARKET REVENUE, 2020-2030 ($MILLION)
FIG. 28 BUILDING & CONSTRUCTION METAL RECYCLING MARKET BY GEOGRAPHY, 2020-2030 (%)
FIG. 29 COMPARATIVE ANALYSIS OF METAL CONSUMER ELECTRONICS & ELECTRICAL EQUIPMENT METAL RECYCLING MARKET, BY GEOGRAPHY, 2020 & 2030 (%)
FIG. 30 GLOBAL ELECTRONICS & ELECTRICAL EQUIPMENT METAL RECYCLING MARKET REVENUE, 2020-2030 ($MILLION)
FIG. 31 ELECTRONICS & ELECTRICAL EQUIPMENT METAL RECYCLING MARKET BY GEOGRAPHY, 2020-2030 (%)
FIG. 32 COMPARATIVE ANALYSIS OF METAL SHIPBUILDING METAL RECYCLING MARKET, BY GEOGRAPHY, 2020 & 2030 (%)
FIG. 33 GLOBAL SHIPBUILDING METAL RECYCLING MARKET REVENUE, 2020-2030 ($MILLION)
FIG. 34 SHIPBUILDING METAL RECYCLING MARKET BY GEOGRAPHY, 2020-2030 (%)
FIG. 35 COMPARATIVE ANALYSIS INDUSTRIAL MACHINERY METAL RECYCLING MARKET, BY GEOGRAPHY, 2020 & 2030 (%)
FIG. 36 GLOBAL INDUSTRIAL MACHINERY METAL RECYCLING MARKET REVENUE, 2020-2030 ($MILLION)
FIG. 37 INDUSTRIAL MACHINERY METAL RECYCLING MARKET BY GEOGRAPHY, 2020-2030 (%)
FIG. 38 COMPARATIVE ANALYSIS OF METAL OTHER INDUSTRIES METAL RECYCLING MARKET, BY GEOGRAPHY, 2020 & 2030 (%)
FIG. 39 GLOBAL OTHER INDUSTRIES METAL RECYCLING MARKET REVENUE, 2020-2030 ($MILLION)
FIG. 40 OTHER INDUSTRIES METAL RECYCLING MARKET BY GEOGRAPHY, 2020-2030 (%)
FIG. 41 COMPARATIVE ANALYSIS OF GLOBAL METAL RECYCLING MARKET BY END-USER INDUSTRY, 2014 & 2022 (%)
FIG. 42 LARGEST CONSUMERS OF STEEL SCRAP, BY COUNTRY, 2012 & 2013
FIG. 43 COMPARATIVE ANALYSIS OF METAL RECYCLING- END-USER INDUSTRY MARKET
FIG. 44 NORTH AMERICAN MARKET REVENUE, BY END-USER INDUSTRY, 2020-2030 ($MILLION)
FIG. 45 U.S. FERROUS SCRAP EXPORTS, BY MAJOR DESTINATIONS, 2009-2013
FIG. 46 U.S.: METAL RECYCLING MARKET, 2020-2030 ($MILLION)
FIG. 47 METALS RECYCLING INDUSTRY STRUCTURE
FIG. 48 CANADA: METAL RECYCLING MARKET, 2020-2030 ($MILLION)
FIG. 49 MEXICO: METAL RECYCLING MARKET, 2020-2030 ($MILLION)
FIG. 50 COMPARATIVE ANALYSIS OF METAL RECYCLING- END-USER INDUSTRY MARKET SHARE OF EUROPE MARKET, 2020 & 2030 (%)
FIG. 51 EUROPE MARKET REVENUE, BY END-USER INDUSTRY, 2020-2030 ($MILLION)
FIG. 52 GERMANY: METAL RECYCLING MARKET, 2020-2030 ($MILLION)
FIG. 53 U.K.: METAL RECYCLING MARKET, 2020-2030 ($MILLION)
FIG. 54 RUSSIA: METAL RECYCLING MARKET, 2020-2030 ($MILLION)
FIG. 55 ITALY: METAL RECYCLING MARKET, 2020-2030 ($MILLION)
FIG. 56 SPAIN: METAL RECYCLING MARKET, 2020-2030 ($MILLION)
FIG. 57 REST OF EUROPE: METAL RECYCLING MARKET, 2020-2030 ($MILLION)
FIG. 58 COMPARATIVE ANALYSIS OF METAL RECYCLING- END-USER INDUSTRY MARKET SHARE OF ASIA-PACIFIC MARKET, 2020 & 2030 (%)
FIG. 59 ASIA-PACIFIC MARKET REVENUE, BY END-USER INDUSTRY, 2020-2030 ($MILLION)
FIG. 60 CHINA: METAL RECYCLING MARKET, 2020-2030 ($MILLION)
FIG. 61 JAPAN: METAL RECYCLING MARKET, 2020-2030 ($MILLION)
FIG. 62 INDIA: METAL RECYCLING MARKET, 2020-2030 ($MILLION)
FIG. 63 SOUTH KOREA: METAL RECYCLING MARKET, 2020-2030 ($MILLION)
FIG. 64 REST OF ASIA-PACIFIC: METAL RECYCLING MARKET, 2020-2030 ($MILLION)
FIG. 65 COMPARATIVE ANALYSIS OF METAL RECYCLING- END-USER INDUSTRY MARKET SHARE OF LAMEA MARKET, 2020 & 2030 (%)
FIG. 66 LAMEA MARKET REVENUE, BY END-USER INDUSTRY, 2020-2030 ($MILLION)
FIG. 67 LATIN AMERICA: METAL RECYCLING MARKET, 2020-2030 ($MILLION)
FIG. 68 MIDDLE EAST: METAL RECYCLING MARKET, 2020-2030 ($MILLION)
FIG. 69 AFRICA: METAL RECYCLING MARKET, 2020-2030 ($MILLION)
FIG. 70 ARCELORMITTAL: SALES, 2018-2020 ($MILLION)
FIG. 71 ARCELORMITTAL: SALES, BY BUSINESS SEGMENT, 2020 (%)
FIG. 72 ARCELORMITTAL: SALES, BY GEOGRAPHY, 2020 (%)
FIG. 73 COMMERCIAL METALS COMPANY: NET SALES, 2018-2020 ($MILLION)
FIG. 74 COMMERCIAL METALS COMPANY: NET SALES, BY PRODUCT, 2020 (%)
FIG. 75 COMMERCIAL METALS COMPANY: NET SALES, BY GEOGRAPHY, 2020 (%)
FIG. 76 SIMS METAL MANAGEMENT LIMITED: REVENUE, 2018-2020 ($MILLION)
FIG. 77 SIMS METAL MANAGEMENT LIMITED: REVENUE, BY BUSINESS SEGMENT, 2020 (%)
FIG. 78 SIMS METAL MANAGEMENT LIMITED: REVENUE, BY GEOGRAPHY, 2020 (%)
FIG. 79 NUCOR CORPORATION: NET SALES, 2018-2020 ($MILLION)
FIG. 80 NUCOR CORPORATION: NET SALES, BY BUSINESS SEGMENT, 2020 (%)
FIG. 81 AURUBIS AG: REVENUE, 2018-2020 ($MILLION)
FIG. 82 AURUBIS AG: REVENUE, BY BUSINESS SEGMENT, 2020 (%)
FIG. 83 AURUBIS AG: REVENUE, BY GEOGRAPHY, 2020 (%)
FIG. 84 SCHNITZER STEEL INDUSTRIES, INC.: REVENUE, 2018-2020 ($MILLION)
FIG. 85 SCHNITZER STEEL INDUSTRIES, INC.: REVENUE, BY BUSINESS SEGMENT, 2020 (%)
FIG. 86 SCHNITZER STEEL INDUSTRIES, INC.: REVENUE, BY GEOGRAPHY, 2020 (%)
FIG. 87 DOWA HOLDINGS CO., LTD.: NET SALES, 2018-2020 ($MILLION)
FIG. 88 DOWA HOLDINGS CO., LTD.: NET SALES, BY BUSINESS SEGMENT, 2020 (%)
FIG. 89 DOWA HOLDINGS CO., LTD.: NET SALES, BY GEOGRAPHY, 2020 (%)
FIG. 90 STEEL DYNAMICS, INC.: NET SALES, 2018-2020 ($MILLION)
FIG. 91 STEEL DYNAMICS, INC.: NET SALES, BY BUSINESS SEGMENT, 2020 (%)
FIG. 92 TATA STEEL: NET SALES, 2018-2020, ($MILLION)
FIG. 93 TATA STEEL: NET SALES, BY BUSINESS SEGMENT, 2020 (%)
FIG. 94 TATA STEEL: NET SALES, By year 2020
List of Tables
TABLE 1 GLOBAL METAL RECYCLING MARKET, BY METAL TYPE, 2020-2030 ($MILLION)
TABLE 2 FERROUS METAL RECYCLING MARKET, BY GEOGRAPHY, 2020-2030 ($MILLION)
TABLE 3 NON-FERROUS METAL RECYCLING MARKET, BY GEOGRAPHY, 2020-2030 ($MILLION)
TABLE 4 GLOBAL METAL RECYCLING MARKET, BY END USER INDUSTRY, 2020-2030 ($MILLION)
TABLE 5 AUTOMOTIVE METAL RECYCLING MARKET REVENUE BY GEOGRAPHY, 2020-2030 ($MILLION)
TABLE 6 PACKAGING METAL RECYCLING MARKET REVENUE BY GEOGRAPHY, 2020-2030 ($MILLION)
TABLE 7 BUILDING & CONSTRUCTION METAL RECYCLING MARKET REVENUE BY GEOGRAPHY, 2020-2030 ($MILLION)
TABLE 8 ELECTRONICS & ELECTRICAL EQUIPMENT METAL RECYCLING MARKET REVENUE BY GEOGRAPHY, 2020-2030 ($MILLION)
TABLE 9 SHIPBUILDING METAL RECYCLING MARKET REVENUE BY GEOGRAPHY, 2020-2030 ($MILLION)
TABLE 10 INDUSTRIAL MACHINERY METAL RECYCLING MARKET REVENUE BY GEOGRAPHY, 2020-2030 ($MILLION)
TABLE 11 OTHER INDUSTRIES METAL RECYCLING MARKET REVENUE BY GEOGRAPHY, 2020-2030 ($MILLION)
TABLE 12 NORTH AMERICA: METAL RECYCLING MARKET, BY END-USER INDUSTRY, 2020-2030 ($MILLION)
TABLE 13 NORTH AMERICA METAL RECYCLING MARKET, BY COUNTRY, 2020-2030 ($MILLION)
TABLE 14 EUROPE METAL RECYCLING MARKET, BY END-USER INDUSTRY, 2020-2030 ($MILLION)
TABLE 15 EUROPE METAL RECYCLING MARKET, BY COUNTRY, 2020-2030 ($MILLION)
TABLE 16 ASIA-PACIFIC METAL RECYCLING MARKET, BY END-USER INDUSTRY, 2020-2030 ($MILLION)
TABLE 17 ASIA-PACIFIC METAL RECYCLING MARKET, BY COUNTRY, 2020-2030 ($MILLION)
TABLE 18 LAMEA METAL RECYCLING MARKET, BY END-USER INDUSTRY, 2020-2030 ($MILLION)
TABLE 19 LAMEA METAL RECYCLING MARKET, BY COUNTRY, 2020-2030 ($MILLION)
TABLE 20 ARCELORMITTAL COMPANY SNAPSHOT
TABLE 21 ARCELORMITTAL OPERATING BUSINESS SEGMENTS
TABLE 22 COMMERCIAL METALS COMPANY COMPANY SNAPSHOT
TABLE 23 COMMERCIAL METALS COMPANY OPERATING BUSINESS SEGMENTS
TABLE 24 SIMS METAL MANAGEMENT LIMITED- COMPANY SNAPSHOT
TABLE 25 SIMS METAL MANAGEMENT LIMITED OPERATING BUSINESS SEGMENTS
TABLE 26 NUCOR CORPORATION- COMPANY SNAPSHOT
TABLE 27 NUCOR CORPORATION OPERATING BUSINESS SEGMENTS
TABLE 28 AURUBIS AG - COMPANY SNAPSHOT
TABLE 29 AURUBIS AG OPERATING BUSINESS SEGMENTS
TABLE 30 EUROPEAN METAL RECYCLING LIMITED COMPANY SNAPSHOT
TABLE 31 SCHNITZER STEEL INDUSTRIES, INC. COMPANY SNAPSHOT
TABLE 32 SCHNITZER STEEL INDUSTRIES, INC.- OPERATING BUSINESS SEGMENTS
TABLE 33 DOWA HOLDINGS CO., LTD. COMPANY SNAPSHOT
TABLE 34 DOWA HOLDINGS CO., LTD.- OPERATING BUSINESS SEGMENTS
TABLE 35 OMNISOURCE CORPORATION COMPANY SNAPSHOT
TABLE 36 OMNISOURCE CORPORATION- OPERATING BUSINESS SEGMENTS
TABLE 37 TATA STEEL- COMPANY SNAPSHOT
TABLE 38 TATA STEEL- OPERATING BUSINESS SEGMENTS
$5769
$9995
HAVE A QUERY?
OUR CUSTOMER

SIMILAR REPORTS