LIST OF TABLES
TABLE 01.GLOBAL CONSTRUCTION & DEMOLITION WASTE RECYCLING MARKET REVENUE, BY SOURCE, 2019–2027 ($MILLION)
TABLE 02.CONSTRUCTION & DEMOLITION WASTE RECYCLING MARKET REVENUE, FOR CONSTRUCTION SEGMENT, BY REGION, 2019–2027 ($MILLION)
TABLE 03.CONSTRUCTION & DEMOLITION WASTE RECYCLING MARKET REVENUE, FOR RENOVATION SEGMENT, BY REGION, 2019–2027 ($MILLION)
TABLE 04.CONSTRUCTION & DEMOLITION WASTE RECYCLING MARKET REVENUE, FOR DEMOLITION SEGMENT, BY REGION, 2019–2027 ($MILLION)
TABLE 05.GLOBAL CONSTRUCTION & DEMOLITION WASTE RECYCLING MARKET REVENUE, BY SERVICE, 2019–2027 ($MILLION)
TABLE 06.CONSTRUCTION & DEMOLITION WASTE RECYCLING MARKET REVENUE FOR COLLECTION SEGMENT, BY REGION, 2019–2027 ($MILLION)
TABLE 07.CONSTRUCTION & DEMOLITION WASTE RECYCLING MARKET REVENUE FOR DISPOSAL SEGMENT, BY REGION, 2019–2027 ($MILLION)
TABLE 08.GLOBAL CONSTRUCTION & DEMOLITION WASTE RECYCLING MARKET REVENUE, BY MATERIAL, 2019–2027 ($MILLION)
TABLE 09.CONSTRUCTION & DEMOLITION WASTE RECYCLING MARKET REVENUE, FOR CONCRETE SEGMENT, BY REGION, 2019–2027 ($MILLION)
TABLE 10.CONSTRUCTION & DEMOLITION WASTE RECYCLING MARKET REVENUE, FOR BRICKS SEGMENT, BY REGION, 2019–2027 ($MILLION)
TABLE 11.CONSTRUCTION & DEMOLITION WASTE RECYCLING MARKET REVENUE, FOR METAL SEGMENT, BY REGION, 2019–2027 ($MILLION)
TABLE 12.CONSTRUCTION & DEMOLITION WASTE RECYCLING MARKET REVENUE, FOR WOOD SEGMENT, BY REGION, 2019–2027 ($MILLION)
TABLE 13.CONSTRUCTION & DEMOLITION WASTE RECYCLING MARKET REVENUE, FOR OTHERS SEGMENT, BY REGION, 2019–2027 ($MILLION)
TABLE 14.CONSTRUCTION & DEMOLITION WASTE RECYCLING MARKET, BY REGION, 2019–2027 ($MILLION)
TABLE 15.NORTH AMERICA CONSTRUCTION & DEMOLITION WASTE RECYCLING MARKET, BY SOURCE, 2019–2027 ($MILLION)
TABLE 16.NORTH AMERICA CONSTRUCTION & DEMOLITION WASTE RECYCLING MARKET REVENUE, BY SERVICE, 2019–2027 ($MILLION)
TABLE 17.NORTH AMERICA CONSTRUCTION & DEMOLITION WASTE RECYCLING MARKET REVENUE, BY MATERIAL, 2019–2027 ($MILLION)
TABLE 18.NORTH AMERICA CONSTRUCTION & DEMOLITION WASTE RECYCLING MARKET, BY COUNTRY, 2019–2027 ($MILLION)
TABLE 19.U.S. CONSTRUCTION & DEMOLITION WASTE RECYCLING MARKET, BY SOURCE, 2019–2027 ($MILLION)
TABLE 20.U.S. CONSTRUCTION & DEMOLITION WASTE RECYCLING MARKET, BY SERVICE, 2019–2027 ($MILLION)
TABLE 21.U.S. CONSTRUCTION & DEMOLITION WASTE RECYCLING MARKET, BY MATERIAL, 2019–2027 ($MILLION)
TABLE 22.CANADA CONSTRUCTION & DEMOLITION WASTE RECYCLING MARKET, BY SOURCE, 2019–2027 ($MILLION)
TABLE 23.CANADA CONSTRUCTION & DEMOLITION WASTE RECYCLING MARKET, BY SERVICE, 2019–2027 ($MILLION)
TABLE 24.CANADA CONSTRUCTION & DEMOLITION WASTE RECYCLING MARKET, BY MATERIAL, 2019–2027 ($MILLION)
TABLE 25.MEXICO CONSTRUCTION & DEMOLITION WASTE RECYCLING MARKET, BY SOURCE, 2019–2027 ($MILLION)
TABLE 26.MEXICO CONSTRUCTION & DEMOLITION WASTE RECYCLING MARKET, BY SERVICE, 2019–2027 ($MILLION)
TABLE 27.MEXICO CONSTRUCTION & DEMOLITION WASTE RECYCLING MARKET, BY MATERIAL, 2019–2027 ($MILLION)
TABLE 28.EUROPE CONSTRUCTION & DEMOLITION WASTE RECYCLING MARKET, BY SOURCE, 2019–2027 ($MILLION)
TABLE 29.EUROPE CONSTRUCTION & DEMOLITION WASTE RECYCLING MARKET, BY SERVICE, 2019–2027 ($MILLION)
TABLE 30.EUROPE CONSTRUCTION & DEMOLITION WASTE RECYCLING MARKET REVENUE, BY MATERIAL, 2019–2027 ($MILLION)
TABLE 31.EUROPE CONSTRUCTION & DEMOLITION WASTE RECYCLING MARKET, BY COUNTRY, 2019–2027 ($MILLION)
TABLE 32.GERMANY CONSTRUCTION & DEMOLITION WASTE RECYCLING MARKET, BY SOURCE, 2019–2027 ($MILLION)
TABLE 33.GERMANY CONSTRUCTION & DEMOLITION WASTE RECYCLING MARKET, BY SERVICE, 2019–2027 ($MILLION)
TABLE 34.GERMANY CONSTRUCTION & DEMOLITION WASTE RECYCLING MARKET, BY MATERIAL, 2019–2027 ($MILLION)
TABLE 35.FRANCE CONSTRUCTION & DEMOLITION WASTE RECYCLING MARKET, BY SOURCE, 2019–2027 ($MILLION)
TABLE 36.FRANCE CONSTRUCTION & DEMOLITION WASTE RECYCLING MARKET, BY SERVICE, 2019–2027 ($MILLION)
TABLE 37.FRANCE CONSTRUCTION & DEMOLITION WASTE RECYCLING MARKET, BY MATERIAL, 2019–2027 ($MILLION)
TABLE 38.UK CONSTRUCTION & DEMOLITION WASTE RECYCLING MARKET, BY SOURCE, 2019–2027 ($MILLION)
TABLE 39.UK CONSTRUCTION & DEMOLITION WASTE RECYCLING MARKET, BY SERVICE, 2019–2027 ($MILLION)
TABLE 40.UK CONSTRUCTION & DEMOLITION WASTE RECYCLING MARKET, BY MATERIAL, 2019–2027 ($MILLION)
TABLE 41.ITALY CONSTRUCTION & DEMOLITION WASTE RECYCLING MARKET, BY SOURCE, 2019–2027 ($MILLION)
TABLE 42.ITALY CONSTRUCTION & DEMOLITION WASTE RECYCLING MARKET, BY SERVICE, 2019–2027 ($MILLION)
TABLE 43.ITALY CONSTRUCTION & DEMOLITION WASTE RECYCLING MARKET, BY MATERIAL, 2019–2027 ($MILLION)
TABLE 44.REST OF EUROPE CONSTRUCTION & DEMOLITION WASTE RECYCLING MARKET, BY SOURCE, 2019–2027 ($MILLION)
TABLE 45.REST OF EUROPE CONSTRUCTION & DEMOLITION WASTE RECYCLING MARKET, BY SERVICE, 2019–2027 ($MILLION)
TABLE 46.REST OF EUROPE CONSTRUCTION & DEMOLITION WASTE RECYCLING MARKET, BY MATERIAL, 2019–2027 ($MILLION)
TABLE 47.ASIA-PACIFIC CONSTRUCTION & DEMOLITION WASTE RECYCLING MARKET, BY SOURCE, 2019–2027 ($MILLION)
TABLE 48.ASIA-PACIFIC CONSTRUCTION & DEMOLITION WASTE RECYCLING MARKET, BY SERVICE, 2019–2027 ($MILLION)
TABLE 49.ASIA-PACIFIC CONSTRUCTION & DEMOLITION WASTE RECYCLING MARKET REVENUE, BY MATERIAL, 2019–2027 ($MILLION)
TABLE 50.ASIA-PACIFIC CONSTRUCTION & DEMOLITION WASTE RECYCLING MARKET, BY COUNTRY, 2019–2027 ($MILLION)
TABLE 51.CHINA CONSTRUCTION & DEMOLITION WASTE RECYCLING MARKET, BY SOURCE, 2019–2027 ($MILLION)
TABLE 52.CHINA CONSTRUCTION & DEMOLITION WASTE RECYCLING MARKET, BY SERVICE, 2019–2027 ($MILLION)
TABLE 53.CHINA CONSTRUCTION & DEMOLITION WASTE RECYCLING MARKET, BY MATERIAL, 2019–2027 ($MILLION)
TABLE 54.JAPAN CONSTRUCTION & DEMOLITION WASTE RECYCLING MARKET, BY SOURCE, 2019–2027 ($MILLION)
TABLE 55.JAPAN CONSTRUCTION & DEMOLITION WASTE RECYCLING MARKET, BY SERVICE, 2019–2027 ($MILLION)
TABLE 56.JAPAN CONSTRUCTION & DEMOLITION WASTE RECYCLING MARKET, BY MATERIAL, 2019–2027 ($MILLION)
TABLE 57.INDIA CONSTRUCTION & DEMOLITION WASTE RECYCLING MARKET, BY SOURCE, 2019–2027 ($MILLION)
TABLE 58.INDIA CONSTRUCTION & DEMOLITION WASTE RECYCLING MARKET, BY SERVICE, 2019–2027 ($MILLION)
TABLE 59.INDIA CONSTRUCTION & DEMOLITION WASTE RECYCLING MARKET, BY MATERIAL, 2019–2027 ($MILLION)
TABLE 60.SOUTH KOREA CONSTRUCTION & DEMOLITION WASTE RECYCLING MARKET, BY SOURCE, 2019–2027 ($MILLION)
TABLE 61.SOUTH KOREA CONSTRUCTION & DEMOLITION WASTE RECYCLING MARKET, BY SERVICE, 2019–2027 ($MILLION)
TABLE 62.SOUTH KOREA CONSTRUCTION & DEMOLITION WASTE RECYCLING MARKET, BY MATERIAL, 2019–2027 ($MILLION)
TABLE 63.REST OF ASIA-PACIFIC CONSTRUCTION & DEMOLITION WASTE RECYCLING MARKET REVENUE, BY SOURCE, 2019–2027 ($MILLION)
TABLE 64.REST OF ASIA-PACIFIC CONSTRUCTION & DEMOLITION WASTE RECYCLING MARKET, BY SERVICE, 2019–2027 ($MILLION)
TABLE 65.REST OF ASIA-PACIFIC CONSTRUCTION & DEMOLITION WASTE RECYCLING MARKET, BY MATERIAL, 2019–2027 ($MILLION)
TABLE 66.LAMEA CONSTRUCTION & DEMOLITION WASTE RECYCLING MARKET, BY SOURCE, 2019–2027 ($MILLION)
TABLE 67.LAMEA CONSTRUCTION & DEMOLITION WASTE RECYCLING MARKET, BY SERVICE, 2019–2027 ($MILLION)
TABLE 68.LAMEA CONSTRUCTION & DEMOLITION WASTE RECYCLING MARKET REVENUE, BY MATERIAL, 2019–2027 ($MILLION)
TABLE 69.LAMEA CONSTRUCTION & DEMOLITION WASTE RECYCLING MARKET, BY COUNTRY, 2019–2027 ($MILLION)
TABLE 70.LATIN AMERICA CONSTRUCTION & DEMOLITION WASTE RECYCLING MARKET, BY SOURCE, 2019–2027 ($MILLION)
TABLE 71.LATIN AMERICA CONSTRUCTION & DEMOLITION WASTE RECYCLING MARKET, BY SERVICE, 2019–2027 ($MILLION)
TABLE 72.LATIN AMERICA CONSTRUCTION & DEMOLITION WASTE RECYCLING MARKET, BY MATERIAL, 2019–2027 ($MILLION)
TABLE 73.MIDDLE EAST CONSTRUCTION & DEMOLITION WASTE RECYCLING MARKET, BY SOURCE, 2019–2027 ($MILLION)
TABLE 74.MIDDLE EAST CONSTRUCTION & DEMOLITION WASTE RECYCLING MARKET, BY SERVICE, 2019–2027 ($MILLION)
TABLE 75.MIDDLE EAST CONSTRUCTION & DEMOLITION WASTE RECYCLING MARKET, BY MATERIAL, 2019–2027 ($MILLION)
TABLE 76.AFRICA CONSTRUCTION & DEMOLITION WASTE RECYCLING MARKET, BY SOURCE, 2019–2027 ($MILLION)
TABLE 77.AFRICA CONSTRUCTION & DEMOLITION WASTE RECYCLING MARKET, BY SERVICE, 2019–2027 ($MILLION)
TABLE 78.AFRICA CONSTRUCTION & DEMOLITION WASTE RECYCLING MARKET, BY MATERIAL, 2019–2027 ($MILLION)
TABLE 79.KEY BUSINESS EXPANSION, (2017–2020)
TABLE 80.KEY ACQUISITION, (2017–2020)
TABLE 81.KEY PARTNERSHIP, (2017–2020)
TABLE 82.KEY AGREEMENT, (2017–2020)
TABLE 83.KEY JOINT VENTURE, (2017–2020)
TABLE 84.CLEAN HARBORS, INC.: KEY EXECUTIVES
TABLE 85.CLEAN HARBORS, INC.: COMPANY SNAPSHOT
TABLE 86.CLEAN HARBORS, INC.: OPERATING SEGMENTS
TABLE 87.CLEAN HARBORS, INC.: SERVICE PORTFOLIO
TABLE 88.DAISEKI CO., LTD.: KEY EXECUTIVES
TABLE 89.DAISEKI CO., LTD.: COMPANY SNAPSHOT
TABLE 90.DAISEKI CO., LTD.: OPERATING CATEGORIES
TABLE 91.DAISEKI CO., LTD.: SERVICE PORTFOLIO
TABLE 92.FCC ENVIRONMENT: KEY EXECUTIVES
TABLE 93.FCC ENVIRONMENT: COMPANY SNAPSHOT
TABLE 94.FCC ENVIRONMENT: OPERATING SEGMENTS
TABLE 95.FCC ENVIRONMENT: SERVICE PORTFOLIO
TABLE 96.PROGRESSIVE WASTE SOLUTIONS LTD.: KEY EXECUTIVES
TABLE 97.PROGRESSIVE WASTE SOLUTIONS LTD.: COMPANY SNAPSHOT
TABLE 98.PROGRESSIVE WASTE SOLUTIONS LTD.: OPERATING CATEGORIES
TABLE 99.PROGRESSIVE WASTE SOLUTIONS LTD.: SERVICE PORTFOLIO
TABLE 100.REMONDIS SE & CO. KG: KEY EXECUTIVES
TABLE 101.REMONDIS SE & CO. KG: COMPANY SNAPSHOT
TABLE 102.REMONDIS SE & CO. KG: OPERATING SEGMENTS
TABLE 103.REMONDIS SE & CO. KG: SERVICE PORTFOLIO
TABLE 104.RENEWI PLC: KEY EXECUTIVES
TABLE 105.RENEWI PLC: COMPANY SNAPSHOT
TABLE 106.RENEWI PLC: OPERATING SEGMENTS
TABLE 107.RENEWI PLC: SERVICE PORTFOLIO
TABLE 108.REPUBLIC SERVICES, INC.: KEY EXECUTIVES
TABLE 109.REPUBLIC SERVICES, INC.: COMPANY SNAPSHOT
TABLE 110.REPUBLIC SERVICES, INC.: OPERATING SEGMENTS
TABLE 111.REPUBLIC SERVICES, INC.: PRODUCT PORTFOLIO
TABLE 112.VEOLIA ENVIRONNEMENT: KEY EXECUTIVES
TABLE 113.VEOLIA ENVIRONNEMENT: COMPANY SNAPSHOT
TABLE 114.VEOLIA ENVIRONNEMENT: OPERATING SEGMENTS
TABLE 115.VEOLIA ENVIRONNEMENT: PRODUCT PORTFOLIO
TABLE 116.WASTE CONNECTION: KEY EXECUTIVES
TABLE 117.WASTE CONNECTION: COMPANY SNAPSHOT
TABLE 118.WASTE CONNECTION: OPERATING SEGMENTS
TABLE 119.WASTE CONNECTION: SERVICE PORTFOLIO
TABLE 120.WASTE MANAGEMENT INC.: KEY EXECUTIVES
TABLE 121.WASTE MANAGEMENT INC.: COMPANY SNAPSHOT
TABLE 122.WASTE MANAGEMENT INC.: OPERATING SEGMENTS
TABLE 123.WASTE MANAGEMENT INC.: SERVICE PORTFOLIO LIST OF FIGURES
FIGURE 01.KEY MARKET SEGMENTS
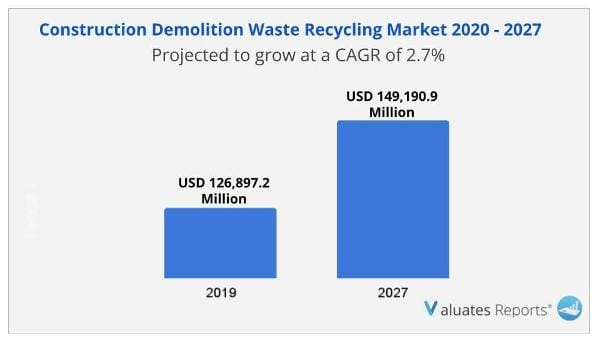
FIGURE 02.GLOBAL CONSTRUCTION & DEMOLITION WASTE RECYCLING MARKET, 2020–2027
FIGURE 03.GLOBAL CONSTRUCTION & DEMOLITION WASTE RECYCLING MARKET, BY COUNTRY, 2020–2027
FIGURE 04.GLOBAL CONSTRUCTION & DEMOLITION WASTE RECYCLING MARKET: KEY PLAYERS
FIGURE 05.TOP INVESTMENT POCKETS
FIGURE 06.MODERATE BARGAINING POWER OF SUPPLIERS
FIGURE 07.LOW TO MODERATE BARGAINING POWER OF BUYERS
FIGURE 08.MODERATE TO HIGH THREAT OF SUBSTITUTES
FIGURE 09.LOW TO MODERATE THREAT OF NEW ENTRANTS
FIGURE 10.MODERATE INTENSITY OF RIVALRY
FIGURE 11.GLOBAL CONSTRUCTION & DEMOLITION WASTE RECYCLING MARKET, BY SOURCE, 2019–2027
FIGURE 12.CONSTRUCTION & DEMOLITION WASTE RECYCLING MARKET REVENUE, FOR CONSTRUCTION SEGMENT, BY COUNTRY, 2019–2027 (%)
FIGURE 13.CONSTRUCTION & DEMOLITION WASTE RECYCLING MARKET REVENUE, FOR RENOVATION SEGMENT, BY COUNTRY, 2019–2027 (%)
FIGURE 14.CONSTRUCTION & DEMOLITION WASTE RECYCLING MARKET REVENUE, FOR DEMOLITION SEGMENT, BY COUNTRY, 2019–2027 (%)
FIGURE 15.GLOBAL CONSTRUCTION & DEMOLITION WASTE RECYCLING MARKET, BY SERVICE, 2019–2027
FIGURE 16.COLLECTION CONSTRUCTION & DEMOLITION WASTE RECYCLING MARKET REVENUE FOR COLLECTION SEGMENT, BY COUNTRY, 2019–2027 (%)
FIGURE 17.CONSTRUCTION & DEMOLITION WASTE RECYCLING MARKET REVENUE FOR DISPOSAL SEGMENT, BY COUNTRY, 2019–2027 (%)
FIGURE 18.GLOBAL CONSTRUCTION & DEMOLITION WASTE RECYCLING MARKET, BY MATERIAL, 2019–2027
FIGURE 19.COLLECTION CONSTRUCTION & DEMOLITION WASTE RECYCLING MARKET REVENUE, FOR CONCRETE SEGMENT, BY COUNTRY, 2019–2027 (%)
FIGURE 20.COLLECTION CONSTRUCTION & DEMOLITION WASTE RECYCLING MARKET REVENUE, FOR BRICKS SEGMENT, BY COUNTRY, 2019–2027 (%)
FIGURE 21.COLLECTION CONSTRUCTION & DEMOLITION WASTE RECYCLING MARKET REVENUE, FOR METAL SEGMENT, BY COUNTRY, 2019–2027 (%)
FIGURE 22.COLLECTION CONSTRUCTION & DEMOLITION WASTE RECYCLING MARKET REVENUE, FOR WOOD SEGMENT, BY COUNTRY, 2019–2027 (%)
FIGURE 23.COLLECTION CONSTRUCTION & DEMOLITION WASTE RECYCLING MARKET REVENUE, FOR OTHERS SEGMENT, BY COUNTRY, 2019–2027 (%)
FIGURE 24.GLOBAL CONSTRUCTION & DEMOLITION WASTE RECYCLING MARKET, BY REGION, 2019–2027
FIGURE 25.U.S. CONSTRUCTION & DEMOLITION WASTE RECYCLING MARKET REVENUE, 2019–2027 ($MILLION)
FIGURE 26.CANADA CONSTRUCTION & DEMOLITION WASTE RECYCLING MARKET REVENUE, 2019–2027 ($MILLION)
FIGURE 27.MEXICO CONSTRUCTION & DEMOLITION WASTE RECYCLING MARKET REVENUE, 2019–2027 ($MILLION)
FIGURE 28.GERMANY CONSTRUCTION & DEMOLITION WASTE RECYCLING MARKET REVENUE, 2019–2027 ($MILLION)
FIGURE 29.FRANCE CONSTRUCTION & DEMOLITION WASTE RECYCLING MARKET REVENUE, 2019–2027 ($MILLION)
FIGURE 30.UK CONSTRUCTION & DEMOLITION WASTE RECYCLING MARKET REVENUE, 2019–2027 ($MILLION)
FIGURE 31.ITALY CONSTRUCTION & DEMOLITION WASTE RECYCLING MARKET REVENUE, 2019–2027 ($MILLION)
FIGURE 32.REST OF EUROPE CONSTRUCTION & DEMOLITION WASTE RECYCLING MARKET REVENUE, 2019–2027 ($MILLION)
FIGURE 33.CHINA CONSTRUCTION & DEMOLITION WASTE RECYCLING MARKET REVENUE, 2019–2027 ($MILLION)
FIGURE 34.JAPAN CONSTRUCTION & DEMOLITION WASTE RECYCLING MARKET REVENUE, 2019–2027 ($MILLION)
FIGURE 35.INDIA CONSTRUCTION & DEMOLITION WASTE RECYCLING MARKET REVENUE, 2019–2027 ($MILLION)
FIGURE 36.SOUTH KOREA CONSTRUCTION & DEMOLITION WASTE RECYCLING MARKET REVENUE, 2019–2027 ($MILLION)
FIGURE 37.REST OF ASIA-PACIFIC CONSTRUCTION & DEMOLITION WASTE RECYCLING MARKET REVENUE, 2019–2027 ($MILLION)
FIGURE 38.LATIN AMERICA CONSTRUCTION & DEMOLITION WASTE RECYCLING MARKET REVENUE, 2019–2027 ($MILLION)
FIGURE 39.MIDDLE EAST CONSTRUCTION & DEMOLITION WASTE RECYCLING MARKET REVENUE, 2019–2027 ($MILLION)
FIGURE 40.AFRICA CONSTRUCTION & DEMOLITION WASTE RECYCLING MARKET REVENUE, 2019–2027 ($MILLION)
FIGURE 41.MARKET PLAYER POSITIONING, 2019
FIGURE 42.TOP WINNING STRATEGIES, BY YEAR, 2017–2020
FIGURE 43.TOP WINNING STRATEGIES, BY DEVELOPMENT, 2017–2020 (%)
FIGURE 44.TOP WINNING STRATEGIES, BY COMPANY, 2017–2020
FIGURE 45.COMPANY SNAPSHOT
FIGURE 46.COMPANY SNAPSHOT
FIGURE 47.CLEAN HARBORS, INC.: NET SALES, 2017–2019 ($MILLION)
FIGURE 48.CLEAN HARBORS, INC.: REVENUE SHARE, BY SEGMENT, 2019 (%)
FIGURE 49.CLEAN HARBORS, INC.: REVENUE SHARE BY REGION, 2019 (%)
FIGURE 50.DAISEKI CO., LTD.: NET SALES, 2017–2019 ($MILLION)
FIGURE 51.FCC ENVIRONMENT: NET SALES, 2017–2019 ($MILLION)
FIGURE 52.FCC ENVIRONMENT: REVENUE SHARE, BY SEGMENT, 2019 (%)
FIGURE 53.FCC ENVIRONMENT: REVENUE SHARE BY REGION, 2019 (%)
FIGURE 54.RENEWI PLC: R&D EXPENDITURE, 2017–2019 ($MILLIONS)
FIGURE 55.RENEWI PLC: NET SALES, 2017–2019 ($MILLION)
FIGURE 56.RENEWI PLC: REVENUE SHARE, BY SEGMENT, 2019 (%)
FIGURE 57.REPUBLIC SERVICES, INC.: NET SALES, 2017–2019 ($MILLION)
FIGURE 58.REPUBLIC SERVICES, INC.: REVENUE SHARE, BY REGION, 2019 (%)
FIGURE 59.VEOLIA ENVIRONNEMENT: NET SALES, 2017–2019 ($MILLION)
FIGURE 60.VEOLIA ENVIRONNEMENT: REVENUE SHARE, BY SEGMENT, 2019 (%)
FIGURE 61.VEOLIA ENVIRONNEMENT: REVENUE SHARE, BY REGION, 2019 (%)
FIGURE 62.WASTE CONNECTION: NET SALES, 2017–2019 ($MILLION)
FIGURE 63.WASTE CONNECTION: REVENUE SHARE, BY SEGMENT, 2019 (%)
FIGURE 64.WASTE CONNECTION: REVENUE SHARE BY REGION, 2019 (%)
FIGURE 65.WASTE MANAGEMENT INC.: NET SALES, 2017–2019 ($MILLION)
FIGURE 66.WASTE MANAGEMENT INC.: REVENUE SHARE, BY SEGMENT, 2019 (%)
FIGURE 67.WASTE MANAGEMENT INC.: REVENUE SHARE, BY REGION, 2019 (%