FEATURED COMPANIES
Microsoft
Visteon Corporation
Volkswagen AG
Hyundai Motor
Global Automotive AR and VR Market
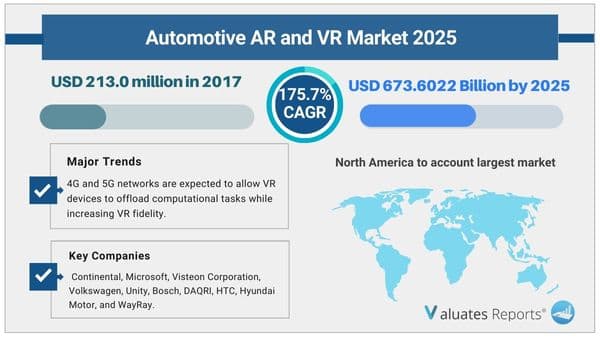
The global automotive AR and VR market was valued at USD 213.0 million in 2017 and is projected to reach USD 673.6022 Billion by 2025, registering a CAGR of 175.7% from 2018 to 2025. In 2017, North America accounted for the highest share in the global automotive AR and VR market.
The global automotive augmented reality and VR market encompasses AR and VR type and application segment of the automotive AR and VR market. The global automotive AR and VR market is a very dynamic market and is expected to witness growth during the forecast period. The development of new and diversified technologies creates opportunities within the automotive industry. The automotive AR and VR market is analyzed and estimated in accordance with the impacts of the drivers, restraints, and opportunities. The period studied in this report is from 2018 to 2025.
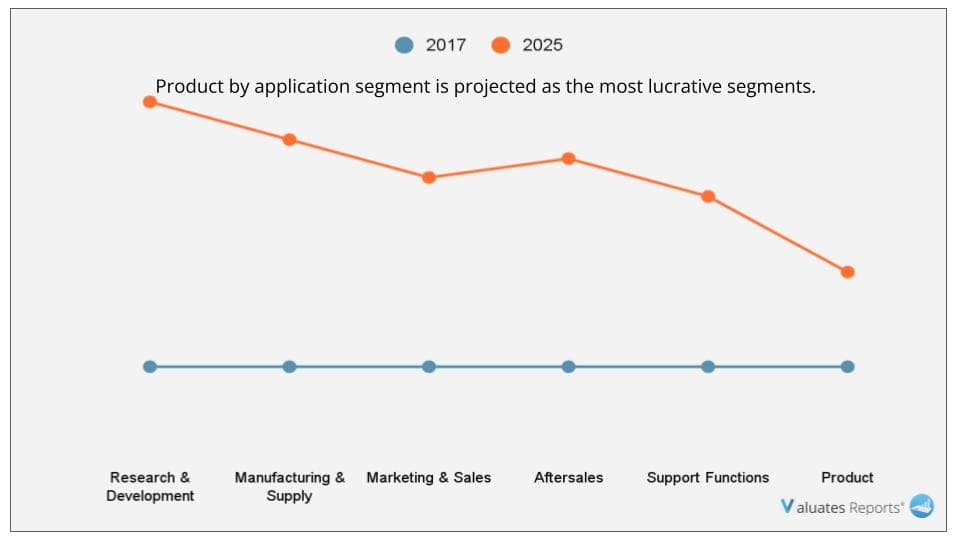
The market is segmented by type of automotive AR and VR used, which includes Augmented reality (AR) and virtual reality (VR). Also, based on application, the market is classified into research & development, manufacturing & supply, marketing & sales, aftersales, support functions, product. Based on the region, it is analyzed across North America, Europe, Asia-Pacific, and LAMEA.
augmented reality is a digital layer superimposed on the physical world. Augmented reality applications are developed on special 3D programs that enable developers to integrate contextual or digital content with the real world. Moreover, it integrates the real-life environment with virtual details that enhance the experience. This is typically achieved by looking at real-life environments through smart goggles and headsets, smartphone or tablet screens. Augmented reality in automotive is majorly used for the application that displays the features of pedestrians, navigations, and smart signaling on a windshield.
Virtual reality uses a head-mounted display of goggles for the creation of an interactive & completely digital environment that provides a fully enclosed synthetic experience, and visual feedback. In addition, virtual reality in automotive is a three-dimensional (3D) computer-generated environment, which takes the end-users to an artificial world.
The key players analyzed in the automotive AR and VR market include Continental, Microsoft, Visteon Corporation, Volkswagen, Unity, Bosch, DAQRI, HTC, Hyundai Motor, and WayRay.
Advent of connectivity technological advancements
The rise in penetration of Internet of Things (IoT) in automotive supports faster connectivity for more intuitive visualization and interaction. Also, many companies are developing smart AR glasses with a Qualcomm collaboration that features the multimode connectivity (4G, 5G), eye tracking cameras, and optics & projection technology within semitransparent display. There is an increase in the demand for 5G networks in automotive as it enables high speed data transfer with lower latency and improves traffic capacity & network efficiency. Moreover, these 4G and 5G networks are expected to enable VR devices to offload computational work besides increasing the fidelity of VR experiences. Thus, such application based technological advancements in automotive boost the growth of the automotive AR and VR market.
High need of augmented and virtual reality in automotive
In the past, augmented and virtual reality has gained huge popularity and adoption among various end-user industries, such as digital manufacturing, media & entertainment, education, healthcare, defense & security, and civil aviation.
Nowadays, end-user organizations are inclined toward deploying augmented and virtual reality based solutions in automotive field for design & assembly and repair & maintenance. Moreover, this technology helps assist designers in visualizing the body structure of a vehicle, as to improve efficiency, safety, and durability. Furthermore, safety at assembly line is increased by tracking human movement to decrease the risk of injury. In addition, augmented reality helps manufacturers with the overall design process. The AR and VR technology assists designers in visualizing the body structure of a vehicle to improve efficiency, safety, and durability. Many key players in the automotive industry implement the AR and VR systems in their vehicles. For instance, continentals has started offering AR-HUD unit that includes sensors, cameras, and GPS and supports all high-end features with the base of AR and VR. Thus, such high demand of AR and VR in automotive fuels the growth of the automotive AR and VR market.
Serious threats to the physical and emotional wellbeing of the end-users
People using virtual reality have faced eye strain, headaches, and in some cases, nausea. Various experts in AR and VR also said that it is due to the way VR affects the eye-brain connection. Furthermore, a certain percentage of users have experienced motion sickness, anxiety, and severe eyestrain after using VR headsets for a prolonged period. The AR and VR technology disconnects the users from the real environment. This results in retinal radiation, which may be a potential cause for eye cancer. Such drastic causes of AR and VR units if not addressed properly act as an inhibitor and affect the adoption rate of virtual reality or augmented reality technologies. Thus, health concerns restrain the growth of the automotive augmented reality and virtual reality market.
High Dependence on Internet Connectivity
There is an increase in the number of applications in automotive especially related to infotainment and cockpits control system. These applications do not run on slow internet connectivity. Moreover, indications of traffic, lane detection, and other features need an improved internet connection. In addition, underdeveloped countries, especially Africa, are unable to adopt augmented and virtual reality technology owing to a lack of infrastructure support for fast internet connection. Also, some countries such as Eritrea, Burundi, Chad, Somalia, and others, have low penetration of internet. Therefore, this high dependency on the internet hampers the growth of the automotive AR and VR market globally.
Formation of mixed reality (MR) from the integration of AR and VR
The formation of mixed reality (MR) from the integration of AR and VR offers immense growth opportunities to players in the automotive augmented reality and virtual reality market. Holographic projections and interactive virtual display garner increased focus in the automotive field. In addition, MR allows engineers to wear special headsets through which they can view the holographic image of the engine, and with various image and voice features can understand the engine in-depth and make changes accordingly. Such simulation-based leaning is expected to create an opportunity for the growth of the automotive AR and VR market in the future.
Development of the HUD system to enhance safety
Augmented and virtual reality technology is currently being used to supplement safety features in vehicles. Furthermore, in May 2017, Continental introduced a prototype AR-HUD system for assisting drivers that works by displaying actionable data and images on the vehicle's windshield. The AR and VR technology is used in automotive to support features such as turn-by-turn route navigation, safety distance monitoring, lane-departure warning (LDW), and adaptive cruise control (ACC). Moreover, in application, the driver can see blinking arrows when the system senses an upcoming turn during navigation with an interactive image. Thus, the innovations in the development of the HUD system to enhance safety in automotive applications boost the growth of the automotive AR and VR market.
KEY BENEFITS FOR AUTOMOTIVE AR AND VR MARKET:
- This study presents the analytical depiction of the global automotive AR and VR market along with the current trends and future estimations to depict the imminent investment pockets.
- The overall market potential is determined to understand the profitable trends to enable stakeholders gain a stronger foothold in the market.
- The report presents information related to key drivers, restraints, and opportunities with a detailed impact analysis.
- The current market is quantitatively analyzed from 2017 to 2025 to highlight the financial competency of the market.
- Porter’s five forces analysis illustrates the potency of the buyers and suppliers.
Automotive AR and VR Market Segmentation
By Type
- Augmented Reality (AR)
- Virtual Reality (VR)
By Application
- Research & Development
- Manufacturing & Supply
- Marketing & Sales
- Aftersales
- Support Functions
- Product
By Region
- North America
- U.S.
- Canada
- Mexico
- Europe
- UK
- Germany
- France
- Russia
- Rest of Europe
- Asia-Pacific
- China
- India
- Japan
- Australia
- Rest of Asia-Pacific
- LAMEA
- Latin America
- Middle East
- Africa
Scope of Automotive AR and VR Market Report
|
Report Metric
|
Details
|
|
Report Name
|
Automotive AR and VR Market
|
|
Market size value in 2017
|
USD 213.0 million
|
|
Revenue forecast in 2025
|
USD 673.6022 Billion
|
|
Growth Rate
|
175.7%
|
|
Base year considered
|
2017
|
|
Forecast Period
|
2017 to 2025
|
|
By Type
|
Augmented Reality (AR), Virtual Reality (VR)
|
|
By Application
|
Research & Development, Manufacturing & Supply, Marketing & Sales, Aftersales, Support Functions, Product
|
|
Report Coverage
|
Revenue & volume forecast, company share, competitive landscape, growth factors, and trends
|
|
Segments Covered
|
By Type, Application, and Region
|
|
Geographic Regions Covered
|
North America, Europe, Asia Pacific, Latin America, Middle East & Africa
|
Frequently Asked Questions About This Report
1. Do you provide chapter-wise report data?
Ans. Yes, we do provide the option to buy chapters in a report. We also can customize the report based on your specific requirements.
2. How big is the Automotive AR and VR Market?
Ans. Due to the COVID-19 pandemic, The global automotive AR and VR market was valued at USD 213.0 million in 2017 and is projected to reach USD 673.6022 Billion by 2025, registering a CAGR of 175.7% from 2018 to 2025.
3. Who are the key players available in the Automotive AR and VR Industry?
Ans. Some of the Major companies are Continental, Microsoft, Visteon Corporation, Volkswagen, Unity, Bosch, DAQRI, HTC, Hyundai Motor, and WayRay.
4. Does the report provides covid-19 impact analysis?
Ans. Yes, the report includes a COVID-19 impact analysis. Also, it is further extended into every individual segment of the report.
TABLE OF CONTENT:
CHAPTER 1: INTRODUCTION
1.1. Report description
1.2. Key benefits for stakeholders
1.3. Key market segments
1.4. Research methodology
1.4.1. Primary research
1.4.2. Secondary research
1.4.3. Analyst tools and models
CHAPTER 2: EXECUTIVE SUMMARY
2.1. CXO perspective
2.2. Automotive use case grid analysis for AR and VR
2.3. Benefits of AR and VR in automotive sector
CHAPTER 3: MARKET OVERVIEW
3.1. Market definition and scope
3.2. Key findings
3.2.1. Top impacting factors
3.2.2. Top investment pockets
3.2.3. Top winning strategies
3.3. Porters five forces analysis
3.4. Key player positioning (2017)
3.5. Market dynamics
3.5.1. Drivers
3.5.1.1. Advent of connectivity technological advancements
3.5.1.2. High need of augmented and virtual reality in automotive
3.5.1.3. Cost-efficient benefits of augmented and virtual reality based solutions
3.5.2. Restraints
3.5.2.1. Serious threats to the physical and emotional wellbeing of the end-users
3.5.2.2. High Dependence on Internet Connectivity
3.5.3. Opportunities
3.5.3.1. Formation of mixed reality (MR) from integration of AR and VR
3.5.3.2. Development of HUD system to enhance safety
CHAPTER 4: AUTOMOTIVE AR AND VR MARKET, BY TYPE
4.1. Overview
4.2. AUGMENTED REALITY
4.2.1. Key market trends, growth factors and opportunities
4.2.2. Market size and forecast, by region
4.2.3. Market analysis by country
4.3. VIRTUAL REALITY
4.3.1. Key market trends, growth factors, and opportunities
4.3.2. Market size and forecast, by region
4.3.3. Market analysis by country
CHAPTER 5: AUTOMOTIVE AR AND VR MARKET, BY APPLICATION
5.1. Overview
5.2. Research & Development
5.2.1. Key market trends, growth factors and opportunities
5.2.2. Market size and forecast, by region
5.2.3. Market analysis by country
5.3. Manufacturing & Supply
5.3.1. Key market trends, growth factors, and opportunities
5.3.2. Market size and forecast, by region
5.3.3. Market analysis by country
5.4. Marketing & sales
5.4.1. Key market trends, growth factors, and opportunities
5.4.2. Market size and forecast, by region
5.4.3. Market analysis by country
5.5. Aftersales
5.5.1. Key market trends, growth factors, and opportunities
5.5.2. Market size and forecast, by region
5.5.3. Market analysis by country
5.6. Support Functions / Training
5.6.1. Key market trends, growth factors, and opportunities
5.6.2. Market size and forecast, by region
5.6.3. Market analysis by country
5.7. Product
5.7.1. Key market trends, growth factors, and opportunities
5.7.2. Market size and forecast, by region
5.7.3. Market analysis by country
CHAPTER 6: AUTOMOTIVE AR AND VR MARKET, BY REGION
6.1. Overview
6.2. North America
6.2.1. Key market trends, growth factors, and opportunities
6.2.2. Market size and forecast, by Type
6.2.3. Market size and forecast, by application
6.2.4. Market analysis by country
6.2.4.1. U.S.
6.2.4.1.1. Market size and forecast, by Type
6.2.4.1.2. Market size and forecast, by application
6.2.4.2. Canada
6.2.4.2.1. Market size and forecast, by Type
6.2.4.2.2. Market size and forecast, by application
6.2.4.3. Mexico
6.2.4.3.1. Market size and forecast, by TYPE
6.2.4.3.2. Market size and forecast, by application
6.3. Europe
6.3.1. Key market trends, growth factors, and opportunities
6.3.2. Market size and forecast, by type
6.3.3. Market size and forecast, by application
6.3.4. Market analysis by country
6.3.4.1. U.K.
6.3.4.1.1. Market size and forecast, by type
6.3.4.1.2. Market size and forecast, by application
6.3.4.2. Germany
6.3.4.2.1. Market size and forecast, by TYPE
6.3.4.2.2. Market size and forecast, by application
6.3.4.3. France
6.3.4.3.1. Market size and forecast, by TYPE
6.3.4.3.2. Market size and forecast, by application
6.3.4.4. Russia
6.3.4.4.1. Market size and forecast, by TYPE
6.3.4.4.2. Market size and forecast, by application
6.3.4.5. Rest of Europe
6.3.4.5.1. Market size and forecast, by TYPE
6.3.4.5.2. Market size and forecast, by application
6.4. Asia-Pacific
6.4.1. Key market trends, growth factors, and opportunities
6.4.2. Market size and forecast, by TYPE
6.4.3. Market size and forecast, by application
6.4.4. Market analysis by country
6.4.4.1. China
6.4.4.1.1. Market size and forecast, by TYPE
6.4.4.1.2. Market size and forecast, by application
6.4.4.2. Japan
6.4.4.2.1. Market size and forecast, by TYPE
6.4.4.2.2. Market size and forecast, by application
6.4.4.3. India
6.4.4.3.1. Market size and forecast, by TYPE
6.4.4.3.2. Market size and forecast, by application
6.4.4.4. Australia
6.4.4.4.1. Market size and forecast, by TYPE
6.4.4.4.2. Market size and forecast, by application
6.4.4.5. Rest of Asia-Pacific
6.4.4.5.1. Market size and forecast, by TYPE
6.4.4.5.2. Market size and forecast, by application
6.5. LAMEA
6.5.1. Key market trends, growth factors, and opportunities
6.5.2. Market size and forecast, by TYPE
6.5.3. Market size and forecast, by application
6.5.4. Market analysis by country
6.5.4.1. Latin America
6.5.4.1.1. Market size and forecast, by TYPE
6.5.4.1.2. Market size and forecast, by application
6.5.4.2. Middle East
6.5.4.2.1. Market size and forecast, by TYPE
6.5.4.2.2. Market size and forecast, by application
6.5.4.3. Africa
6.5.4.3.1. Market size and forecast, by TYPE
6.5.4.3.2. Market size and forecast, by application
CHAPTER 7: COMPANY PROFILES
7.1. Continental AG
7.1.1. Company overview
7.1.2. Company snapshot
7.1.3. Operating business segments
7.1.4. Product portfolio
7.1.5. Business performance
7.1.6. Key strategic moves and developments
7.2. DAQRI
7.2.1. Company overview
7.2.2. Company snapshot
7.2.3. Product portfolio
7.2.4. Key strategic moves and developments
7.3. HTC Corporation
7.3.1. Company overview
7.3.2. Company snapshot
7.3.3. Product portfolio
7.3.4. Business performance
7.3.5. Key strategic moves and developments
7.4. Hyundai Motor Group
7.4.1. Company overview
7.4.2. Company snapshot
7.4.3. Operating business segments
7.4.4. Product portfolio
7.4.5. Business performance
7.4.6. Key strategic moves and developments
7.5. Microsoft Corporation
7.5.1. Company overview
7.5.2. Company snapshot
7.5.3. Operating business segments
7.5.4. Product portfolio
7.5.5. Business performance
7.5.6. Key strategic moves and developments
7.6. Robert Bosch GmbH
7.6.1. Company overview
7.6.2. Company snapshot
7.6.3. Operating business segments
7.6.4. Product portfolio
7.6.5. Business performance
7.6.6. Key strategic moves and developments
7.7. Unity Technologies ApS
7.7.1. Company overview
7.7.2. Company snapshot
7.7.3. Product portfolio
7.7.4. Key strategic moves and developments
7.8. Visteon Corporation
7.8.1. Company overview
7.8.2. Company snapshot
7.8.3. Operating business segments
7.8.4. Product portfolio
7.8.5. Business performance
7.8.6. Key strategic moves and developments
7.9. Volkswagen AG
7.9.1. Company overview
7.9.2. Company snapshot
7.9.3. Operating business segments
7.9.4. Product portfolio
7.9.5. Business performance
7.9.6. Key strategic moves and developments
7.10. WayRay AG
7.10.1. Company overview
7.10.2. Company snapshot
7.10.3. Product portfolio
7.10.4. Key strategic moves and development
FEATURED COMPANIES
Microsoft
Visteon Corporation
Volkswagen AG
Hyundai Motor
LIST OF TABLES & FIGURES:
TABLE 01. GLOBAL AUTOMOTIVE AR AND VR MARKET, BY TYPE, 2017-2025($MILLION)
TABLE 02. AUTOMOTIVE AR AND VR MARKET REVENUE FOR AUGMENTED REALITY, BY REGION 2017-2025 ($MILLION)
TABLE 03. AUTOMOTIVE AR AND VR MARKET REVENUE FOR VIRTUAL REALITY, BY REGION 2017-2025 ($MILLION)
TABLE 04. GLOBAL AUTOMOTIVE AR AND VR MARKET, BY APPLICATION, 2017-2025($MILLION)
TABLE 05. AUTOMOTIVE AR AND VR MARKET REVENUE FOR RESEARCH & DEVELOPMENT, BY REGION 2017-2025 ($MILLION)
TABLE 06. AUTOMOTIVE AR AND VR MARKET REVENUE FOR NLP, BY REGION 2017-2025 ($MILLION)
TABLE 07. AUTOMOTIVE AR AND VR MARKET REVENUE FOR NLP, BY REGION 2017-2025 ($MILLION)
TABLE 08. AUTOMOTIVE AR AND VR MARKET REVENUE FOR NLP, BY REGION 2017-2025 ($MILLION)
TABLE 09. AUTOMOTIVE AR AND VR MARKET REVENUE FOR NLP, BY REGION 2017-2025 ($MILLION)
TABLE 10. AUTOMOTIVE AR AND VR MARKET REVENUE FOR NLP, BY REGION 2017-2025 ($MILLION)
TABLE 11. NORTH AMERICAN AUTOMOTIVE AR AND VR MARKET, BY TYPE, 20172025 ($MILLION)
TABLE 12. NORTH AMERICAN AUTOMOTIVE AR AND VR MARKET, BY APPLICATION, 20172025 ($MILLION)
TABLE 13. U. S. AUTOMOTIVE AR AND VR MARKET, BY TYPE, 20172025 ($MILLION)
TABLE 14. U. S. AUTOMOTIVE AR AND VR MARKET, BY APPLICATION, 20172025 ($MILLION)
TABLE 15. CANADA AUTOMOTIVE AR AND VR MARKET, BY TYPE, 20172025 ($MILLION)
TABLE 16. CANADA AUTOMOTIVE AR AND VR MARKET, BY APPLICATION, 20172025 ($MILLION)
TABLE 17. MEXICO AUTOMOTIVE AR AND VR MARKET, BY TYPE, 20172025 ($MILLION)
TABLE 18. MEXICO AUTOMOTIVE AR AND VR MARKET, BY APPLICATION, 20172025 ($MILLION)
TABLE 19. EUROPEAN AUTOMOTIVE AR AND VR MARKET, BY TYPE, 20172025 ($MILLION)
TABLE 20. EUROPEAN AUTOMOTIVE AR AND VR MARKET, BY APPLICATION, 20172025 ($MILLION)
TABLE 21. U.K. AUTOMOTIVE AR AND VR MARKET, BY TYPE, 20172025 ($MILLION)
TABLE 22. U.K. AUTOMOTIVE AR AND VR MARKET, BY APPLICATION, 20172025 ($MILLION)
TABLE 23. GERMANY AUTOMOTIVE AR AND VR MARKET, BY TYPE, 20172025 ($MILLION)
TABLE 24. GERMANY AUTOMOTIVE AR AND VR MARKET, BY APPLICATION, 20172025 ($MILLION)
TABLE 25. FRANCE AUTOMOTIVE AR AND VR MARKET, BY TYPE, 20172025 ($MILLION)
TABLE 26. FRANCE AUTOMOTIVE AR AND VR MARKET, BY APPLICATION, 20172025 ($MILLION)
TABLE 27. RUSSIA AUTOMOTIVE AR AND VR MARKET, BY TYPE, 20172025 ($MILLION)
TABLE 28. RUSSIA AUTOMOTIVE AR AND VR MARKET, BY APPLICATION, 20172025 ($MILLION)
TABLE 29. REST OF EUROPE AUTOMOTIVE AR AND VR MARKET, BY TYPE, 20172025 ($MILLION)
TABLE 30. REST OF EUROPE AUTOMOTIVE AR AND VR MARKET, BY APPLICATION, 20172025 ($MILLION)
TABLE 31. ASIA-PACIFIC AUTOMOTIVE AR AND VR MARKET, BY TYPE, 20172025 ($MILLION)
TABLE 32. ASIA-PACIFIC AUTOMOTIVE AR AND VR MARKET, BY APPLICATION, 20172025 ($MILLION)
TABLE 33. CHINA AUTOMOTIVE AR AND VR MARKET, BY TYPE, 20172025 ($MILLION)
TABLE 34. CHINA AUTOMOTIVE AR AND VR MARKET, BY APPLICATION, 20172025 ($MILLION)
TABLE 35. JAPAN AUTOMOTIVE AR AND VR MARKET, BY TYPE, 20172025 ($MILLION)
TABLE 36. JAPAN AUTOMOTIVE AR AND VR MARKET, BY APPLICATION, 20172025 ($MILLION)
TABLE 37. INDIA AUTOMOTIVE AR AND VR MARKET, BY TYPE, 20172025 ($MILLION)
TABLE 38. INDIA AUTOMOTIVE AR AND VR MARKET, BY APPLICATION, 20172025 ($MILLION)
TABLE 39. AUSTRALIA AUTOMOTIVE AR AND VR MARKET, BY TYPE, 20172025 ($MILLION)
TABLE 40. AUSTRALIA AUTOMOTIVE AR AND VR MARKET, BY APPLICATION, 20172025 ($MILLION)
TABLE 41. REST OF ASIA-PACIFIC AUTOMOTIVE AR AND VR MARKET, BY TYPE, 20172025 ($MILLION)
TABLE 42. REST OF ASIA-PACIFIC AUTOMOTIVE AR AND VR MARKET, BY APPLICATION, 20172025 ($MILLION)
TABLE 43. LAMEA AUTOMOTIVE AR AND VR MARKET, BY TYPE, 20172025 ($MILLION)
TABLE 44. LAMEA AUTOMOTIVE AR AND VR MARKET, BY APPLICATION, 20172025 ($MILLION)
TABLE 45. LATIN AMERICA AUTOMOTIVE AR AND VR MARKET, BY TYPE, 20172025 ($MILLION)
TABLE 46. LATIN AMERICA AUTOMOTIVE AR AND VR MARKET, BY APPLICATION, 20172025 ($MILLION)
TABLE 47. MIDDLE EAST AUTOMOTIVE AR AND VR MARKET, BY TYPE, 20172025 ($MILLION)
TABLE 48. MIDDLE EAST AUTOMOTIVE AR AND VR MARKET, BY APPLICATION, 20172025 ($MILLION)
TABLE 49. AFRICA AUTOMOTIVE AR AND VR MARKET, BY TYPE, 20172025 ($MILLION)
TABLE 50. AFRICA AUTOMOTIVE AR AND VR MARKET, BY APPLICATION, 20172025 ($MILLION)
TABLE 51. CONTINENTAL AG: COMPANY SNAPSHOT
TABLE 52. CONTINENTAL AG: OPERATING SEGMENTS
TABLE 53. CONTINENTAL AG: PRODUCT PORTFOLIO
TABLE 54. DAQRI: COMPANY SNAPSHOT
TABLE 55. DAQRI: PRODUCT PORTFOLIO
TABLE 56. HTC CORPORATION: COMPANY SNAPSHOT
TABLE 57. HTC CORPORATION: PRODUCT PORTFOLIO
TABLE 58. HYUNDAI MOTOR GROUP.: COMPANY SNAPSHOT
TABLE 59. HYUNDAI MOTOR GROUP.: OPERATING SEGMENTS
TABLE 60. HYUNDAI: PRODUCT PORTFOLIO
TABLE 61. MICROSOFT CORPORATION: COMPANY SNAPSHOT
TABLE 62. MICROSOFT CORPORATION: OPERATING SEGMENTS
TABLE 63. MICROSOFT CORPORATION: PRODUCT PORTFOLIO
TABLE 64. ROBERT BOSCH GMBH: PRODUCT PORTFOLIO
TABLE 65. UNITY TECHNOLOGIES APS: COMPANY SNAPSHOT
TABLE 66. UNITY TECHNOLOGIES APS: PRODUCT PORTFOLIO
TABLE 67. VISTEON CORPORATION: COMPANY SNAPSHOT
TABLE 68. VISTEON CORPORATION: OPERATING SEGMENTS
TABLE 69. VISTEON CORPORATION: PRODUCT PORTFOLIO
TABLE 70. VOLKSWAGEN AG: COMPANY SNAPSHOT
TABLE 71. VOLKSWAGEN AG: OPERATING SEGMENTS
TABLE 72. VOLKSWAGEN AG PRODUCT PORTFOLIO
TABLE 73. WAYRAY AG: COMPANY SNAPSHOT
TABLE 74. WAYRAY AG: PRODUCT PORTFOLIO LIST OF FIGURES
FIGURE 01. KEY MARKET SEGMENTS
FIGURE 02. EXECUTIVE SUMMARY
FIGURE 03. EXECUTIVE SUMMARY
FIGURE 04. TOP IMPACTING FACTORS
FIGURE 05. TOP INVESTMENT POCKETS
FIGURE 06. TOP WINNING STRATEGIES, BY YEAR, 20162019*
FIGURE 07. TOP WINNING STRATEGIES, BY YEAR, 20162019*
FIGURE 08. TOP WINNING STRATEGIES, BY COMPANY, 20162019*
FIGURE 09. MODERATE-TO-HIGH BARGAINING POWER OF SUPPLIERS
FIGURE 10. HIGH-TO-HIGH THREAT OF NEW ENTRANTS
FIGURE 11. MODERATE TO HIGH THREAT OF SUBSTITUTES
FIGURE 12. MODERATE-TO_HIGH INTENSITY OF RIVALRY
FIGURE 13. MODERATE-TO-HIGH BARGAINING POWER OF BUYERS
FIGURE 14. KEYP[LAYER POSITIONING (2017)
FIGURE 15. GLOBAL AUTOMOTIVE AR AND VR MARKET SHARE, BY TYPE, 20172025 (%)
FIGURE 16. COMPARATIVE SHARE ANALYSIS OF AUTOMOTIVE AR AND VR MARKET FOR AUGMENTED REALITY, BY COUNTRY, 2017 & 2025 (%)
FIGURE 17. COMPARATIVE SHARE ANALYSIS OF AUTOMOTIVE AR AND VR MARKET FOR VIRTUAL REALITY, BY COUNTRY, 2017 & 2025 (%)
FIGURE 18. GLOBAL AUTOMOTIVE AR AND VR MARKET SHARE, BY APPLICATION, 20172025 (%)
FIGURE 19. COMPARATIVE SHARE ANALYSIS OF AUTOMOTIVE AR AND VR MARKET FOR RESEARCH & DEVELOPMENT, BY COUNTRY, 2017 & 2025 (%)
FIGURE 20. COMPARATIVE SHARE ANALYSIS OF AUTOMOTIVE AR AND VR MARKET FOR NLP, BY COUNTRY, 2017 & 2025 (%)
FIGURE 21. COMPARATIVE SHARE ANALYSIS OF AUTOMOTIVE AR AND VR MARKET FOR NLP, BY COUNTRY, 2017 & 2025 (%)
FIGURE 22. COMPARATIVE SHARE ANALYSIS OF AUTOMOTIVE AR AND VR MARKET FOR NLP, BY COUNTRY, 2017 & 2025 (%)
FIGURE 23. COMPARATIVE SHARE ANALYSIS OF AUTOMOTIVE AR AND VR MARKET FOR NLP, BY COUNTRY, 2017 & 2025 (%)
FIGURE 24. COMPARATIVE SHARE ANALYSIS OF AUTOMOTIVE AR AND VR MARKET FOR NLP, BY COUNTRY, 2017 & 2025 (%)
FIGURE 25. AUTOMOTIVE AR AND VR MARKET, BY REGION, 2017-2025 (%)
FIGURE 26. COMPARATIVE SHARE ANALYSIS OF AUTOMOTIVE AR AND VR MARKET, BY COUNTRY, 20172025 (%)
FIGURE 27. U. S. AUTOMOTIVE AR AND VR MARKET, 20172025 ($MILLION)
FIGURE 28. CANADA AUTOMOTIVE AR AND VR MARKET, 20172025 ($MILLION)
FIGURE 29. MEXICO AUTOMOTIVE AR AND VR MARKET, 20172025 ($MILLION)
FIGURE 30. COMPARATIVE SHARE ANALYSIS OF AUTOMOTIVE AR AND VR MARKET, BY COUNTRY, 20172025 (%)
FIGURE 31. U.K. AUTOMOTIVE AR AND VR MARKET, 20172025 ($MILLION)
FIGURE 32. GERMANY AUTOMOTIVE AR AND VR MARKET, 20172025 ($MILLION)
FIGURE 33. FRANCE AUTOMOTIVE AR AND VR MARKET, 20172025 ($MILLION)
FIGURE 34. RUSSIA AUTOMOTIVE AR AND VR MARKET, 20172025 ($MILLION)
FIGURE 35. REST OF EUROPE AUTOMOTIVE AR AND VR MARKET, 20172025 ($MILLION)
FIGURE 36. COMPARATIVE SHARE ANALYSIS OF AUTOMOTIVE AR AND VR MARKET, BY COUNTRY, 20172025 (%)
FIGURE 37. CHINA AUTOMOTIVE AR AND VR MARKET, 20172025 ($MILLION)
FIGURE 38. JAPAN AUTOMOTIVE AR AND VR MARKET, 20172025 ($MILLION)
FIGURE 39. INDIA AUTOMOTIVE AR AND VR MARKET, 20172025 ($MILLION)
FIGURE 40. AUSTRALIA AUTOMOTIVE AR AND VR MARKET, 20172025 ($MILLION)
FIGURE 41. REST OF ASIA-PACIFIC AUTOMOTIVE AR AND VR MARKET, 20172025 ($MILLION)
FIGURE 42. COMPARATIVE SHARE ANALYSIS OF AUTOMOTIVE AR AND VR MARKET, BY COUNTRY, 20172025 (%)
FIGURE 43. LATIN AMERICA AUTOMOTIVE AR AND VR MARKET, 20172025 ($MILLION)
FIGURE 44. MIDDLE EAST AUTOMOTIVE AR AND VR MARKET, 20172025 ($MILLION)
FIGURE 45. AFRICA AUTOMOTIVE AR AND VR MARKET, 20172025 ($MILLION)
FIGURE 46. CONTINENTAL AG: REVENUE, 20152017 ($MILLION)
FIGURE 47. CONTINENTAL AG: REVENUE SHARE BY SEGMENT, 2017 (%)
FIGURE 48. CONTINENTAL AG: REVENUE SHARE BY REGION, 2017 (%)
FIGURE 49. HTC CORPORATION: REVENUE, 20152017 ($MILLION)
FIGURE 50. HTC CORPORATION: REVENUE SHARE BY GEOGRAPHY, 2017 (%)
FIGURE 51. HYUNDAI: REVENUE, 20152017 ($MILLION)
FIGURE 52. HYUNDAI MOTOR GROUP. REVENUE SHARE BY SEGMENT, 2017 (%)
FIGURE 53. HYUNDAI MOTOR GROUP. : REVENUE SHARE BY GEOGRAPHY, 2017 (%)
FIGURE 54. MICROSOFT CORPORATION: REVENUE, 20162018 ($MILLION)
FIGURE 55. MICROSOFT CORPORATION: REVENUE SHARE BY SEGMENT, 2018 (%)
FIGURE 56. MICROSOFT CORPORATION: REVENUE SHARE BY GEOGRAPHY, 2018 (%)
FIGURE 57. ROBERT BOSCH GMBH: REVENUE, 20152017 ($MILLION)
FIGURE 58. ROBERT BOSCH GMBH: REVENUE BY SEGMENT, 2017 (%)
FIGURE 59. ROBERT BOSCH GMBH: REVENUE SHARE BY REGION, 2017 (%)
FIGURE 60. VISTEON CORPORATION: REVENUE, 20152017 ($MILLION)
FIGURE 61. VISTEON CORPORATION: REVENUE SHARE BY GEOGRAPHY, 2017 (%)
FIGURE 62. VOLKSWAGEN AG: REVENUE, 20152017 ($MILLION)
FIGURE 63. VOLKSWAGEN AG: REVENUE SHARE BY SEGMENT, 2017 (%)
FIGURE 64. VOLKSWAGEN AG: REVENUE SHARE BY GEOGRAPHY, 2017 (%

