
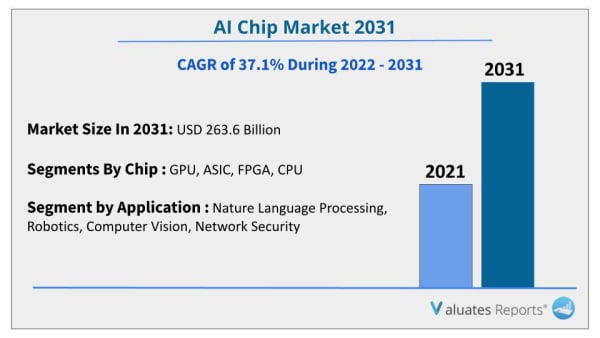
The global artificial intelligence chip market was valued at $11.2 billion in 2021 and is projected to reach $263.6 billion by 2031, growing at a CAGR of 37.1% from 2022 to 2031.
According to Himanshu Jangra Lead Analyst, Semiconductor and Electronics, at Allied Market Research, the Artificial intelligence chip Market is expected to showcase remarkable growth during the forecast period of 2022-2031.
The report contains a thorough examination of the market size, Artificial intelligence chip market trends, key market players, sales analysis, major driving factors, and key investment pockets. The report on the global artificial intelligence chip market provides an overview of the market as well as market definition and scope. The ongoing technological advancements and surge in demand for artificial intelligence processors and artificial intelligence brain chip solutions have an impact on market growth. Furthermore, the report provides a quantitative and qualitative analysis of the artificial intelligence chip market opportunity, as well as a breakdown of the pain points, value chain analysis, and key regulations.
Artificial intelligence (AI) chips are specialized silicon chips, which incorporate AI technology and are used for machine learning. AI helps in eliminating or minimizing the risk to human life in many industry verticals. The need for more efficient systems for solving mathematical and computational problems has become crucial, as the volume of data has increased. Thus, the majority of the key players in the IT industry focus on developing AI chips and applications.
Furthermore, the emergence of quantum computing and the surge in the implementation of AI chips in robotics drive the growth of the global AI chip market considerably. In addition, the emergence of autonomous robotics—robots that develop and control themselves autonomously—is anticipated to provide potential growth opportunities for the market. However, the dearth of skilled workforce is one of the major restraints of the market. Most of the tasks such as testing, bug fixing, cloud implementation, and others are taken over by AI chips; however, the delivery of such tasks lacks essential skill sets, which is acting as a significant restrain for the market in the coming years.
The artificial intelligence chip market size is segmented into Chip Type, Processing Type, Technology, Application, and Industry Vertical.
The artificial intelligence chip market growth is segmented based on chip type, processing type, technology, application, industry vertical, and region. Based on chip type, the market is categorized into GPU, ASIC, FPGA, CPU, and others. In 2021, the CPU segment dominated the market, in terms of revenue, and is expected to follow the same trend during the forecast period.
Based on processing type, it is categorized into edge and cloud. The edge segment dominated the artificial intelligence chip industry, in terms of revenue, and cloud is expected to follow the same trend during the forecast period.
Based on technology, the market is categorized into system-on-chip, system-in-package, multi-chip module, and others. The system-on-chip segment acquired a major share of the market in 2021.
The applications analyzed in the study are natural language processing (NLP), robotics, computer vision, network security, and others. In 2019, the natural language processing (NLP) segment dominated the artificial intelligence chip industry, in terms of revenue, and is expected to follow the same trend during the forecast period.
The industry verticals considered in the study include media & advertising, BFSI, IT & telecom, retail, healthcare, automotive & transportation, and others. The BFSI segment dominated the market, in terms of revenue, and is expected to follow the same trend during the forecast period.
Region-wise, the artificial intelligence chip market trends are analyzed across North America (the U.S., Canada, and Mexico), Europe (UK, Germany, France, Russia, and the rest of Europe), Asia-Pacific (China, Japan, India, Australia, and the rest of the Asia-Pacific), and LAMEA (Latin America, the Middle East, and Africa). North America, specifically U.S., remains a significant participant in the global artificial intelligence chip industry. Major organizations and government institutions in the country are intensely putting resources into the technology to develop and deploy advanced technology solutions in the automotive & transportation, healthcare, and BFSI applications during the forecast period.
Country-wise, the U.S. acquired a prime share in the artificial intelligence chip market in the North American region and is expected to grow at a significant CAGR during the forecast period of 2021-2031. The U.S., holds a dominant position in the artificial intelligence chip market, owing to the rise in investment by prime vendors to boost the smart artificial intelligence chip solutions for consumer electronics and IT and telecom applications.
In Europe, the UK, dominated the artificial intelligence chip market, in terms of revenue, in 2021 and is expected to follow the same trend during the forecast period. However, Germany is expected to emerge as the fastest-growing country in Europe's artificial intelligence chip with a notable CAGR, due to advancement in the healthcare industry which drives the usage of artificial intelligence chips in the country and thus creates lucrative growth opportunities for the artificial intelligence chip market in Germany.
In Asia-Pacific, China holds a major share in the artificial intelligence chip market, owing to the presence of prime players paired with the availability of advanced manufacturing infrastructure solutions in the country. Further, Australia is expected to emerge as a significant market for the artificial intelligence chip industry, owing to a significant rise in investment by prime players and government institutions in semiconductor research and chip startup development, to boost smart infrastructure across industrial and manufacturing sectors.
By LAMEA region, the Latin American country garner significant market share in 2021 due to the adoption of new technologies, digital transformation and connectivity are reshaping the future of healthcare and the consumer electronics industry in Latin America. Moreover, the Middle East region is expected to grow at a significant CAGR from 2022 to 2031, owing to shifts in artificial intelligence, industry 4.0, and smart technological changes in recent years, which is expected to reshape the growth of the artificial intelligence chip market in the Middle East.
The significant factors impacting the growth of the global artificial intelligence chip market include an increase in demand for smart homes & smart cities paired with the rise in investment in AI startups. Further, the emergence of quantum computing is driving the market for artificial intelligence solutions in the coming years. However, the death of skilled workers acts as the major barrier to early adoption; thereby, hampering the growth of the market. In contrast, the increase in the adoption of AI chips in developing regions and the development of smarter robots is offering significant growth opportunities for the artificial intelligence chip market forecast.
The semiconductor industry globally has been impacted by the spread of Covid-19 and improvements are expected to be completed in the upcoming years with more efficiency in order to make up for lost opportunities during lockdowns.
The global artificial intelligence chip market outlook is highly competitive, owing to the strong presence of existing vendors. Vendors of the artificial intelligence chip market with extensive technical and financial resources are expected to gain a competitive advantage over their competitors because they can cater to market demands. The competitive environment in this market is expected to increase as technological innovations, product extensions, and different strategies adopted by key vendors increase.
NVIDIA Corporation, Advanced Micro Devices Inc. (Xilinx Inc.), Qualcomm Technologies Inc., NXP Semiconductors, and Intell Corporation are the top 5 companies holding a prime share in the artificial intelligence chip market. Top market players have adopted various strategies, such as product launches, contracts, and others to expand their foothold in the artificial intelligence chip market share.
In September 2022, NVIDIA unveiled a new type of graphics chip that uses enhanced artificial intelligence to create more realistic images in games.
In October 2022, Oracle and Nvidia extended the collaboration to help speed customer adoption of artificial intelligence (AI) services. As part of the deal, Oracle Cloud Infrastructure (OCI), which is Oracle's cloud service, beef up the infrastructure with tens of thousands of Nvidia GPUs, both the Ampere A100 currently on the market and the Hopper H100. Oracle also added Nvidia's AI software stack that supports AI training and deep learning.
In September 2022, AMD introduced the RyzenTM. Embedded V3000 Series processors, adding the high-performance “Zen 3” core to the V-Series portfolio to deliver reliable, scalable processing performance for a wide range of storage and networking system applications. AMD Ryzen Embedded V3000 Series processors delivered the performance and low-power options required for some of the most demanding 24x7 operating environments and workloads.
In August 2022, Qualcomm Technologies, Inc. announced that its Snapdragon 8+ Gen 1 Platform powered Samsung Electronics Co., Ltd.'s cutting-edge foldable smartphones. The Samsung Galaxy Z Fold4 and Galaxy Z Flip4.
In July 2022, Mahindra & Mahindra Ltd. announced work with Visteon Corporation and brought transformative in-vehicle experiences to the Scorpio-N, utilizing the 3rd Generation SnapdragonR. Cockpit Platforms from Qualcomm Technologies, Inc. The Scorpio-N offers a cutting-edge driving and ownership experience provided by Mahindra's connected artificial intelligence (AI) technology, which utilizes Visteon's SmartCoreTM. cockpit domain controller technology based on the Snapdragon Cockpit Platforms.
In April 2021, Avnet's development kit deployed autonomous artificial intelligence (AI) capabilities to embedded applications, thereby reducing the dependency on cloud connectivity or processing. The Avnet Edge AI Development Kit featured Avnet Embedded's robust SMARC Computer-on-module (COM), based on NXP's i.MX 8M Plus applications processor, combined with a production-ready SimpleFlex Carrier and a long-term available 10.1 touch display, provides a cost-effective, high-performance computing solution for machine learning (ML) edge applications.
In August 2022, Intel's collaborated with Aible a cloud-based solution provider to leverage artificial intelligence and delivered rapid and measurable business impact. This deep collaboration includes engineering optimizations and an innovative benchmarking program, enhancing Aible's ability to deliver rapid results to its enterprise customers.
In February 2022, Intel launched XeonR., which is a new dual-track roadmap of Performance-core and Efficient-core based products, moving from two optimized platforms into one common, industry-defining platform. This path maximizes performance-per-watt, segment features, and Intel's overall competitiveness within the industry. The global artificial intelligence chip market was valued at $11.2 billion in 2021 and is projected to reach $263.6 billion by 2031, growing at a CAGR of 37.1% from 2022 to 2031.
| Report Metric | Details |
| Report Name | Global AI Chip Market |
| Base Year | 2021 |
| Forecasted years | 2022-2031 |
| Forecast units | USD |
| Report coverage | Revenue and volume forecast, company share, competitive landscape, growth factors and trends |
| Geographic regions covered | North America, Europe, Asia Pacific, Latin America, Middle East & Africa |
Ans. Yes, we do provide the option to buy chapters in a report. We also can customize the report based on your specific requirements.
Ans: The global Vacuum Wafer Mounter market was valued at US$ million in 2022 and is anticipated to reach US$ million by 2029, witnessing a CAGR of % during the forecast period 2023-2029.
CHAPTER 1:INTRODUCTION
CHAPTER 2:EXECUTIVE SUMMARY
CHAPTER 3:MARKET OVERVIEW
3.1.Market definition and scope
3.2.Key findings
3.3.Porter’s five forces analysis
3.4.Top player positioning
3.5.Market dynamics
3.6.COVID-19 Impact Analysis on the market
CHAPTER 4: ARTIFICIAL INTELLIGENCE CHIP MARKET, BY CHIP TYPE
4.1 Overview
4.2 GPU
4.3 ASIC
4.4 FPGA
4.5 CPU
4.6 Others
CHAPTER 5: ARTIFICIAL INTELLIGENCE CHIP MARKET, BY PROCESSING TYPE
5.1 Overview
5.2 Edge
5.3 Cloud
CHAPTER 6: ARTIFICIAL INTELLIGENCE CHIP MARKET, BY TECHNOLOGY
6.1 Overview
6.2 System On Chip
6.3 System in Package
6.4 Multi Chip Module
6.5 Others
CHAPTER 7: ARTIFICIAL INTELLIGENCE CHIP MARKET, BY APPLICATION
7.1 Overview
7.2 Nature Language Processing
7.3 Robotics
7.4 Computer Vision
7.5 Network Security
7.6 Others
CHAPTER 8: ARTIFICIAL INTELLIGENCE CHIP MARKET, BY INDUSTRY VERTICAL
8.1 Overview
8.2 Media and Advertising
8.3 BFSI
8.4 IT and Telecom
8.5 Retail
8.6 Healthcare
8.7 Automotive and Transportation
8.8 Others
CHAPTER 9: ARTIFICIAL INTELLIGENCE CHIP MARKET, BY REGION
9.1 Overview
9.2 North America
9.3 Europe
9.4 Asia-Pacific
9.5 LAMEA
CHAPTER 10: COMPANY LANDSCAPE
CHAPTER 11: COMPANY PROFILES
11.1 Alphabet Inc.
11.2 Intel Corporation
11.3 Mythic Ltd
11.4 Baidu
11.5 MediaTek Inc
11.6 SoftBank Corp.
11.7 NVIDIA Corporation (Mellanox Technologies)
11.8 Advanced Micro Devices Inc.(Xilinx Inc.)
11.9 Qualcomm Technologies Inc.
11.10 NXP Semiconductors
11.11 Samsung Electronics Co Ltd
LIST OF TABLES
TABLE 1. GLOBAL ARTIFICIAL INTELLIGENCE CHIP MARKET, BY CHIP TYPE, 2021-2031 (REVENUE, $MILLION)
TABLE 2. ARTIFICIAL INTELLIGENCE CHIP MARKET FOR GPU, BY REGION, 2021-2031 (REVENUE, $MILLION)
TABLE 3. ARTIFICIAL INTELLIGENCE CHIP MARKET FOR GPU, BY COUNTRY, 2021-2031 (REVENUE, $MILLION)
TABLE 4. ARTIFICIAL INTELLIGENCE CHIP MARKET FOR ASIC, BY REGION, 2021-2031 (REVENUE, $MILLION)
TABLE 5. ARTIFICIAL INTELLIGENCE CHIP MARKET FOR ASIC, BY COUNTRY, 2021-2031 (REVENUE, $MILLION)
TABLE 6. ARTIFICIAL INTELLIGENCE CHIP MARKET FOR FPGA, BY REGION, 2021-2031 (REVENUE, $MILLION)
TABLE 7. ARTIFICIAL INTELLIGENCE CHIP MARKET FOR FPGA, BY COUNTRY, 2021-2031 (REVENUE, $MILLION)
TABLE 8. ARTIFICIAL INTELLIGENCE CHIP MARKET FOR CPU, BY REGION, 2021-2031 (REVENUE, $MILLION)
TABLE 9. ARTIFICIAL INTELLIGENCE CHIP MARKET FOR CPU, BY COUNTRY, 2021-2031 (REVENUE, $MILLION)
TABLE 10. ARTIFICIAL INTELLIGENCE CHIP MARKET FOR OTHERS, BY REGION, 2021-2031 (REVENUE, $MILLION)
TABLE 11. ARTIFICIAL INTELLIGENCE CHIP MARKET FOR OTHERS, BY COUNTRY, 2021-2031 (REVENUE, $MILLION)
TABLE 12. GLOBAL ARTIFICIAL INTELLIGENCE CHIP MARKET, BY PROCESSING TYPE, 2021-2031 (REVENUE, $MILLION)
TABLE 13. ARTIFICIAL INTELLIGENCE CHIP MARKET FOR EDGE, BY REGION, 2021-2031 (REVENUE, $MILLION)
TABLE 14. ARTIFICIAL INTELLIGENCE CHIP MARKET FOR EDGE, BY COUNTRY, 2021-2031 (REVENUE, $MILLION)
TABLE 15. ARTIFICIAL INTELLIGENCE CHIP MARKET FOR CLOUD, BY REGION, 2021-2031 (REVENUE, $MILLION)
TABLE 16. ARTIFICIAL INTELLIGENCE CHIP MARKET FOR CLOUD, BY COUNTRY, 2021-2031 (REVENUE, $MILLION)
TABLE 17. GLOBAL ARTIFICIAL INTELLIGENCE CHIP MARKET, BY TECHNOLOGY, 2021-2031 (REVENUE, $MILLION)
TABLE 18. ARTIFICIAL INTELLIGENCE CHIP MARKET FOR SYSTEM ON CHIP, BY REGION, 2021-2031 (REVENUE, $MILLION)
TABLE 19. ARTIFICIAL INTELLIGENCE CHIP MARKET FOR SYSTEM ON CHIP, BY COUNTRY, 2021-2031 (REVENUE, $MILLION)
TABLE 20. ARTIFICIAL INTELLIGENCE CHIP MARKET FOR SYSTEM IN PACKAGE, BY REGION, 2021-2031 (REVENUE, $MILLION)
TABLE 21. ARTIFICIAL INTELLIGENCE CHIP MARKET FOR SYSTEM IN PACKAGE, BY COUNTRY, 2021-2031 (REVENUE, $MILLION)
TABLE 22. ARTIFICIAL INTELLIGENCE CHIP MARKET FOR MULTI CHIP MODULE, BY REGION, 2021-2031 (REVENUE, $MILLION)
TABLE 23. ARTIFICIAL INTELLIGENCE CHIP MARKET FOR MULTI CHIP MODULE, BY COUNTRY, 2021-2031 (REVENUE, $MILLION)
TABLE 24. ARTIFICIAL INTELLIGENCE CHIP MARKET FOR OTHERS, BY REGION, 2021-2031 (REVENUE, $MILLION)
TABLE 25. ARTIFICIAL INTELLIGENCE CHIP MARKET FOR OTHERS, BY COUNTRY, 2021-2031 (REVENUE, $MILLION)
TABLE 26. GLOBAL ARTIFICIAL INTELLIGENCE CHIP MARKET, BY APPLICATION, 2021-2031 (REVENUE, $MILLION)
TABLE 27. ARTIFICIAL INTELLIGENCE CHIP MARKET FOR NATURE LANGUAGE PROCESSING, BY REGION, 2021-2031 (REVENUE, $MILLION)
TABLE 28. ARTIFICIAL INTELLIGENCE CHIP MARKET FOR NATURE LANGUAGE PROCESSING, BY COUNTRY, 2021-2031 (REVENUE, $MILLION)
TABLE 29. ARTIFICIAL INTELLIGENCE CHIP MARKET FOR ROBOTICS, BY REGION, 2021-2031 (REVENUE, $MILLION)
TABLE 30. ARTIFICIAL INTELLIGENCE CHIP MARKET FOR ROBOTICS, BY COUNTRY, 2021-2031 (REVENUE, $MILLION)
TABLE 31. ARTIFICIAL INTELLIGENCE CHIP MARKET FOR COMPUTER VISION, BY REGION, 2021-2031 (REVENUE, $MILLION)
TABLE 32. ARTIFICIAL INTELLIGENCE CHIP MARKET FOR COMPUTER VISION, BY COUNTRY, 2021-2031 (REVENUE, $MILLION)
TABLE 33. ARTIFICIAL INTELLIGENCE CHIP MARKET FOR NETWORK SECURITY, BY REGION, 2021-2031 (REVENUE, $MILLION)
TABLE 34. ARTIFICIAL INTELLIGENCE CHIP MARKET FOR NETWORK SECURITY, BY COUNTRY, 2021-2031 (REVENUE, $MILLION)
TABLE 35. ARTIFICIAL INTELLIGENCE CHIP MARKET FOR OTHERS, BY REGION, 2021-2031 (REVENUE, $MILLION)
TABLE 36. ARTIFICIAL INTELLIGENCE CHIP MARKET FOR OTHERS, BY COUNTRY, 2021-2031 (REVENUE, $MILLION)
TABLE 37. GLOBAL ARTIFICIAL INTELLIGENCE CHIP MARKET, BY INDUSTRY VERTICAL, 2021-2031 (REVENUE, $MILLION)
TABLE 38. ARTIFICIAL INTELLIGENCE CHIP MARKET FOR MEDIA AND ADVERTISING, BY REGION, 2021-2031 (REVENUE, $MILLION)
TABLE 39. ARTIFICIAL INTELLIGENCE CHIP MARKET FOR MEDIA AND ADVERTISING, BY COUNTRY, 2021-2031 (REVENUE, $MILLION)
TABLE 40. ARTIFICIAL INTELLIGENCE CHIP MARKET FOR BFSI, BY REGION, 2021-2031 (REVENUE, $MILLION)
TABLE 41. ARTIFICIAL INTELLIGENCE CHIP MARKET FOR BFSI, BY COUNTRY, 2021-2031 (REVENUE, $MILLION)
TABLE 42. ARTIFICIAL INTELLIGENCE CHIP MARKET FOR IT AND TELECOM, BY REGION, 2021-2031 (REVENUE, $MILLION)
TABLE 43. ARTIFICIAL INTELLIGENCE CHIP MARKET FOR IT AND TELECOM, BY COUNTRY, 2021-2031 (REVENUE, $MILLION)
TABLE 44. ARTIFICIAL INTELLIGENCE CHIP MARKET FOR RETAIL, BY REGION, 2021-2031 (REVENUE, $MILLION)
TABLE 45. ARTIFICIAL INTELLIGENCE CHIP MARKET FOR RETAIL, BY COUNTRY, 2021-2031 (REVENUE, $MILLION)
TABLE 46. ARTIFICIAL INTELLIGENCE CHIP MARKET FOR HEALTHCARE, BY REGION, 2021-2031 (REVENUE, $MILLION)
TABLE 47. ARTIFICIAL INTELLIGENCE CHIP MARKET FOR HEALTHCARE, BY COUNTRY, 2021-2031 (REVENUE, $MILLION)
TABLE 48. ARTIFICIAL INTELLIGENCE CHIP MARKET FOR AUTOMOTIVE AND TRANSPORTATION, BY REGION, 2021-2031 (REVENUE, $MILLION)
TABLE 49. ARTIFICIAL INTELLIGENCE CHIP MARKET FOR AUTOMOTIVE AND TRANSPORTATION, BY COUNTRY, 2021-2031 (REVENUE, $MILLION)
TABLE 50. ARTIFICIAL INTELLIGENCE CHIP MARKET FOR OTHERS, BY REGION, 2021-2031 (REVENUE, $MILLION)
TABLE 51. ARTIFICIAL INTELLIGENCE CHIP MARKET FOR OTHERS, BY COUNTRY, 2021-2031 (REVENUE, $MILLION)
TABLE 52. ARTIFICIAL INTELLIGENCE CHIP MARKET, BY REGION, 2021-2031 (REVENUE, $MILLION)
TABLE 53. NORTH AMERICA ARTIFICIAL INTELLIGENCE CHIP MARKET, BY CHIP TYPE, 2021-2031 (REVENUE, $MILLION)
TABLE 54. NORTH AMERICA ARTIFICIAL INTELLIGENCE CHIP MARKET, BY PROCESSING TYPE, 2021-2031 (REVENUE, $MILLION)
TABLE 55. NORTH AMERICA ARTIFICIAL INTELLIGENCE CHIP MARKET, BY TECHNOLOGY, 2021-2031 (REVENUE, $MILLION)
TABLE 56. NORTH AMERICA ARTIFICIAL INTELLIGENCE CHIP MARKET, BY APPLICATION, 2021-2031 (REVENUE, $MILLION)
TABLE 57. NORTH AMERICA ARTIFICIAL INTELLIGENCE CHIP MARKET, BY INDUSTRY VERTICAL, 2021-2031 (REVENUE, $MILLION)
TABLE 58. NORTH AMERICA ARTIFICIAL INTELLIGENCE CHIP MARKET, BY COUNTRY, 2021-2031 (REVENUE, $MILLION)
TABLE 59. U.S. ARTIFICIAL INTELLIGENCE CHIP MARKET, BY CHIP TYPE, 2021-2031 (REVENUE, $MILLION)
TABLE 60. U.S. ARTIFICIAL INTELLIGENCE CHIP MARKET, BY PROCESSING TYPE, 2021-2031 (REVENUE, $MILLION)
TABLE 61. U.S. ARTIFICIAL INTELLIGENCE CHIP MARKET, BY TECHNOLOGY, 2021-2031 (REVENUE, $MILLION)
TABLE 62. U.S. ARTIFICIAL INTELLIGENCE CHIP MARKET, BY APPLICATION, 2021-2031 (REVENUE, $MILLION)
TABLE 63. U.S. ARTIFICIAL INTELLIGENCE CHIP MARKET, BY INDUSTRY VERTICAL, 2021-2031 (REVENUE, $MILLION)
TABLE 64. CANADA ARTIFICIAL INTELLIGENCE CHIP MARKET, BY CHIP TYPE, 2021-2031 (REVENUE, $MILLION)
TABLE 65. CANADA ARTIFICIAL INTELLIGENCE CHIP MARKET, BY PROCESSING TYPE, 2021-2031 (REVENUE, $MILLION)
TABLE 66. CANADA ARTIFICIAL INTELLIGENCE CHIP MARKET, BY TECHNOLOGY, 2021-2031 (REVENUE, $MILLION)
TABLE 67. CANADA ARTIFICIAL INTELLIGENCE CHIP MARKET, BY APPLICATION, 2021-2031 (REVENUE, $MILLION)
TABLE 68. CANADA ARTIFICIAL INTELLIGENCE CHIP MARKET, BY INDUSTRY VERTICAL, 2021-2031 (REVENUE, $MILLION)
TABLE 69. MEXICO ARTIFICIAL INTELLIGENCE CHIP MARKET, BY CHIP TYPE, 2021-2031 (REVENUE, $MILLION)
TABLE 70. MEXICO ARTIFICIAL INTELLIGENCE CHIP MARKET, BY PROCESSING TYPE, 2021-2031 (REVENUE, $MILLION)
TABLE 71. MEXICO ARTIFICIAL INTELLIGENCE CHIP MARKET, BY TECHNOLOGY, 2021-2031 (REVENUE, $MILLION)
TABLE 72. MEXICO ARTIFICIAL INTELLIGENCE CHIP MARKET, BY APPLICATION, 2021-2031 (REVENUE, $MILLION)
TABLE 73. MEXICO ARTIFICIAL INTELLIGENCE CHIP MARKET, BY INDUSTRY VERTICAL, 2021-2031 (REVENUE, $MILLION)
TABLE 74. EUROPE ARTIFICIAL INTELLIGENCE CHIP MARKET, BY CHIP TYPE, 2021-2031 (REVENUE, $MILLION)
TABLE 75. EUROPE ARTIFICIAL INTELLIGENCE CHIP MARKET, BY PROCESSING TYPE, 2021-2031 (REVENUE, $MILLION)
TABLE 76. EUROPE ARTIFICIAL INTELLIGENCE CHIP MARKET, BY TECHNOLOGY, 2021-2031 (REVENUE, $MILLION)
TABLE 77. EUROPE ARTIFICIAL INTELLIGENCE CHIP MARKET, BY APPLICATION, 2021-2031 (REVENUE, $MILLION)
TABLE 78. EUROPE ARTIFICIAL INTELLIGENCE CHIP MARKET, BY INDUSTRY VERTICAL, 2021-2031 (REVENUE, $MILLION)
TABLE 79. EUROPE ARTIFICIAL INTELLIGENCE CHIP MARKET, BY COUNTRY, 2021-2031 (REVENUE, $MILLION)
TABLE 80. UK ARTIFICIAL INTELLIGENCE CHIP MARKET, BY CHIP TYPE, 2021-2031 (REVENUE, $MILLION)
TABLE 81. UK ARTIFICIAL INTELLIGENCE CHIP MARKET, BY PROCESSING TYPE, 2021-2031 (REVENUE, $MILLION)
TABLE 82. UK ARTIFICIAL INTELLIGENCE CHIP MARKET, BY TECHNOLOGY, 2021-2031 (REVENUE, $MILLION)
TABLE 83. UK ARTIFICIAL INTELLIGENCE CHIP MARKET, BY APPLICATION, 2021-2031 (REVENUE, $MILLION)
TABLE 84. UK ARTIFICIAL INTELLIGENCE CHIP MARKET, BY INDUSTRY VERTICAL, 2021-2031 (REVENUE, $MILLION)
TABLE 85. GERMANY ARTIFICIAL INTELLIGENCE CHIP MARKET, BY CHIP TYPE, 2021-2031 (REVENUE, $MILLION)
TABLE 86. GERMANY ARTIFICIAL INTELLIGENCE CHIP MARKET, BY PROCESSING TYPE, 2021-2031 (REVENUE, $MILLION)
TABLE 87. GERMANY ARTIFICIAL INTELLIGENCE CHIP MARKET, BY TECHNOLOGY, 2021-2031 (REVENUE, $MILLION)
TABLE 88. GERMANY ARTIFICIAL INTELLIGENCE CHIP MARKET, BY APPLICATION, 2021-2031 (REVENUE, $MILLION)
TABLE 89. GERMANY ARTIFICIAL INTELLIGENCE CHIP MARKET, BY INDUSTRY VERTICAL, 2021-2031 (REVENUE, $MILLION)
TABLE 90. FRANCE ARTIFICIAL INTELLIGENCE CHIP MARKET, BY CHIP TYPE, 2021-2031 (REVENUE, $MILLION)
TABLE 91. FRANCE ARTIFICIAL INTELLIGENCE CHIP MARKET, BY PROCESSING TYPE, 2021-2031 (REVENUE, $MILLION)
TABLE 92. FRANCE ARTIFICIAL INTELLIGENCE CHIP MARKET, BY TECHNOLOGY, 2021-2031 (REVENUE, $MILLION)
TABLE 93. FRANCE ARTIFICIAL INTELLIGENCE CHIP MARKET, BY APPLICATION, 2021-2031 (REVENUE, $MILLION)
TABLE 94. FRANCE ARTIFICIAL INTELLIGENCE CHIP MARKET, BY INDUSTRY VERTICAL, 2021-2031 (REVENUE, $MILLION)
TABLE 95. RUSSIA ARTIFICIAL INTELLIGENCE CHIP MARKET, BY CHIP TYPE, 2021-2031 (REVENUE, $MILLION)
TABLE 96. RUSSIA ARTIFICIAL INTELLIGENCE CHIP MARKET, BY PROCESSING TYPE, 2021-2031 (REVENUE, $MILLION)
TABLE 97. RUSSIA ARTIFICIAL INTELLIGENCE CHIP MARKET, BY TECHNOLOGY, 2021-2031 (REVENUE, $MILLION)
TABLE 98. RUSSIA ARTIFICIAL INTELLIGENCE CHIP MARKET, BY APPLICATION, 2021-2031 (REVENUE, $MILLION)
TABLE 99. RUSSIA ARTIFICIAL INTELLIGENCE CHIP MARKET, BY INDUSTRY VERTICAL, 2021-2031 (REVENUE, $MILLION)
TABLE 100. REST OF EUROPE ARTIFICIAL INTELLIGENCE CHIP MARKET, BY CHIP TYPE, 2021-2031 (REVENUE, $MILLION)
TABLE 101. REST OF EUROPE ARTIFICIAL INTELLIGENCE CHIP MARKET, BY PROCESSING TYPE, 2021-2031 (REVENUE, $MILLION)
TABLE 102. REST OF EUROPE ARTIFICIAL INTELLIGENCE CHIP MARKET, BY TECHNOLOGY, 2021-2031 (REVENUE, $MILLION)
TABLE 103. REST OF EUROPE ARTIFICIAL INTELLIGENCE CHIP MARKET, BY APPLICATION, 2021-2031 (REVENUE, $MILLION)
TABLE 104. REST OF EUROPE ARTIFICIAL INTELLIGENCE CHIP MARKET, BY INDUSTRY VERTICAL, 2021-2031 (REVENUE, $MILLION)
TABLE 105. ASIA-PACIFIC ARTIFICIAL INTELLIGENCE CHIP MARKET, BY CHIP TYPE, 2021-2031 (REVENUE, $MILLION)
TABLE 106. ASIA-PACIFIC ARTIFICIAL INTELLIGENCE CHIP MARKET, BY PROCESSING TYPE, 2021-2031 (REVENUE, $MILLION)
TABLE 107. ASIA-PACIFIC ARTIFICIAL INTELLIGENCE CHIP MARKET, BY TECHNOLOGY, 2021-2031 (REVENUE, $MILLION)
TABLE 108. ASIA-PACIFIC ARTIFICIAL INTELLIGENCE CHIP MARKET, BY APPLICATION, 2021-2031 (REVENUE, $MILLION)
TABLE 109. ASIA-PACIFIC ARTIFICIAL INTELLIGENCE CHIP MARKET, BY INDUSTRY VERTICAL, 2021-2031 (REVENUE, $MILLION)
TABLE 110. ASIA-PACIFIC ARTIFICIAL INTELLIGENCE CHIP MARKET, BY COUNTRY, 2021-2031 (REVENUE, $MILLION)
TABLE 111. CHINA ARTIFICIAL INTELLIGENCE CHIP MARKET, BY CHIP TYPE, 2021-2031 (REVENUE, $MILLION)
TABLE 112. CHINA ARTIFICIAL INTELLIGENCE CHIP MARKET, BY PROCESSING TYPE, 2021-2031 (REVENUE, $MILLION)
TABLE 113. CHINA ARTIFICIAL INTELLIGENCE CHIP MARKET, BY TECHNOLOGY, 2021-2031 (REVENUE, $MILLION)
TABLE 114. CHINA ARTIFICIAL INTELLIGENCE CHIP MARKET, BY APPLICATION, 2021-2031 (REVENUE, $MILLION)
TABLE 115. CHINA ARTIFICIAL INTELLIGENCE CHIP MARKET, BY INDUSTRY VERTICAL, 2021-2031 (REVENUE, $MILLION)
TABLE 116. JAPAN ARTIFICIAL INTELLIGENCE CHIP MARKET, BY CHIP TYPE, 2021-2031 (REVENUE, $MILLION)
TABLE 117. JAPAN ARTIFICIAL INTELLIGENCE CHIP MARKET, BY PROCESSING TYPE, 2021-2031 (REVENUE, $MILLION)
TABLE 118. JAPAN ARTIFICIAL INTELLIGENCE CHIP MARKET, BY TECHNOLOGY, 2021-2031 (REVENUE, $MILLION)
TABLE 119. JAPAN ARTIFICIAL INTELLIGENCE CHIP MARKET, BY APPLICATION, 2021-2031 (REVENUE, $MILLION)
TABLE 120. JAPAN ARTIFICIAL INTELLIGENCE CHIP MARKET, BY INDUSTRY VERTICAL, 2021-2031 (REVENUE, $MILLION)
TABLE 121. INDIA ARTIFICIAL INTELLIGENCE CHIP MARKET, BY CHIP TYPE, 2021-2031 (REVENUE, $MILLION)
TABLE 122. INDIA ARTIFICIAL INTELLIGENCE CHIP MARKET, BY PROCESSING TYPE, 2021-2031 (REVENUE, $MILLION)
TABLE 123. INDIA ARTIFICIAL INTELLIGENCE CHIP MARKET, BY TECHNOLOGY, 2021-2031 (REVENUE, $MILLION)
TABLE 124. INDIA ARTIFICIAL INTELLIGENCE CHIP MARKET, BY APPLICATION, 2021-2031 (REVENUE, $MILLION)
TABLE 125. INDIA ARTIFICIAL INTELLIGENCE CHIP MARKET, BY INDUSTRY VERTICAL, 2021-2031 (REVENUE, $MILLION)
TABLE 126. AUSTRALIA ARTIFICIAL INTELLIGENCE CHIP MARKET, BY CHIP TYPE, 2021-2031 (REVENUE, $MILLION)
TABLE 127. AUSTRALIA ARTIFICIAL INTELLIGENCE CHIP MARKET, BY PROCESSING TYPE, 2021-2031 (REVENUE, $MILLION)
TABLE 128. AUSTRALIA ARTIFICIAL INTELLIGENCE CHIP MARKET, BY TECHNOLOGY, 2021-2031 (REVENUE, $MILLION)
TABLE 129. AUSTRALIA ARTIFICIAL INTELLIGENCE CHIP MARKET, BY APPLICATION, 2021-2031 (REVENUE, $MILLION)
TABLE 130. AUSTRALIA ARTIFICIAL INTELLIGENCE CHIP MARKET, BY INDUSTRY VERTICAL, 2021-2031 (REVENUE, $MILLION)
TABLE 131. REST OF ASIA-PACIFIC ARTIFICIAL INTELLIGENCE CHIP MARKET, BY CHIP TYPE, 2021-2031 (REVENUE, $MILLION)
TABLE 132. REST OF ASIA-PACIFIC ARTIFICIAL INTELLIGENCE CHIP MARKET, BY PROCESSING TYPE, 2021-2031 (REVENUE, $MILLION)
TABLE 133. REST OF ASIA-PACIFIC ARTIFICIAL INTELLIGENCE CHIP MARKET, BY TECHNOLOGY, 2021-2031 (REVENUE, $MILLION)
TABLE 134. REST OF ASIA-PACIFIC ARTIFICIAL INTELLIGENCE CHIP MARKET, BY APPLICATION, 2021-2031 (REVENUE, $MILLION)
TABLE 135. REST OF ASIA-PACIFIC ARTIFICIAL INTELLIGENCE CHIP MARKET, BY INDUSTRY VERTICAL, 2021-2031 (REVENUE, $MILLION)
TABLE 136. LAMEA ARTIFICIAL INTELLIGENCE CHIP MARKET, BY CHIP TYPE, 2021-2031 (REVENUE, $MILLION)
TABLE 137. LAMEA ARTIFICIAL INTELLIGENCE CHIP MARKET, BY PROCESSING TYPE, 2021-2031 (REVENUE, $MILLION)
TABLE 138. LAMEA ARTIFICIAL INTELLIGENCE CHIP MARKET, BY TECHNOLOGY, 2021-2031 (REVENUE, $MILLION)
TABLE 139. LAMEA ARTIFICIAL INTELLIGENCE CHIP MARKET, BY APPLICATION, 2021-2031 (REVENUE, $MILLION)
TABLE 140. LAMEA ARTIFICIAL INTELLIGENCE CHIP MARKET, BY INDUSTRY VERTICAL, 2021-2031 (REVENUE, $MILLION)
TABLE 141. LAMEA ARTIFICIAL INTELLIGENCE CHIP MARKET, BY COUNTRY, 2021-2031 (REVENUE, $MILLION)
TABLE 142. LATIN AMERICA ARTIFICIAL INTELLIGENCE CHIP MARKET, BY CHIP TYPE, 2021-2031 (REVENUE, $MILLION)
TABLE 143. LATIN AMERICA ARTIFICIAL INTELLIGENCE CHIP MARKET, BY PROCESSING TYPE, 2021-2031 (REVENUE, $MILLION)
TABLE 144. LATIN AMERICA ARTIFICIAL INTELLIGENCE CHIP MARKET, BY TECHNOLOGY, 2021-2031 (REVENUE, $MILLION)
TABLE 145. LATIN AMERICA ARTIFICIAL INTELLIGENCE CHIP MARKET, BY APPLICATION, 2021-2031 (REVENUE, $MILLION)
TABLE 146. LATIN AMERICA ARTIFICIAL INTELLIGENCE CHIP MARKET, BY INDUSTRY VERTICAL, 2021-2031 (REVENUE, $MILLION)
TABLE 147. MIDDLE EAST ARTIFICIAL INTELLIGENCE CHIP MARKET, BY CHIP TYPE, 2021-2031 (REVENUE, $MILLION)
TABLE 148. MIDDLE EAST ARTIFICIAL INTELLIGENCE CHIP MARKET, BY PROCESSING TYPE, 2021-2031 (REVENUE, $MILLION)
TABLE 149. MIDDLE EAST ARTIFICIAL INTELLIGENCE CHIP MARKET, BY TECHNOLOGY, 2021-2031 (REVENUE, $MILLION)
TABLE 150. MIDDLE EAST ARTIFICIAL INTELLIGENCE CHIP MARKET, BY APPLICATION, 2021-2031 (REVENUE, $MILLION)
TABLE 151. MIDDLE EAST ARTIFICIAL INTELLIGENCE CHIP MARKET, BY INDUSTRY VERTICAL, 2021-2031 (REVENUE, $MILLION)
TABLE 152. AFRICA ARTIFICIAL INTELLIGENCE CHIP MARKET, BY CHIP TYPE, 2021-2031 (REVENUE, $MILLION)
TABLE 153. AFRICA ARTIFICIAL INTELLIGENCE CHIP MARKET, BY PROCESSING TYPE, 2021-2031 (REVENUE, $MILLION)
TABLE 154. AFRICA ARTIFICIAL INTELLIGENCE CHIP MARKET, BY TECHNOLOGY, 2021-2031 (REVENUE, $MILLION)
TABLE 155. AFRICA ARTIFICIAL INTELLIGENCE CHIP MARKET, BY APPLICATION, 2021-2031 (REVENUE, $MILLION)
TABLE 156. AFRICA ARTIFICIAL INTELLIGENCE CHIP MARKET, BY INDUSTRY VERTICAL, 2021-2031 (REVENUE, $MILLION)
TABLE 157.ALPHABET INC.: COMPANY SNAPSHOT
TABLE 158.ALPHABET INC.: OPERATING SEGMENTS
TABLE 159.ALPHABET INC.: PRODUCT PORTFOLIO
TABLE 160.ALPHABET INC.: NET SALES
TABLE 161.ALPHABET INC.: KEY STRATERGIES
TABLE 162.INTEL CORPORATION: COMPANY SNAPSHOT
TABLE 163.INTEL CORPORATION: OPERATING SEGMENTS
TABLE 164.INTEL CORPORATION: PRODUCT PORTFOLIO
TABLE 165.INTEL CORPORATION: NET SALES
TABLE 166.INTEL CORPORATION: KEY STRATERGIES
TABLE 167.MYTHIC LTD: COMPANY SNAPSHOT
TABLE 168.MYTHIC LTD: OPERATING SEGMENTS
TABLE 169.MYTHIC LTD: PRODUCT PORTFOLIO
TABLE 170.MYTHIC LTD: NET SALES
TABLE 171.MYTHIC LTD: KEY STRATERGIES
TABLE 172.BAIDU: COMPANY SNAPSHOT
TABLE 173.BAIDU: OPERATING SEGMENTS
TABLE 174.BAIDU: PRODUCT PORTFOLIO
TABLE 175.BAIDU: NET SALES
TABLE 176.BAIDU: KEY STRATERGIES
TABLE 177.MEDIATEK INC: COMPANY SNAPSHOT
TABLE 178.MEDIATEK INC: OPERATING SEGMENTS
TABLE 179.MEDIATEK INC: PRODUCT PORTFOLIO
TABLE 180.MEDIATEK INC: NET SALES
TABLE 181.MEDIATEK INC: KEY STRATERGIES
TABLE 182.SOFTBANK CORP.: COMPANY SNAPSHOT
TABLE 183.SOFTBANK CORP.: OPERATING SEGMENTS
TABLE 184.SOFTBANK CORP.: PRODUCT PORTFOLIO
TABLE 185.SOFTBANK CORP.: NET SALES
TABLE 186.SOFTBANK CORP.: KEY STRATERGIES
TABLE 187.NVIDIA CORPORATION (MELLANOX TECHNOLOGIES): COMPANY SNAPSHOT
TABLE 188.NVIDIA CORPORATION (MELLANOX TECHNOLOGIES): OPERATING SEGMENTS
TABLE 189.NVIDIA CORPORATION (MELLANOX TECHNOLOGIES): PRODUCT PORTFOLIO
TABLE 190.NVIDIA CORPORATION (MELLANOX TECHNOLOGIES): NET SALES
TABLE 191.NVIDIA CORPORATION (MELLANOX TECHNOLOGIES): KEY STRATERGIES
TABLE 192.ADVANCED MICRO DEVICES INC.(XILINX INC.): COMPANY SNAPSHOT
TABLE 193.ADVANCED MICRO DEVICES INC.(XILINX INC.): OPERATING SEGMENTS
TABLE 194.ADVANCED MICRO DEVICES INC.(XILINX INC.): PRODUCT PORTFOLIO
TABLE 195.ADVANCED MICRO DEVICES INC.(XILINX INC.): NET SALES
TABLE 196.ADVANCED MICRO DEVICES INC.(XILINX INC.): KEY STRATERGIES
TABLE 197.QUALCOMM TECHNOLOGIES INC.: COMPANY SNAPSHOT
TABLE 198.QUALCOMM TECHNOLOGIES INC.: OPERATING SEGMENTS
TABLE 199.QUALCOMM TECHNOLOGIES INC.: PRODUCT PORTFOLIO
TABLE 200.QUALCOMM TECHNOLOGIES INC.: NET SALES
TABLE 201.QUALCOMM TECHNOLOGIES INC.: KEY STRATERGIES
TABLE 202.NXP SEMICONDUCTORS: COMPANY SNAPSHOT
TABLE 203.NXP SEMICONDUCTORS: OPERATING SEGMENTS
TABLE 204.NXP SEMICONDUCTORS: PRODUCT PORTFOLIO
TABLE 205.NXP SEMICONDUCTORS: NET SALES
TABLE 206.NXP SEMICONDUCTORS: KEY STRATERGIES
TABLE 207.SAMSUNG ELECTRONICS CO LTD: COMPANY SNAPSHOT
TABLE 208.SAMSUNG ELECTRONICS CO LTD: OPERATING SEGMENTS
TABLE 209.SAMSUNG ELECTRONICS CO LTD: PRODUCT PORTFOLIO
TABLE 210.SAMSUNG ELECTRONICS CO LTD: NET SALES
TABLE 211.SAMSUNG ELECTRONICS CO LTD: KEY STRATERGIES
LIST OF FIGURES
FIGURE 1.ARTIFICIAL INTELLIGENCE CHIP MARKET SEGMENTATION
FIGURE 2.ARTIFICIAL INTELLIGENCE CHIP MARKET,2021-2031
FIGURE 3.ARTIFICIAL INTELLIGENCE CHIP MARKET,2021-2031
FIGURE 4. TOP INVESTMENT POCKETS, BY REGION
FIGURE 5.PORTER FIVE-1
FIGURE 6.PORTER FIVE-2
FIGURE 7.PORTER FIVE-3
FIGURE 8.PORTER FIVE-4
FIGURE 9.PORTER FIVE-5
FIGURE 10.TOP PLAYER POSITIONING
FIGURE 11.ARTIFICIAL INTELLIGENCE CHIP MARKET:DRIVERS, RESTRAINTS AND OPPORTUNITIES
FIGURE 12.ARTIFICIAL INTELLIGENCE CHIP MARKET,BY CHIP TYPE,2021(%)
FIGURE 13.COMPARATIVE SHARE ANALYSIS OF GPU ARTIFICIAL INTELLIGENCE CHIP MARKET,2021-2031(%)
FIGURE 14.COMPARATIVE SHARE ANALYSIS OF ASIC ARTIFICIAL INTELLIGENCE CHIP MARKET,2021-2031(%)
FIGURE 15.COMPARATIVE SHARE ANALYSIS OF FPGA ARTIFICIAL INTELLIGENCE CHIP MARKET,2021-2031(%)
FIGURE 16.COMPARATIVE SHARE ANALYSIS OF CPU ARTIFICIAL INTELLIGENCE CHIP MARKET,2021-2031(%)
FIGURE 17.COMPARATIVE SHARE ANALYSIS OF OTHERS ARTIFICIAL INTELLIGENCE CHIP MARKET,2021-2031(%)
FIGURE 18.ARTIFICIAL INTELLIGENCE CHIP MARKET,BY PROCESSING TYPE,2021(%)
FIGURE 19.COMPARATIVE SHARE ANALYSIS OF EDGE ARTIFICIAL INTELLIGENCE CHIP MARKET,2021-2031(%)
FIGURE 20.COMPARATIVE SHARE ANALYSIS OF CLOUD ARTIFICIAL INTELLIGENCE CHIP MARKET,2021-2031(%)
FIGURE 21.ARTIFICIAL INTELLIGENCE CHIP MARKET,BY TECHNOLOGY,2021(%)
FIGURE 22.COMPARATIVE SHARE ANALYSIS OF SYSTEM ON CHIP ARTIFICIAL INTELLIGENCE CHIP MARKET,2021-2031(%)
FIGURE 23.COMPARATIVE SHARE ANALYSIS OF SYSTEM IN PACKAGE ARTIFICIAL INTELLIGENCE CHIP MARKET,2021-2031(%)
FIGURE 24.COMPARATIVE SHARE ANALYSIS OF MULTI CHIP MODULE ARTIFICIAL INTELLIGENCE CHIP MARKET,2021-2031(%)
FIGURE 25.COMPARATIVE SHARE ANALYSIS OF OTHERS ARTIFICIAL INTELLIGENCE CHIP MARKET,2021-2031(%)
FIGURE 26.ARTIFICIAL INTELLIGENCE CHIP MARKET,BY APPLICATION,2021(%)
FIGURE 27.COMPARATIVE SHARE ANALYSIS OF NATURE LANGUAGE PROCESSING ARTIFICIAL INTELLIGENCE CHIP MARKET,2021-2031(%)
FIGURE 28.COMPARATIVE SHARE ANALYSIS OF ROBOTICS ARTIFICIAL INTELLIGENCE CHIP MARKET,2021-2031(%)
FIGURE 29.COMPARATIVE SHARE ANALYSIS OF COMPUTER VISION ARTIFICIAL INTELLIGENCE CHIP MARKET,2021-2031(%)
FIGURE 30.COMPARATIVE SHARE ANALYSIS OF NETWORK SECURITY ARTIFICIAL INTELLIGENCE CHIP MARKET,2021-2031(%)
FIGURE 31.COMPARATIVE SHARE ANALYSIS OF OTHERS ARTIFICIAL INTELLIGENCE CHIP MARKET,2021-2031(%)
FIGURE 32.ARTIFICIAL INTELLIGENCE CHIP MARKET,BY INDUSTRY VERTICAL,2021(%)
FIGURE 33.COMPARATIVE SHARE ANALYSIS OF MEDIA AND ADVERTISING ARTIFICIAL INTELLIGENCE CHIP MARKET,2021-2031(%)
FIGURE 34.COMPARATIVE SHARE ANALYSIS OF BFSI ARTIFICIAL INTELLIGENCE CHIP MARKET,2021-2031(%)
FIGURE 35.COMPARATIVE SHARE ANALYSIS OF IT AND TELECOM ARTIFICIAL INTELLIGENCE CHIP MARKET,2021-2031(%)
FIGURE 36.COMPARATIVE SHARE ANALYSIS OF RETAIL ARTIFICIAL INTELLIGENCE CHIP MARKET,2021-2031(%)
FIGURE 37.COMPARATIVE SHARE ANALYSIS OF HEALTHCARE ARTIFICIAL INTELLIGENCE CHIP MARKET,2021-2031(%)
FIGURE 38.COMPARATIVE SHARE ANALYSIS OF AUTOMOTIVE AND TRANSPORTATION ARTIFICIAL INTELLIGENCE CHIP MARKET,2021-2031(%)
FIGURE 39.COMPARATIVE SHARE ANALYSIS OF OTHERS ARTIFICIAL INTELLIGENCE CHIP MARKET,2021-2031(%)
FIGURE 40.ARTIFICIAL INTELLIGENCE CHIP MARKET BY REGION,2021
FIGURE 41.U.S. ARTIFICIAL INTELLIGENCE CHIP MARKET,2021-2031($MILLION)
FIGURE 42.CANADA ARTIFICIAL INTELLIGENCE CHIP MARKET,2021-2031($MILLION)
FIGURE 43.MEXICO ARTIFICIAL INTELLIGENCE CHIP MARKET,2021-2031($MILLION)
FIGURE 44.UK ARTIFICIAL INTELLIGENCE CHIP MARKET,2021-2031($MILLION)
FIGURE 45.GERMANY ARTIFICIAL INTELLIGENCE CHIP MARKET,2021-2031($MILLION)
FIGURE 46.FRANCE ARTIFICIAL INTELLIGENCE CHIP MARKET,2021-2031($MILLION)
FIGURE 47.RUSSIA ARTIFICIAL INTELLIGENCE CHIP MARKET,2021-2031($MILLION)
FIGURE 48.REST OF EUROPE ARTIFICIAL INTELLIGENCE CHIP MARKET,2021-2031($MILLION)
FIGURE 49.CHINA ARTIFICIAL INTELLIGENCE CHIP MARKET,2021-2031($MILLION)
FIGURE 50.JAPAN ARTIFICIAL INTELLIGENCE CHIP MARKET,2021-2031($MILLION)
FIGURE 51.INDIA ARTIFICIAL INTELLIGENCE CHIP MARKET,2021-2031($MILLION)
FIGURE 52.AUSTRALIA ARTIFICIAL INTELLIGENCE CHIP MARKET,2021-2031($MILLION)
FIGURE 53.REST OF ASIA-PACIFIC ARTIFICIAL INTELLIGENCE CHIP MARKET,2021-2031($MILLION)
FIGURE 54.LATIN AMERICA ARTIFICIAL INTELLIGENCE CHIP MARKET,2021-2031($MILLION)
FIGURE 55.MIDDLE EAST ARTIFICIAL INTELLIGENCE CHIP MARKET,2021-2031($MILLION)
FIGURE 56.AFRICA ARTIFICIAL INTELLIGENCE CHIP MARKET,2021-2031($MILLION)
FIGURE 57. TOP WINNING STRATEGIES, BY YEAR
FIGURE 58. TOP WINNING STRATEGIES, BY DEVELOPMENT
FIGURE 59. TOP WINNING STRATEGIES, BY COMPANY
FIGURE 60.PRODUCT MAPPING OF TOP 10 PLAYERS
FIGURE 61.COMPETITIVE DASHBOARD
FIGURE 62.COMPETITIVE HEATMAP OF TOP 10 KEY PLAYERS
FIGURE 63.ALPHABET INC..: NET SALES ($MILLION)
FIGURE 64.INTEL CORPORATION.: NET SALES ($MILLION)
FIGURE 65.MYTHIC LTD.: NET SALES ($MILLION)
FIGURE 66.BAIDU.: NET SALES ($MILLION)
FIGURE 67.MEDIATEK INC.: NET SALES ($MILLION)
FIGURE 68.SOFTBANK CORP..: NET SALES ($MILLION)
FIGURE 69.NVIDIA CORPORATION (MELLANOX TECHNOLOGIES).: NET SALES ($MILLION)
FIGURE 70.ADVANCED MICRO DEVICES INC.(XILINX INC.).: NET SALES ($MILLION)
FIGURE 71.QUALCOMM TECHNOLOGIES INC..: NET SALES ($MILLION)
FIGURE 72.NXP SEMICONDUCTORS.: NET SALES ($MILLION)
FIGURE 73.SAMSUNG ELECTRONICS CO LTD.: NET SALES ($MILLION)
$5370
$9600
HAVE A QUERY?
OUR CUSTOMER
