
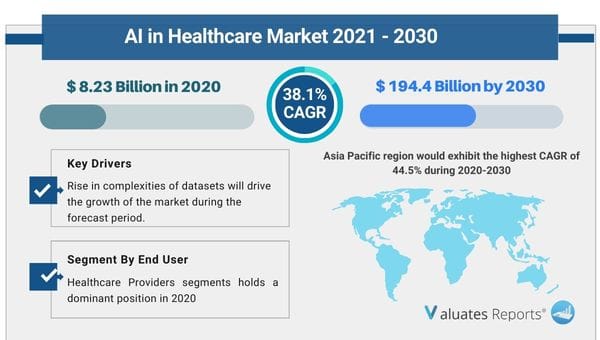
The Artificial Intelligence in healthcare market size was valued at $8.23 billion in 2020 and is projected to reach $194.4 billion by 2030, growing at a CAGR of 38.1% from 2021 to 2030. Key drivers of the AI in healthcare market include the rising use of robot-assisted surgeries to reach inaccessible organs and for greater accuracy.
The need for NLP processing in automating administrative workflows of the healthcare industry will fuel the growth of global AI in the healthcare market during the forecast period.
The need for virtual nursing assistants to remove misdiagnosis cases will drive the growth prospects of the market in the coming years.
Huge cases of dosage and prescription errors are forcing Healthcare facilities to deploy AI-powered solutions for ensuring medication accuracy in turn providing lucrative growth opportunities for the market.
The rising instances of fraud will drive AI implementation ultimately surging the AI in healthcare market expansion.
The need for accurate preliminary diagnosis and clinical trial identifiers will augment the market in the subsequent years.
Artificial Intelligence in Healthcare Market Trends
Robotic Surgeries
Several AI-powered solutions like microscopes expand the visualization capabilities of surgeons. It acts as an extra set of hands and eyes. Surgical robots help in medical imaging and diagnosis. By creating 3D images of the entire body they are able to detect abnormalities thereby reducing the number of missed diagnoses. This will bolster the growth of the AI healthcare market. Doctors are provided with accurate references during critical surgeries. With extreme skill, precision, and dexterity robots provide fewer mistakes and reduced complications. It exactly pinpoints the incision and tool placement. It also leads to smaller scars, less damage, and quicker recovery time for patients. Furthermore, it removes surgical fatigue during complicated procedures. AI reduces the overall workload of the doctors thereby increasing their productivity and efficiency.
NLP automating administrative workflows
The rise of big data and complicated patient datasets in electronic health records is fueling the extensive application of natural language processing for reducing redundant administrative activities. This provides immense opportunities for the AI in healthcare market. Managing registry, discharge formalities, and record maintenance are time-consuming. It uses computer-assisted coding to analyze long-chart notes. What used to take months or even years for any medical organization to prepare now takes seconds as the entire registers are scanned completely. Data mining becomes a cyclical technology to provide enhanced patient care. It enables automated reporting. Front-end speech recognition eliminates the need for physicians to dictate notes at the point of care.
Virtual Nursing Assistants
Ai-powered virtual nursing assistants provide personalized experiences to patients. It proves the accuracy rate of preliminary diagnosis and provides comfort to patients by providing information that helps them to be on track. The assistant identifies illness based on symptoms and monitors health status, schedules doctor appointments, and much more. It is present 24/7 and answers queries in real time. It improves patient engagement and aids in self-management skills. It expands the capacity of healthcare professionals to cater to the day-to-day needs of inbound patients. AI has the ability to process information and give out a well-defined output to the end user.
Dosage error
There are increasing cases of prescription and dosage errors due to wrong drug selection, confusion over packaging, error in drug selection, and illegible handwriting. AI technology is using big data analytics and ML algorithms to analyze large-scale electronic health records of patients in order to check how doctors are treating patients in real-world scenarios. If a prescription deviates from the usual treatment patterns it is immediately flagged off with a red alert prompting physicians to recheck. Such drastic installation is driving the growth of the global AI in healthcare market in the coming years. Equipped with a scanner for pills and capsules it uses cameras and visual recognition to monitor the medications and ensures their consistency. This improves patient safety and long-term satisfaction.
Fraud detection
The rapid digitization of the healthcare system and the integration of telehealth platforms has provided huge opportunities for cybercriminals and hackers to expose loopholes. The growing instances of payment fraud and false claim cases are driving AI-led innovations in the industry. This in turn will drive the demand for the AI in healthcare market in the future. Using historical data recognition models analyze the claims history and payment patterns of each patient. It understands whether the amount is billed properly as per the procedure billing codes and diagnosis. It also checks whether providers are adhering to coding guidelines and standards. This establishes a risk of aiding in future payment investigations.
Clnical trial identifier
AI also has the capability to assist in patient selection for clinical trials. This speeds up the entire trial process and vaccine testing system. This will fuel the growth of the AI in healthcare market. It identifies suitable cohorts by mining through online forums where patients exchange information about their medical conditions to determine whether there is any disease that is prevalent in any particular region. Moreover, it aids in preliminary diagnosis.
Artificial Intelligence in Healthcare Market Share Analysis
Based on the offering, the software segment is expected to dominate in the AI in healthcare market share owing to rapid innovations. While the hardware segment will be the fastest growing at a CAGR of 39.5% due to the growing need for AI in hardware systems.
Based on application, robot-assisted surgery will grow at a CAGR of 36.6%. It is generating US$ 2.42 billion and will reach US4 50.98 billion by 2030. This is due to the rising need for AI-assisted minimally invasive surgeries. While the dosage error reduction segment will grow the fastest at a CAGR of 40%.
Based on the algorithm, the NLP segment will grow in the AI healthcare market share at a CAGR of 36.9%. This is due to the rising use of data mining and image recognition.
Based on end users, the healthcare provider segment will witness significant growth due to the increasing use of AI systems to maintain patient records and improve treatment rates and EHRs. It will grow at a CAGR of 37.2%.
Based on region, North America will be the dominating segment at a CAGR of 35.6%. This is due to a well-developed healthcare infrastructure and favorable government support. On the other hand, Asia-pacific will grow the fastest at a CAGR of 44.5% due to the large-scale adoption of IT solutions, increasing investments in AI systems, and extensive R&D initiatives.
Key Benefits For Stakeholders
| Report Metric | Details |
| Report Name | AI in Healthcare Market |
| The market size in 2020 | USD 8.23 Billion |
| The revenue forecast in 2030 | USD 194.4 Billion |
| Growth Rate | Compound Annual Growth Rate (CAGR) of 38.1% from 2021 to 2031 |
| Market size available for years | 2021-2030 |
| Forecast units | Value (USD) |
| Segments covered | Type, End-User, Offerings, and Region |
| Report coverage | Revenue & volume forecast, company share, competitive landscape, growth factors, and trends |
| Geographic regions covered | North America, Europe, Asia Pacific, Latin America, Middle East & Africa |
Ans. The AI in healthcare market was valued at $8.23 billion in 2020, and is projected to reach $194.4 billion by 2030.
Ans. The AI in healthcare market is expected to grow at a compound annual growth rate of 38.1% from 2021 to 2030.
Ans. The key players are Web Services, Inc., Apple Inc., Google LLC, IBM Corporation, Intel Corporation, Microsoft Corporation, Nvidia, Oracle Corporation, SAP SE, and Siemens.
LIST OF TABLES
TABLE 01.GLOBAL ARTIFICIAL INTELLIGENCE IN HEALTHCARE MARKET, BY OFFERING, 20202–2030 ($MILLION)
TABLE 02.HARDWARE ARTIFICIAL INTELLIGENCE IN HEALTHCARE MARKET, BY REGION, 2020–2030 ($MILLION)
TABLE 03.SOFTWARE ARTIFICIAL INTELLIGENCE IN HEALTHCARE MARKET, BY REGION, 2020–2030 ($MILLION)
TABLE 04.ARTIFICIAL INTELLIGENCE IN HEALTHCARE MARKET, FOR SERVICES, BY REGION, 2020–2030 ($MILLION)
TABLE 05.GLOBAL ARTIFICIAL INTELLIGENCE IN HEALTHCARE MARKET, BY ALGORITHMS, 2020–2030($MILLION)
TABLE 06.DEEP LEARNING ARTIFICIAL INTELLIGENCE IN HEALTHCARE MARKET, BY REGION, 2020–2030 ($MILLION)
TABLE 07.QUERYING METHOD ARTIFICIAL INTELLIGENCE IN HEALTHCARE MARKET, BY REGION, 2020-2030($MILLION)
TABLE 08.NATURAL LANGUAGE PROCESSING ARTIFICIAL INTELLIGENCE IN HEALTHCARE MARKET, BY REGION, 2020–2030 ($MILLION)
TABLE 09.CONTEXT AWARE PROCESSING ARTIFICIAL INTELLIGENCE IN HEALTHCARE MARKET, BY REGION, 2020–2030 ($MILLION)
TABLE 10.GLOBAL ARTIFICIAL INTELLIGENCE IN HEALTHCARE MARKET, BY APPLICATION, 2020–2030 ($MILLION)
TABLE 11.ARTIFICIAL INTELLIGENCE IN HEALTHCARE MARKET FOR ROBOT-ASSISTED SURGERY, BY REGION, 2020–2030 ($MILLION)
TABLE 12.ARTIFICIAL INTELLIGENCE IN HEALTHCARE MARKET FOR VIRTUAL NURSING ASSISTANT, BY REGION, 2020–2030 ($MILLION)
TABLE 13.ARTIFICIAL INTELLIGENCE IN HEALTHCARE MARKET FOR ADMINISTRATIVE WORKFLOW ASSISTANCE, BY REGION, 2020–2030 ($MILLION)
TABLE 14.ARTIFICIAL INTELLIGENCE IN HEALTHCARE MARKET FOR FRAUD DETECTION, BY REGION, 2020–2030 ($MILLION)
TABLE 15.ARTIFICIAL INTELLIGENCE IN HEALTHCARE MARKET FOR DOSAGE ERROR REDUCTION, BY REGION, 2020–2030 ($MILLION)
TABLE 16.ARTIFICIAL INTELLIGENCE IN HEALTHCARE MARKET FOR CLINICAL TRIAL PARTICIPANT IDENTIFIER, BY REGION, 2020–2030 ($MILLION)
TABLE 17.ARTIFICIAL INTELLIGENCE IN HEALTHCARE MARKET FOR PRELIMINARY DIAGNOSIS, BY REGION, 2020–2030 ($MILLION)
TABLE 18.ARTIFICIAL INTELLIGENCE IN HEALTHCARE MARKET FOR OTHERS, BY REGION, 2020–2030 ($MILLION)
TABLE 19.GLOBAL ARTIFICIAL INTELLIGENCE IN HEALTHCARE MARKET, BY END USER, 2020–2030 ($MILLION)
TABLE 20.ARTIFICIAL INTELLIGENCE IN HEALTHCARE MARKET FOR HEALTHCARE PROVIDERS, BY REGION, 2020–2030 ($MILLION)
TABLE 21.ARTIFICIAL INTELLIGENCE IN HEALTHCARE MARKET FOR PHARMACEUTICALS & BIOTECHNOLOGY COMPANIES, BY REGION, 2020–2030 ($MILLION)
TABLE 22.ARTIFICIAL INTELLIGENCE IN HEALTHCARE MARKET FOR PATIENTS, BY REGION, 2020–2030 ($MILLION)
TABLE 23.ARTIFICIAL INTELLIGENCE IN HEALTHCARE MARKET FOR PAYER, BY REGION, 2020–2030 ($MILLION)
TABLE 24.ARTIFICIAL INTELLIGENCE IN HEALTHCARE MARKET, BY REGION, 2020–2030 ($MILLION)
TABLE 25.NORTH AMERICA ARTIFICIAL INTELLIGENCE IN HEALTHCARE MARKET, BY COUNTRY, 2020–2030 ($MILLION)
TABLE 26.NORTH AMERICA ARTIFICIAL INTELLIGENCE IN HEALTHCARE MARKET, BY OFFERING, 2020–2030 ($MILLION)
TABLE 27.NORTH AMERICA ARTIFICIAL INTELLIGENCE IN HEALTHCARE MARKET, BY ALGORITHMS, 2020–2030 ($MILLION)
TABLE 28.NORTH AMERICA ARTIFICIAL INTELLIGENCE IN HEALTHCARE MARKET, BY APPLICATION, 2020–2030 ($MILLION)
TABLE 29.NORTH AMERICA ARTIFICIAL INTELLIGENCE IN HEALTHCARE MARKET, BY END USER, 2020–2030 ($MILLION)
TABLE 30.U.S. ARTIFICIAL INTELLIGENCE IN HEALTHCARE MARKET, BY OFFERING, 2020–2030 ($MILLION)
TABLE 31.U.S. ARTIFICIAL INTELLIGENCE IN HEALTHCARE MARKET, BY ALGORITHMS, 2020–2030 ($MILLION)
TABLE 32.U.S. ARTIFICIAL INTELLIGENCE IN HEALTHCARE MARKET, BY APPLICATION, 2020–2030 ($MILLION)
TABLE 33.U.S. ARTIFICIAL INTELLIGENCE IN HEALTHCARE MARKET, BY END USER, 2020–2030 ($MILLION
TABLE 34.CANADA ARTIFICIAL INTELLIGENCE IN HEALTHCARE MARKET, BY OFFERING, 2020–2030 ($MILLION)
TABLE 35.CANADA ARTIFICIAL INTELLIGENCE IN HEALTHCARE MARKET, BY ALGORITHMS, 2020–2030 ($MILLION)
TABLE 36.CANADA ARTIFICIAL INTELLIGENCE IN HEALTHCARE MARKET, BY APPLICATION, 2020–2030 ($MILLION)
TABLE 37.CANADA ARTIFICIAL INTELLIGENCE IN HEALTHCARE MARKET, BY END USER, 2020–2030 ($MILLION)
TABLE 38.MEXICO ARTIFICIAL INTELLIGENCE IN HEALTHCARE MARKET, BY OFFERING, 2020–2030 ($MILLION)
TABLE 39.MEXICO ARTIFICIAL INTELLIGENCE IN HEALTHCARE MARKET, BY ALGORITHMS, 2020–2030 ($MILLION)
TABLE 40.MEXICO ARTIFICIAL INTELLIGENCE IN HEALTHCARE MARKET, BY APPLICATION, 2020–2030 ($MILLION)
TABLE 41.MEXICO ARTIFICIAL INTELLIGENCE IN HEALTHCARE MARKET, BY END USER, 2020–2030 ($MILLION)
TABLE 42.EUROPE ARTIFICIAL INTELLIGENCE IN HEALTHCARE MARKET, BY COUNTRY, 2020–2030 ($MILLION)
TABLE 43.EUROPE ARTIFICIAL INTELLIGENCE IN HEALTHCARE MARKET, BY OFFERING, 2020–2030 ($MILLION)
TABLE 44.EUROPE ARTIFICIAL INTELLIGENCE IN HEALTHCARE MARKET, BY ALGORITHMS, 2020–2030 ($MILLION)
TABLE 45.EUROPE ARTIFICIAL INTELLIGENCE IN HEALTHCARE MARKET, BY APPLICATION, 2020–2030 ($MILLION)
TABLE 46.EUROPE ARTIFICIAL INTELLIGENCE IN HEALTHCARE MARKET, BY END USER, 2020–2030 ($MILLION)
TABLE 47.GERMANY ARTIFICIAL INTELLIGENCE IN HEALTHCARE MARKET, BY OFFERING, 2020–2030 ($MILLION)
TABLE 48.GERMANY ARTIFICIAL INTELLIGENCE IN HEALTHCARE MARKET, BY ALGORITHMS, 2020–2030 ($MILLION)
TABLE 49.GERMANY ARTIFICIAL INTELLIGENCE IN HEALTHCARE MARKET, BY APPLICATION, 2020–2030 ($MILLION)
TABLE 50.GERMANY ARTIFICIAL INTELLIGENCE IN HEALTHCARE MARKET, BY END USER, 2020–2030 ($MILLION)
TABLE 51.FRANCE ARTIFICIAL INTELLIGENCE IN HEALTHCARE MARKET, BY OFFERING, 2020–2030 ($MILLION)
TABLE 52.FRANCE ARTIFICIAL INTELLIGENCE IN HEALTHCARE MARKET, BY ALGORITHMS, 2020–2030 ($MILLION)
TABLE 53.FRANCE ARTIFICIAL INTELLIGENCE IN HEALTHCARE MARKET, BY APPLICATION, 2020–2030 ($MILLION)
TABLE 54.FRANCE ARTIFICIAL INTELLIGENCE IN HEALTHCARE MARKET, BY END USER, 2020–2030 ($MILLION)
TABLE 55.UK ARTIFICIAL INTELLIGENCE IN HEALTHCARE MARKET, BY OFFERING, 2020–2030 ($MILLION)
TABLE 56.UK ARTIFICIAL INTELLIGENCE IN HEALTHCARE MARKET, BY ALGORITHMS, 2020–2030 ($MILLION)
TABLE 57.UK ARTIFICIAL INTELLIGENCE IN HEALTHCARE MARKET, BY APPLICATION, 2020–2030 ($MILLION)
TABLE 58.UK ARTIFICIAL INTELLIGENCE IN HEALTHCARE MARKET, BY END USER, 2020–2030 ($MILLION)
TABLE 59.ITALY ARTIFICIAL INTELLIGENCE IN HEALTHCARE MARKET, BY OFFERING, 2020–2030 ($MILLION)
TABLE 60.ITALY ARTIFICIAL INTELLIGENCE IN HEALTHCARE MARKET, BY ALGORITHMS, 2020–2030 ($MILLION)
TABLE 61.ITALY ARTIFICIAL INTELLIGENCE IN HEALTHCARE MARKET, BY APPLICATION, 2020–2030 ($MILLION)
TABLE 62.ITALY ARTIFICIAL INTELLIGENCE IN HEALTHCARE MARKET, BY END USER, 2020–2030 ($MILLION)
TABLE 63.SPAIN ARTIFICIAL INTELLIGENCE IN HEALTHCARE MARKET, BY OFFERING, 2020–2030 ($MILLION)
TABLE 64.SPAIN ARTIFICIAL INTELLIGENCE IN HEALTHCARE MARKET, BY ALGORITHMS, 2020–2030 ($MILLION)
TABLE 65.SPAIN ARTIFICIAL INTELLIGENCE IN HEALTHCARE MARKET, BY APPLICATION, 2020–2030 ($MILLION)
TABLE 66.SPAIN ARTIFICIAL INTELLIGENCE IN HEALTHCARE MARKET, BY END USER, 2020–2030 ($MILLION)
TABLE 67.REST OF EUROPE ARTIFICIAL INTELLIGENCE IN HEALTHCARE MARKET, BY OFFERING, 2020–2030 ($MILLION)
TABLE 68.REST OF EUROPE ARTIFICIAL INTELLIGENCE IN HEALTHCARE MARKET, BY ALGORITHMS, 2019–2027 ($MILLION)
TABLE 69.REST OF EUROPE ARTIFICIAL INTELLIGENCE IN HEALTHCARE MARKET, BY APPLICATION, 2020–2030 ($MILLION)
TABLE 70.REST OF EUROPE ARTIFICIAL INTELLIGENCE IN HEALTHCARE MARKET, BY END USER, 2020–2030 ($MILLION)
TABLE 71.ASIA-PACIFIC ARTIFICIAL INTELLIGENCE IN HEALTHCARE MARKET, BY OFFERING, 2020–2030 ($MILLION)
TABLE 72.ASIA-PACIFIC ARTIFICIAL INTELLIGENCE IN HEALTHCARE MARKET, BY ALGORITHMS, 2020–2039 ($MILLION)
TABLE 73.ASIA-PACIFIC ARTIFICIAL INTELLIGENCE IN HEALTHCARE MARKET, BY APPLICATION, 2020–2030($MILLION)
TABLE 74.ASIA-PACIFIC ARTIFICIAL INTELLIGENCE IN HEALTHCARE MARKET, BY END USER, 2020–2030 ($MILLION)
TABLE 75.ASIA-PACIFIC ARTIFICIAL INTELLIGENCE IN HEALTHCARE MARKET, BY COUNTRY, 2020–2030($MILLION)
TABLE 76.JAPAN ARTIFICIAL INTELLIGENCE IN HEALTHCARE MARKET, BY OFFERING, 2020–2030 ($MILLION)
TABLE 77.JAPAN ARTIFICIAL INTELLIGENCE IN HEALTHCARE MARKET, BY ALGORITHMS, 2019–2027 ($MILLION)
TABLE 78.JAPAN ARTIFICIAL INTELLIGENCE IN HEALTHCARE MARKET, BY APPLICATION, 2020–2030 ($MILLION)
TABLE 79.JAPAN ARTIFICIAL INTELLIGENCE IN HEALTHCARE MARKET, BY END USER, 2020–2030 ($MILLION)
TABLE 80.CHINA ARTIFICIAL INTELLIGENCE IN HEALTHCARE MARKET, BY OFFERING, 2020–2030 ($MILLION)
TABLE 81.CHINA ARTIFICIAL INTELLIGENCE IN HEALTHCARE MARKET, BY ALGORITHMS, 2020–2030 ($MILLION)
TABLE 82.CHINA ARTIFICIAL INTELLIGENCE IN HEALTHCARE MARKET, BY APPLICATION, 2020–2030 ($MILLION)
TABLE 83.CHINA ARTIFICIAL INTELLIGENCE IN HEALTHCARE MARKET, BY END USER, 2020–2030($MILLION)
TABLE 84.AUSTRALIA ARTIFICIAL INTELLIGENCE IN HEALTHCARE MARKET, BY OFFERING, 2020–2030 ($MILLION)
TABLE 85.AUSTRALIA ARTIFICIAL INTELLIGENCE IN HEALTHCARE MARKET, BY ALGORITHMS, 2020–2030 ($MILLION)
TABLE 86.AUSTRALIA ARTIFICIAL INTELLIGENCE IN HEALTHCARE MARKET, BY APPLICATION, 2020–2030 ($MILLION)
TABLE 87.AUSTRALIA ARTIFICIAL INTELLIGENCE IN HEALTHCARE MARKET, BY END USER, 2020–2030 ($MILLION)
TABLE 88.INDIA ARTIFICIAL INTELLIGENCE IN HEALTHCARE MARKET, BY OFFERING, 2020–2030 ($MILLION)
TABLE 89.INDIA ARTIFICIAL INTELLIGENCE IN HEALTHCARE MARKET, BY ALGORITHMS, 2020–2030 ($MILLION)
TABLE 90.INDIA ARTIFICIAL INTELLIGENCE IN HEALTHCARE MARKET, BY APPLICATION, 2020–2030 ($MILLION)
TABLE 91.INDIA ARTIFICIAL INTELLIGENCE IN HEALTHCARE MARKET, BY END USER, 2020–2030 ($MILLION)
TABLE 92.SOUTH KOREA ARTIFICIAL INTELLIGENCE IN HEALTHCARE MARKET, BY OFFERING, 2020–2030 ($MILLION)
TABLE 93.SOUTH KOREA ARTIFICIAL INTELLIGENCE IN HEALTHCARE MARKET, BY ALGORITHMS, 2019–2027 ($MILLION)
TABLE 94.SOUTH KOREA ARTIFICIAL INTELLIGENCE IN HEALTHCARE MARKET, BY APPLICATION, 2020–2030($MILLION)
TABLE 95.SOUTH KOREA ARTIFICIAL INTELLIGENCE IN HEALTHCARE MARKET, BY END USER, 2020–2030($MILLION)
TABLE 96.TAIWAN ARTIFICIAL INTELLIGENCE IN HEALTHCARE MARKET, BY OFFERING, 2020–2030 ($MILLION)
TABLE 97.TAIWAN ARTIFICIAL INTELLIGENCE IN HEALTHCARE MARKET, BY ALGORITHMS, 2020–2030 ($MILLION)
TABLE 98.TAIWAN ARTIFICIAL INTELLIGENCE IN HEALTHCARE MARKET, BY APPLICATION, 2020–2030 ($MILLION)
TABLE 99.TAIWAN ARTIFICIAL INTELLIGENCE IN HEALTHCARE MARKET, BY END USER, 2020–2030 ($MILLION)
TABLE 100.REST OF ASIA-PACIFIC ARTIFICIAL INTELLIGENCE IN HEALTHCARE MARKET, BY OFFERING, 2020–2030 ($MILLION)
TABLE 101.REST OF ASIA-PACIFIC ARTIFICIAL INTELLIGENCE IN HEALTHCARE MARKET, BY ALGORITHMS, 2020–2030 ($MILLION)
TABLE 102.REST OF ASIA-PACIFIC ARTIFICIAL INTELLIGENCE IN HEALTHCARE MARKET, BY APPLICATION, 2020–2030 ($MILLION)
TABLE 103.REST OF ASIA-PACIFIC ARTIFICIAL INTELLIGENCE IN HEALTHCARE MARKET, BY END USER, 2020–2030 ($MILLION)
TABLE 104.LAMEA ARTIFICIAL INTELLIGENCE IN HEALTHCARE MARKET, BY OFFERING, 2020–2030 ($MILLION)
TABLE 105.LAMEA ARTIFICIAL INTELLIGENCE IN HEALTHCARE MARKET, BY ALGORITHMS, 2020–2030 ($MILLION)
TABLE 106.LAMEA ARTIFICIAL INTELLIGENCE IN HEALTHCARE MARKET, BY APPLICATION, 2020–2030 ($MILLION)
TABLE 107.LAMEA ARTIFICIAL INTELLIGENCE IN HEALTHCARE MARKET, BY END USER, 2020–2030 ($MILLION)
TABLE 108.LAMEA ARTIFICIAL INTELLIGENCE IN HEALTHCARE MARKET, BY COUNTRY, 2020–2030 ($MILLION)
TABLE 109.BRAZIL ARTIFICIAL INTELLIGENCE IN HEALTHCARE MARKET, BY OFFERING, 2020–2030 ($MILLION)
TABLE 110.BRAZIL ARTIFICIAL INTELLIGENCE IN HEALTHCARE MARKET, BY ALGORITHMS, 2020–2030 ($MILLION)
TABLE 111.BRAZIL ARTIFICIAL INTELLIGENCE IN HEALTHCARE MARKET, BY APPLICATION, 2019–2027 ($MILLION)
TABLE 112.BRAZIL ARTIFICIAL INTELLIGENCE IN HEALTHCARE MARKET, BY END USER, 2020–2030 ($MILLION)
TABLE 113.SAUDI ARABIA ARTIFICIAL INTELLIGENCE IN HEALTHCARE MARKET, BY OFFERING, 2020–2030 ($MILLION)
TABLE 114.SAUDI ARABIA ARTIFICIAL INTELLIGENCE IN HEALTHCARE MARKET, BY ALGORITHMS, 2020–2030 ($MILLION)
TABLE 115.SAUDI ARABIA ARTIFICIAL INTELLIGENCE IN HEALTHCARE MARKET, BY APPLICATION, 2020–2030 ($MILLION)
TABLE 116.SAUDI ARABIA ARTIFICIAL INTELLIGENCE IN HEALTHCARE MARKET, BY END USER, 2020–2030 ($MILLION)
TABLE 117.SOUTH AFRICA ARTIFICIAL INTELLIGENCE IN HEALTHCARE MARKET, BY OFFERING, 2020–2030 ($MILLION)
TABLE 118.SOUTH AFRICA ARTIFICIAL INTELLIGENCE IN HEALTHCARE MARKET, BY ALGORITHMS, 2020–2030 ($MILLION)
TABLE 119.SOUTH AFRICA ARTIFICIAL INTELLIGENCE IN HEALTHCARE MARKET, BY APPLICATION, 2020–2030 ($MILLION)
TABLE 120.SOUTH AFRICA ARTIFICIAL INTELLIGENCE IN HEALTHCARE MARKET, BY END USER, 2020–2030 ($MILLION)
TABLE 121.REST OF LAMEA ARTIFICIAL INTELLIGENCE IN HEALTHCARE MARKET, BY OFFERING, 2020–2030 ($MILLION)
TABLE 122.REST OF LAMEA ARTIFICIAL INTELLIGENCE IN HEALTHCARE MARKET, BY ALGORITHMS, 2020–2030 ($MILLION)
TABLE 123.REST OF LAMEA ARTIFICIAL INTELLIGENCE IN HEALTHCARE MARKET, BY APPLICATION, 2020–2030 ($MILLION)
TABLE 124.REST OF LAMEA ARTIFICIAL INTELLIGENCE IN HEALTHCARE MARKET, BY END USER, 2019–2027 ($MILLION)
LIST OF FIGURES
FIGURE 01.AI IN HEALTHCARE MARKET SEGMENTATION
FIGURE 02.TOP INVESTMENT POCKETS
FIGURE 03.TOP WINNING STRATEGIES, BY YEAR, 2020*
FIGURE 04.TOP WINNING STRATEGIES, BY DEVELOPMENT, 2020* (%)
FIGURE 05.TOP WINNING STRATEGIES, BY COMPANY, 2020*
FIGURE 06.TOP PLAYER POSITIONING, 2020
FIGURE 07.MODERATE BARGAINING POWER OF BUYERS
FIGURE 08.MODERATE BARGAINING POWER OF SUPPLIERS
FIGURE 09.HIGH THREAT OF NEW ENTRANTS
FIGURE 10.LOW THREAT OF SUBSTITUTION
FIGURE 11.HIGH COMPETITIVE RIVALRY
FIGURE 12.IMPACT ANALYSIS
FIGURE 13.COMPARATIVE SHARE ANALYSIS OF HARDWARE ARTIFICIAL INTELLIGENCE IN HEALTHCARE MARKET, BY COUNTRY, 2020 & 2030 (%)
FIGURE 14.COMPARATIVE SHARE ANALYSIS OF SOFTWARE ARTIFICIAL INTELLIGENCE IN HEALTHCARE MARKET, BY COUNTRY, 2020 & 2030 (%)
FIGURE 15.COMPARATIVE SHARE ANALYSIS OF SERVICES ARTIFICIAL INTELLIGENCE IN HEALTHCARE MARKET, BY COUNTRY, 2020 & 2030 (%)
FIGURE 16.COMPARATIVE SHARE ANALYSIS OF DEEP LEARNING ARTIFICIAL INTELLIGENCE IN HEALTHCARE MARKET, BY COUNTRY, 2020 & 2030 (%)
FIGURE 17.COMPARATIVE SHARE ANALYSIS OF QUERYING METHOD ARTIFICIAL INTELLIGENCE IN HEALTHCARE MARKET, BY COUNTRY, 2020 & 2030 (%)
FIGURE 18.COMPARATIVE SHARE ANALYSIS OF NATURAL LANGUAGE PROCESSING ARTIFICIAL INTELLIGENCE IN HEALTHCARE MARKET, BY COUNTRY, 2020 & 2030 (%)
FIGURE 19.COMPARATIVE SHARE ANALYSIS OF CONTEXT AWARE PROCESSING ARTIFICIAL INTELLIGENCE IN HEALTHCARE MARKET, BY COUNTRY, 2020 & 2030 (%)
FIGURE 20.OMPARATIVE SHARE ANALYSIS OF ARTIFICIAL INTELLIGENCE IN HEALTHCARE MARKET FOR ROBOT-ASSISTED SURGERY, BY COUNTRY, 2020 & 2030 (%)
FIGURE 21.COMPARATIVE SHARE ANALYSIS OF ARTIFICIAL INTELLIGENCE IN HEALTHCARE MARKET FOR VIRTUAL NURSING ASSISTANT, BY COUNTRY, 2020 & 2030 (%)
FIGURE 22.COMPARATIVE SHARE ANALYSIS OF ARTIFICIAL INTELLIGENCE IN HEALTHCARE MARKET FOR ADMINISTRATIVE WORKFLOW ASSISTANCE, BY COUNTRY, 2020 & 2030 (%)
FIGURE 23.COMPARATIVE SHARE ANALYSIS OF ARTIFICIAL INTELLIGENCE IN HEALTHCARE MARKET FOR FRAUD DETECTION, BY COUNTRY, 2020 & 2030 (%)
FIGURE 24.COMPARATIVE SHARE ANALYSIS OF ARTIFICIAL INTELLIGENCE IN HEALTHCARE MARKET FOR DOSAGE ERROR REDUCTION, BY COUNTRY, 2020 & 2030 (%)
FIGURE 25.COMPARATIVE SHARE ANALYSIS OF ARTIFICIAL INTELLIGENCE IN HEALTHCARE MARKET FOR CLINICAL TRIAL PARTICIPANT IDENTIFIER, BY COUNTRY, 2020 & 2030 (%)101
FIGURE 26.COMPARATIVE SHARE ANALYSIS OF ARTIFICIAL INTELLIGENCE IN HEALTHCARE MARKET FOR PRELIMINARY DIAGNOSIS, BY COUNTRY, 2020& 2030 (%)
FIGURE 27.COMPARATIVE SHARE ANALYSIS OF ARTIFICIAL INTELLIGENCE IN HEALTHCARE MARKET FOR OTHERS, BY COUNTRY, 2020 & 2030 (%)
FIGURE 28.COMPARATIVE SHARE ANALYSIS OF ARTIFICIAL INTELLIGENCE IN HEALTHCARE MARKET FOR HEALTHCARE PROVIDERS, BY COUNTRY, 2020 & 2030 (%)
FIGURE 29.COMPARATIVE SHARE ANALYSIS OF ARTIFICIAL INTELLIGENCE IN HEALTHCARE MARKET FOR PHARMACEUTICALS & BIOTECHNOLOGY COMPANIES, BY COUNTRY, 2020 & 2030 (%)112
FIGURE 30.COMPARATIVE SHARE ANALYSIS OF ARTIFICIAL INTELLIGENCE IN HEALTHCARE MARKET FOR PATIENTS, BY COUNTRY, 2020 & 2030 (%)
FIGURE 31.COMPARATIVE SHARE ANALYSIS OF ARTIFICIAL INTELLIGENCE IN HEALTHCARE MARKET BY PAYER, BY COUNTRY, 2020 & 2030 (%)
$5769
$6929
$10663
HAVE A QUERY?
OUR CUSTOMER

SIMILAR REPORTS