
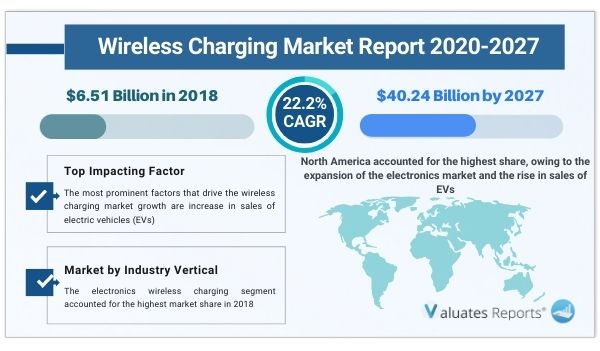
The global wireless charging market size was valued at $6.51 billion in 2018 and is expected to reach $40.24 billion by 2027, growing at a CAGR of 22.2% from 2020 to 2027. The new trend of charging the devices wirelessly called drop & charge is developed by the Humavox Company in which the charge station is defined as a key or box, and the receiver needs to be pressed on the transmitter by an induction charging. Such features prove beneficial to the customer with better product designing, usability, and reliability. The excessive use of the internet creates a charging problem for many smartphones & devices, which can be resolved by using a fast-wireless RF energy base charger. The growth in demand for efficient charging systems is expected to significantly drive the growth of the wireless charging market.
Wireless charging is the transmission of energy from a power source to a consuming device without wires or cables. These devices comprise a charging station (or transmitter) that transmits the energy and a receiver (integrated inside a device) that receives the energy and charges the battery.
The COVID-19 pandemic outbreak impacted the electronics segment of wireless charging market.
Wireless charging is a reliable, convenient, and safe technology to power and charges electrical devices. In addition, it provides efficient, cost-effective, and safer advantages over the traditional charging systems by eliminating the use of physical connectors and cables. Moreover, it maintains continuous transfer of power to ensure all types of devices (handheld industrial devices, smartphones, heavy-duty equipment, and others) are charged and readily available for use.
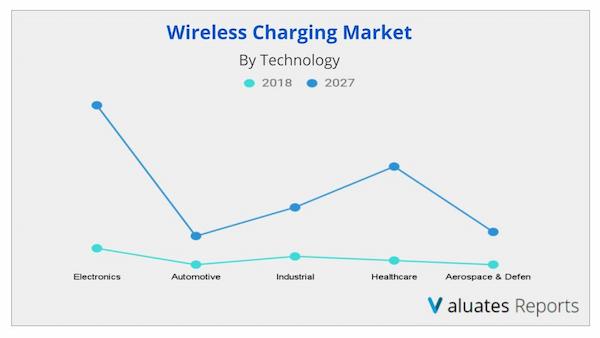
By industry vertical, the market is segregated into electronics, automotive, industrial, healthcare, and aerospace & defense. The electronics wireless charging segment accounted for the highest market share in 2018, whereas the healthcare wireless charging segment is expected to grow at the highest CAGR from 2020 to 2027.
By region, the global wireless charging market trends are analyzed across North America (U.S., Canada, and Mexico), Europe (UK, Germany, Italy, France, and Rest of Europe), Asia-Pacific (China, India, Japan, South Korea, Taiwan and Rest of Asia-Pacific), and LAMEA (Latin America, Middle East, and Africa).
North America accounted for the highest share, owing to the expansion of the electronics market and the rise in sales of EVs. Europe was the second largest contributor in terms of revenue and is expected to witness significant growth during the forecast period, owing to the rise in the demand for fuel-efficient and durable charging system for electronic products such as power tools and portable gadgets.
|
Report Metric |
Details |
|
Report Name |
Wireless Charging Market |
|
Base year |
2019 |
|
Forecast period |
2020-2027 |
|
Units |
Value (USD) |
|
Segments covered |
Type, End User, Offerings, and Region |
|
Geographic regions covered |
North America, APAC, Europe, and RoW |
|
Companies covered |
Amazon, Apple, McGraw Hill, Sybex, Beacon Press, Adobe Press, John Wiley & Sons, Penguin Group, Blackwell Science, Random House, Springer, Bertelsmann Sony, IReader Technology. |
TABLE OF CONTENT
Chapter 1:Introduction
1.1.Report description
1.2.Key benefits for stakeholders
1.3.Key market segments
1.4.Research methodology
1.4.1.Primary research
1.4.2.Secondary research
1.4.3.Analyst tools and models
Chapter 2:Executive Summary
2.1.CXO perspective
Chapter 3:Market Overview
3.1.Market definition and scope
3.2.Technology roadmap
3.3.Key findings
3.3.1.Top impacting factors
3.3.2.Top investment pockets
3.3.3.Top winning strategies
3.4.Porter’s five forces analysis
3.4.1.Moderate-to-high bargaining power of suppliers
3.4.2.Moderate-to-high threat of new entrants
3.4.3.Moderate threat of substitutes
3.4.4.High-to-moderate intensity of rivalry
3.4.5.Moderate bargaining power of buyers
3.5.Key player positioning, 2019
3.6.Value chain analysis
3.6.1.Raw material suppliers
3.6.2.Design and engineering
3.6.3.Manufacturing
3.6.4.Sales & distribution
3.6.5.End Users
3.7.Product launches
3.8.Market dynamics
3.8.1.Drivers
3.8.1.1.Increase in sales of electric vehicles (EVs)
3.8.1.2.Constantly evolving portable electronics and wearables market
3.8.1.3.Necessity to harvest ambient RF energy
3.8.2.Restraint
3.8.2.1.Technology is expensive to integrate and comparatively slower charging
3.8.3.Opportunities
3.8.3.1.Excessive research in far-field wireless charging technologies
3.8.3.2.Trending Internet of Things (IoT)
3.9.COVID-19’s Impact
3.9.1.Impact on market size
3.9.2.Application trends, preferences, and budget impact
3.9.3.Key player strategies to tackle negative impact
Chapter 4: Wireless Charging Market, By Technology
4.1.Overview
4.2.Inductive
4.2.1.Key market trends, growth factors and opportunities
4.2.2. Market size and forecast, by region
4.2.3.Market analysis by country
4.3.Resonant
4.3.1. Key market trends, growth factors, and opportunities
4.3.2.Market size and forecast, by region
4.3.3.Market analysis by country
4.4.Radio frequency
4.4.1.Key market trends, growth factors, and opportunities
4.4.2.Market size and forecast, by region
4.4.3.Market analysis by country
4.5.Others
4.5.1.Key market trends, growth factors, and opportunities
4.5.2.Market size and forecast, by region
4.5.3. Market analysis by country
Chapter 5: Wireless Charging Market, By Industry Vertical
5.1.Overview
5.2.Electronics
5.2.1.Key market trends, growth factors and opportunities
5.2.2.Market size and forecast, by region
5.2.3.Market analysis by country
5.3.Automotive
5.3.1.Key market trends, growth factors and opportunities
5.3.2.Market size and forecast, by region
5.3.3.Market analysis by country
5.4.Industrial
5.4.1.Key market trends, growth factors and opportunities
5.4.2.Market size and forecast, by region
5.4.3.Market analysis by country
5.5.Healthcare
5.5.1.Key market trends, growth factors and opportunities
5.5.2.Market size and forecast, by region
5.5.3.Market analysis by country
5.6.Aerospace & defense
5.6.1.Key market trends, growth factors and opportunities
5.6.2.Market size and forecast, by region
5.6.3.Market analysis by country
Chapter 6:Wireless Charging Market, By Region
6.1.Overview
6.2.North America
6.2.1.Key market trends, growth factors, and opportunities
6.2.2.Market size and forecast, by technology
6.2.3.Market size and forecast, by industry vertical
6.2.4.Market analysis by country
6.2.4.1.U.S.
6.2.4.1.1.Market size and forecast, by technology
6.2.4.1.2.Market size and forecast, by industry vertical
6.2.4.2.Canada
6.2.4.2.1.Market size and forecast, by technology
6.2.4.2.2.Market size and forecast, by industry vertical
6.2.4.3.Mexico
6.2.4.3.1.Market size and forecast, by technology
6.2.4.3.2.Market size and forecast, by industry vertical
6.3.Europe
6.3.1.Key market trends, growth factors, and opportunities
6.3.2.Market size and forecast, by technology
6.3.3.Market size and forecast, by industry vertical
6.3.4.Market analysis by country
6.3.4.1.UK
6.3.4.1.1.Market size and forecast, by technology
6.3.4.1.2.Market size and forecast, by industry vertical
6.3.4.2.Germany
6.3.4.2.1.Market size and forecast, by technology
6.3.4.2.2.Market size and forecast, by industry vertical
6.3.4.3.France
6.3.4.3.1.Market size and forecast, by technology
6.3.4.3.2.Market size and forecast, by industry vertical
6.3.4.4.Italy
6.3.4.4.1.Market size and forecast, by technology
6.3.4.4.2.Market size and forecast, by industry vertical
6.3.4.5.Rest of Europe
6.3.4.5.1.Market size and forecast, by technology
6.3.4.5.2.Market size and forecast, by industry vertical
6.4.Asia-Pacific
6.4.1.Key market trends, growth factors and opportunities
6.4.2.Market size and forecast, by technology
6.4.3. Market size and forecast, by industry vertical
6.4.4. Market analysis by country
6.4.4.1.China
6.4.4.1.1.Market size and forecast, by technology
6.4.4.1.2.Market size and forecast, by industry vertical
6.4.4.2.India
6.4.4.2.1.Market size and forecast, by technology
6.4.4.2.2.Market size and forecast, by industry vertical
6.4.4.3.Japan
6.4.4.3.1.Market size and forecast, by technology
6.4.4.3.2.Market size and forecast, by industry vertical
6.4.4.4.South Korea
6.4.4.4.1.Market size and forecast, by technology
6.4.4.4.2.Market size and forecast, by industry vertical
6.4.4.5.Taiwan
6.4.4.5.1.Market size and forecast, by technology
6.4.4.5.2.Market size and forecast, by industry vertical
6.4.4.6.Rest of Asia-Pacific
6.4.4.6.1.Market size and forecast, by technology
6.4.4.6.2.Market size and forecast, by industry vertical
6.5.LAMEA
6.5.1.Key market trends, growth factors and opportunities
6.5.2.Market size and forecast, by technology
6.5.3.Market size and forecast, by industry vertical
6.5.4.Market analysis by country
6.5.4.1.Latin America
6.5.4.1.1.Market size and forecast, by technology
6.5.4.1.2.Market size and forecast, by industry vertical
6.5.4.2.Middle East
6.5.4.2.1.Market size and forecast, by technology
6.5.4.2.2.Market size and forecast, by industry vertical
6.5.4.3.Africa
6.5.4.3.1.Market size and forecast, by technology
6.5.4.3.2.Market size and forecast, by industry vertical
Chapter 7:Company Profiles
7.1.ENERGIZER HOLDINGS, INC.
7.1.1.Company overview
7.1.2.Company snapshot
7.1.3.Operating business segments
7.1.4.Product portfolio
7.1.5.Business performance
7.1.6.Key strategic moves and developments
7.2.FULTON INNOVATION LLC
7.2.1.Company overview
7.2.2.Company snapshot
7.2.3.Operating business segments
7.2.4.Product portfolio
7.2.5.Key strategic moves and developments
7.3.RENESAS ELECTRONICS CORPORATION (INTERATED DEVICE TECHNOLOGY, INC.)
7.3.1.Company overview
7.3.2.Company snapshot
7.3.3.Operating business segments
7.3.4.Product portfolio
7.3.5.Business performance
7.3.6.Key strategic moves and developments
7.4. MURATA MANUFACTURING COMPANY, LTD.
7.4.1.Company overview
7.4.2.Company snapshot
7.4.3.Operating business segments
7.4.4.Product portfolio
7.4.5.Business performance
7.4.6.Key strategic moves and developments
7.5.POWERMAT TECHNOLOGIES LTD.
7.5.1.Company overview
7.5.2.Company snapshot
7.5.3.Operating business segments
7.5.4.Product portfolio
7.5.5.Key strategic moves and developments
7.6.QUALCOMM TECHNOLOGIES, INC
7.6.1.Company overview
7.6.2.Company snapshot
7.6.3.Operating business segments
7.6.4.Product portfolio
7.6.5.Business performance
7.6.6.Key strategic moves and developments
7.7.SAMSUNG ELECTRONICS CO., LTD.
7.7.1.Company overview
7.7.2.Company snapshot
7.7.3.Operating business segments
7.7.4.Product portfolio
7.7.5.Business performance
7.7.6.Key strategic moves and developments
7.8. SONY CORPORATION
7.8.1.Company overview
7.8.2.Company snapshot
7.8.3.Operating business segments
7.8.4.Product portfolio
7.8.5.Business performance
7.8.6.Key strategic moves and developments
7.9.TEXAS INSTRUMENTS INC.
7.9.1.Company overview
7.9.2.Company snapshot
7.9.3.Operating business segments
7.9.4.Product portfolio
7.9.5.Business performance
7.9.6.Key strategic moves and developments
7.10.WITRICITY CORPORATION
7.10.1.Company overview
7.10.2.Company snapshot
7.10.3.Operating business segments
7.10.4.Product portfolio
7.10.5.Key strategic moves and developments
TABLE 01. NEW PRODUCT LAUNCHES
TABLE 02. GLOBAL WIRELESS CHARGING MARKET, BY TECHNOLOGY, 2018-2027($MILLION)
TABLE 03. WIRELESS CHARGING MARKET REVENUE FOR INDUCTIVE, BY REGION 2018-2027 ($MILLION)
TABLE 04. WIRELESS CHARGING MARKET REVENUE FOR RESONANT, BY REGION 2018-2027 ($MILLION)
TABLE 05. WIRELESS CHARGING MARKET REVENUE FOR RADIO FREQUENCY, BY REGION 2018–2027 ($MILLION)
TABLE 06. WIRELESS CHARGING MARKET REVENUE FOR OTHERS, BY REGION 2018–2027 ($MILLION)
TABLE 07. GLOBAL WIRELESS CHARGING MARKET, BY INDUSTRY VERTICAL, 2018–2027 ($MILLION)
TABLE 08. WIRELESS CHARGING MARKET REVENUE FOR ELECTRONICS, BY REGION 2018–2027 ($MILLION)
TABLE 09. WIRELESS CHARGING MARKET REVENUE FOR AUTOMOTIVE, BY REGION 2018-2027 ($MILLION)
TABLE 10. WIRELESS CHARGING MARKET REVENUE FOR INDUSTRIAL, BY REGION, 2018–2027 ($MILLION)
TABLE 11. WIRELESS CHARGING MARKET REVENUE FOR HEALTHCARE, BY REGION, 2018–2027 ($MILLION)
TABLE 12. WIRELESS CHARGING MARKET REVENUE FOR AEROSPACE & DEFENSE, BY REGION, 2018–2027 ($MILLION)
TABLE 13. GLOBAL WIRELESS CHARGING MARKET, BY REGION, 2018–2027 ($MILLION)
TABLE 14. NORTH AMERICA WIRELESS CHARGING MARKET, BY TECHNOLOGY, 2018–2027 ($MILLION)
TABLE 15. NORTH AMERICA WIRELESS CHARGING MARKET, BY INDUSTRY VERTICAL, 2018–2027 ($MILLION)
TABLE 16. U.S. WIRELESS CHARGING MARKET, BY TECHNOLOGY, 2018–2027 ($MILLION)
TABLE 17. U.S. WIRELESS CHARGING MARKET, BY INDUSTRY VERTICAL, 2018–2027 ($MILLION)
TABLE 18. CANADA WIRELESS CHARGING MARKET, BY TECHNOLOGY, 2018–2027 ($MILLION)
TABLE 19. CANADA WIRELESS CHARGING MARKET, BY INDUSTRY VERTICAL, 2018–2027 ($MILLION)
TABLE 20. MEXICO WIRELESS CHARGING MARKET, BY TECHNOLOGY, 2018–2027 ($MILLION)
TABLE 21. MEXICO WIRELESS CHARGING MARKET, BY INDUSTRY VERTICAL, 2018–2027 ($MILLION)
TABLE 22. EUROPE WIRELESS CHARGING MARKET, BY TECHNOLOGY, 2018–2027 ($MILLION)
TABLE 23. EUROPE WIRELESS CHARGING MARKET, BY INDUSTRY VERTICAL, 2018–2027 ($MILLION)
TABLE 24. UK WIRELESS CHARGING MARKET, BY TECHNOLOGY, 2018–2027 ($MILLION)
TABLE 25. UK WIRELESS CHARGING MARKET, BY INDUSTRY VERTICAL, 2018–2027 ($MILLION)
TABLE 26. GERMANY WIRELESS CHARGING MARKET, BY TECHNOLOGY, 2018–2027 ($MILLION)
TABLE 27. GERMANY WIRELESS CHARGING MARKET, BY INDUSTRY VERTICAL, 2018-2027 ($MILLION)
TABLE 28. FRANCE WIRELESS CHARGING MARKET, BY TECHNOLOGY, 2018–2027 ($MILLION)
TABLE 29. FRANCE WIRELESS CHARGING MARKET, BY INDUSTRY VERTICAL, 2018–2027 ($MILLION)
TABLE 30. ITALY WIRELESS CHARGING MARKET, BY TECHNOLOGY, 2018–2027 ($MILLION)
TABLE 31. ITALY ELECTRIC VEHICLE MARKET, BY INDUSTRY VERTICAL, 2018–2027 ($MILLION)
TABLE 32. REST OF EUROPE WIRELESS CHARGING MARKET, BY TECHNOLOGY, 2018–2027 ($MILLION)
TABLE 33. REST OF EUROPE WIRELESS CHARGING MARKET, BY INDUSTRY VERTICAL, 2018–2027 ($MILLION)
TABLE 34. ASIA-PACIFIC WIRELESS CHARGING MARKET, BY TECHNOLOGY 2018-2027 ($MILLION)
TABLE 35. ASIA-PACIFIC WIRELESS CHARGING MARKET, BY INDUSTRY VERTICAL 2018–2027 ($MILLION)
TABLE 36. CHINA WIRELESS CHARGING MARKET, BY TECHNOLOGY 2018–2027 ($MILLION)
TABLE 37. CHINA WIRELESS CHARGING MARKET, BY INDUSTRY VERTICAL 2018–2027 ($MILLION)
TABLE 38. INDIA WIRELESS CHARGING MARKET, BY TECHNOLOGY 2018–2027 ($MILLION)
TABLE 39. INDIA WIRELESS CHARGING MARKET, BY INDUSTRY VERTICAL 2018–2027 ($MILLION)
TABLE 40. JAPAN WIRELESS CHARGING MARKET, BY TECHNOLOGY 2018–2027 ($MILLION)
TABLE 41. JAPAN WIRELESS CHARGING MARKET, BY INDUSTRY VERTICAL 2018-2027 ($MILLION)
TABLE 42. SOUTH KOREA WIRELESS CHARGING MARKET, BY TECHNOLOGY 2018–2027 ($MILLION)
TABLE 43. SOUTH KOREA WIRELESS CHARGING MARKET, BY INDUSTRY VERTICAL 2018–2027 ($MILLION)
TABLE 44. TAIWAN WIRELESS CHARGING MARKET, BY TECHNOLOGY 2018–2027 ($MILLION)
TABLE 45. TAIWAN WIRELESS CHARGING MARKET, BY INDUSTRY VERTICAL 2018–2027 ($MILLION)
TABLE 46. REST OF ASIA-PACIFIC WIRELESS CHARGING MARKET, BY TECHNOLOGY 2018–2027 ($MILLION)
TABLE 47. REST OF ASIA-PACIFIC WIRELESS CHARGING MARKET, BY INDUSTRY VERTICAL 2018-2027 ($MILLION)
TABLE 48. LAMEA WIRELESS CHARGING MARKET, BY TECHNOLOGY 2018–2027 ($MILLION)
TABLE 49. LAMEA WIRELESS CHARGING MARKET, BY INDUSTRY VERTICAL 2018–2027 ($MILLION)
TABLE 50. LATIN AMERICA WIRELESS CHARGING MARKET, BY TECHNOLOGY 2018-2027 ($MILLION)
TABLE 51. LATIN AMERICA WIRELESS CHARGING MARKET, BY INDUSTRY VERTICAL 2018–2027 ($MILLION)
TABLE 52. MIDDLE EAST WIRELESS CHARGING MARKET, BY TECHNOLOGY 2018–2027 ($MILLION)
TABLE 53. MIDDLE EAST WIRELESS CHARGING MARKET, BY INDUSTRY VERTICAL 2018-2027 ($MILLION)
TABLE 54. AFRICA WIRELESS CHARGING MARKET, BY TECHNOLOGY 2018-2027 ($MILLION)
TABLE 55. AFRICA WIRELESS CHARGING MARKET, BY INDUSTRY VERTICAL 2018-2027 ($MILLION)
TABLE 56. ENERGIZER HOLDINGS: COMPANY SNAPSHOT
TABLE 57. ENERGIZER HOLDINGS: PRODUCT PORTFOLIO
TABLE 58. FULTON INNOVATION: COMPANY SNAPSHOT
TABLE 59. FULTON INNOVATION: SEGMENTS 2
TABLE 60. FULTON INNOVATION: PRODUCT PORTFOLIO
TABLE 61. RENESAS ELECTRONICS CORPORATION: COMPANY SNAPSHOT
TABLE 62. RENESAS ELECTRONICS CORPORATION: SEGMENTS
TABLE 63. RENESAS ELECTRONICS CORPORATION: PRODUCT PORTFOLIO
TABLE 64. MURATA MANUFACTURING: COMPANY SNAPSHOT
TABLE 65. MURATA MANUFACTURING: OPERATING SEGMENTS
TABLE 66. MURATA MANUFACTURING: PRODUCT PORTFOLIO
TABLE 67. POWERMAT TECHNOLOGIES: COMPANY SNAPSHOT
TABLE 68. POWERMAT TECHNOLOGIES: OPERATING SEGMENTS
TABLE 69. POWERMAT TECHNOLOGIES: PRODUCT PORTFOLIO
TABLE 70. QUALCOMM TECHNOLOGIES: COMPANY SNAPSHOT
TABLE 71. QUALCOMM TECHNOLOGIES: OPERATING SEGMENTS
TABLE 72. QUALCOMM TECHNOLOGIES: PRODUCT PORTFOLIO
TABLE 73. SAMSUNG ELECTRONICS: COMPANY SNAPSHOT
TABLE 74. SAMSUNG ELECTRONICS: OPERATING SEGMENTS
TABLE 75. SAMSUNG ELECTRONICS: PRODUCT PORTFOLIO
TABLE 76. SONY: COMPANY SNAPSHOT
TABLE 77. SONY CORPORATION: OPERATING SEGMENTS
TABLE 78. SONY CORPORATION: PRODUCT PORTFOLIO
TABLE 79. TEXAS INSTRUMENTS: COMPANY SNAPSHOT
TABLE 80. TEXAS INSTRUMENTS: OPERATING SEGMENTS
TABLE 81. TEXAS INSTRUMENTS: PRODUCT PORTFOLIO
TABLE 82. WITRICITY CORPORATION: COMPANY SNAPSHOT
TABLE 83. WITRICITY CORPORATION: OPERATING SEGMENTS
TABLE 84. WITRICITY CORPORATION: PRODUCT PORTFOLIO
LIST OF FIGURES
FIGURE 01. KEY MARKET SEGMENTS
FIGURE 02. EXECUTIVE SUMMARY
FIGURE 03. EXECUTIVE SUMMARY
FIGURE 04. TOP IMPACTING FACTORS
FIGURE 05. TOP INVESTMENT POCKETS
FIGURE 06. TOP WINNING STRATEGIES, BY YEAR, 2015-2020*
FIGURE 07. TOP WINNING STRATEGIES, BY DEVELOPMENT, 2015-2020*
FIGURE 08. TOP WINNING STRATEGIES, BY COMPANY, 2015-2020*
FIGURE 09. LOW-TO-MODERATE BARGAINING POWER OF SUPPLIERS
FIGURE 10. MODERATE THREAT OF NEW ENTRANTS
FIGURE 11. HIGH THREAT OF SUBSTITUTES
FIGURE 12. MODERATE-TO-HIGH INTENSITY OF RIVALRY
FIGURE 13. MODERATE BARGAINING POWER OF BUYERS
FIGURE 14. MARKET PLAYER POSITIONING, 2018
FIGURE 15. VALUE CHAIN ANALYSIS
FIGURE 16. ELECTRIC CAR DEPLOYMENT IN SELECTED COUNTRIES, 2013-2018
FIGURE 17. IOT DEVICE CONNECTIONS, 2016-2022
FIGURE 18. GLOBAL WIRELESS CHARGING MARKET SHARE, BY TECHNOLOGY, 2018–2027 (%)
FIGURE 19. COMPARATIVE SHARE ANALYSIS OF INDUCTIVE WIRELESS CHARGING MARKET, BY COUNTRY, 2018 & 2027 (%)
FIGURE 20. COMPARATIVE SHARE ANALYSIS OF RESONANT WIRELESS CHARGING MARKET, BY COUNTRY, 2018 & 2027 (%)
FIGURE 21. COMPARATIVE SHARE ANALYSIS OF WIRELESS CHARGING MARKET FOR RADIO FREQUENCY, BY COUNTRY, 2018 & 2027 (%)
FIGURE 22. COMPARATIVE SHARE ANALYSIS OF WIRELESS CHARGING MARKET FOR OTHERS, BY COUNTRY, 2018 & 2027 (%)
FIGURE 23. GLOBAL WIRELESS CHARGING MARKET SHARE, BY INDUSTRY, 2018–2027 (%)
FIGURE 24. COMPARATIVE SHARE ANALYSIS OF WIRELESS CHARGING MARKET FOR ELECTRONICS, BY COUNTRY, 2018 & 2027 (%)
FIGURE 25. INSTALLATION OF ELECTRIC LDV CHARGERS, 2013-2018 (MILLION UNITS)
FIGURE 26. COMPARATIVE SHARE ANALYSIS OF WIRELESS CHARGING MARKET FOR AUTOMOTIVE, BY COUNTRY, 2018 & 2027 (%)
FIGURE 27. COMPARATIVE SHARE ANALYSIS OF WIRELESS CHARGING MARKET FOR INDUSTRIAL, BY COUNTRY, 2018 & 2027 (%)
FIGURE 28. COMPARATIVE SHARE ANALYSIS OF WIRELESS CHARGING MARKET FOR HEALTHCARE, BY COUNTRY, 2018 & 2027 (%)
FIGURE 29. COMPARATIVE SHARE ANALYSIS OF WIRELESS CHARGING MARKET FOR AEROSPACE & DEFENSE, BY COUNTRY, 2018 & 2027 (%)
FIGURE 30. GLOBAL WIRELESS CHARGING MARKET, BY REGION, 2018-2027
FIGURE 31. COMPARATIVE SHARE ANALYSIS OF NORTH AMERICA WIRELESS CHARGING MARKET, BY COUNTRY, 2018-2027 (%)
FIGURE 32. U.S. WIRELESS CHARGING MARKET, 2018–2027 ($MILLION)
FIGURE 33. CANADA WIRELESS CHARGING MARKET, 2018–2027 ($MILLION)
FIGURE 34. MEXICO WIRELESS CHARGING MARKET, 2018–2027 ($MILLION)
FIGURE 35. COMPARATIVE SHARE ANALYSIS OF EUROPE WIRELESS CHARGING MARKET, BY COUNTRY, 2018-2027 (%)
FIGURE 36. UK WIRELESS CHARGING MARKET, 2018–2027 ($MILLION)
FIGURE 37. GERMANY ELECTRIC VEHICLE MARKET, 2018–2027 ($MILLION)
FIGURE 38. FRANCE ELECTRIC VEHICLEMARKET, 2018–2027 ($MILLION)
FIGURE 39. ITALY ELECTRIC VEHICLEMARKET, 2018–2027 ($MILLION)
FIGURE 40. REST OF EUROPE WIRELESS CHARGING MARKET, 2018–2027 ($MILLION)
FIGURE 41. COMPARATIVE SHARE ANALYSIS OF ASIA-PACIFIC WIRELESS CHARGING MARKET, BY COUNTRY, 2018-2027 (%)
FIGURE 42. CHINA WIRELESS CHARGING MARKET, 2018–2027 ($MILLION)
FIGURE 43. INDIA WIRELESS CHARGING MARKET, 2018–2027 ($MILLION)
FIGURE 44. JAPAN WIRELESS CHARGING MARKET, 2018–2027 ($MILLION)
FIGURE 45. SOUTH KOREA WIRELESS CHARGING MARKET, 2018–2027 ($MILLION)
FIGURE 46. TAIWAN WIRELESS CHARGING MARKET, 2018–2027 ($MILLION)
FIGURE 47. REST OF ASIA-PACIFIC WIRELESS CHARGING MARKET, 2018–2027 ($MILLION)
FIGURE 48. COMPARATIVE SHARE ANALYSIS OF LAMEA WIRELESS CHARGING MARKET, BY COUNTRY, 2018-2027 (%)
FIGURE 49. LATIN AMERICA WIRELESS CHARGING MARKET, 2018–2027 ($MILLION)
FIGURE 50. MIDDLE EAST WIRELESS CHARGING MARKET, 2018–2027 ($MILLION)
FIGURE 51. AFRICA WIRELESS CHARGING MARKET, 2018–2027 ($MILLION)
FIGURE 52. ENERGIZER HOLDINGS: NET SALES, 2017-2019 ($MILLION)
FIGURE 53. ENERGIZER HOLDINGS: REVENUE SHARE BY PRODUCT, 2019 (%)
FIGURE 54. ENERGIZER HOLDINGS: REVENUE SHARE BY REGION, 2019 (%)
FIGURE 55. RENESAS ELECTRONICS CORPORATION: NET SALES, 2016–2018 ($MILLION)
FIGURE 56. RENESAS ELECTRONICS CORPORATION: REVENUE SHARE BY SEGMENT, 2018 (%)
FIGURE 57. RENESAS ELECTRONICS CORPORATION: REVENUE SHARE BY REGION, 2018 (%)
FIGURE 58. MURATA MANUFACTURING: NET SALES, 2016–2018 ($MILLION)
FIGURE 59. MURATA MANUFACTURING: REVENUE SHARE BY PRODUCT, 2018 (%)
FIGURE 60. MURATA MANUFACTURING: REVENUE SHARE BY REGION, 2018 (%)
FIGURE 61. QUALCOMM TECHNOLOGIES: NET SALES, 2016–2018 ($MILLION)
FIGURE 62. QUALCOMM TECHNOLOGIES: REVENUE SHARE BY SEGMENT, 2018 (%)
FIGURE 63. QUALCOMM TECHNOLOGIES: REVENUE SHARE BY REGION, 2018 (%)
FIGURE 64. SAMSUNG ELECTRONICS: NET SALES, 2016–2018 ($MILLION)
FIGURE 65. SAMSUNG ELECTRONICS: REVENUE SHARE BY SEGMENT, 2018 (%)
FIGURE 66. SAMSUNG ELECTRONICS: REVENUE SHARE BY REGION, 2018 (%)
FIGURE 67. SONY CORPORATION: NET SALES, 2017–2019 ($MILLION)
FIGURE 68. SONY CORPORATION: REVENUE SHARE BY SEGMENT, 2019 (%)
FIGURE 69. SONY CORPORATION: REVENUE SHARE BY REGION, 2019 (%)
FIGURE 70. TEXAS INSTRUMENTS: NET SALES, 2016–2018 ($MILLION)
FIGURE 71. TEXAS INSTRUMENTS: REVENUE SHARE BY SEGMENT, 2018 (%)
FIGURE 72. TEXAS INSTRUMENTS: REVENUE SHA
$5769
$6450
$8995
HAVE A QUERY?
OUR CUSTOMER
