FEATURED COMPANIES
Volkswagen AG
Cymbet Corporation Front Edge
Infinite Power Solution
Seeo Inc. (Robert Bosch GmbH Subsidiary) Saft
Excellatron Solid State
BrightVolt
PATHION
Solid Power
Samsung SDI Co. Ltd.
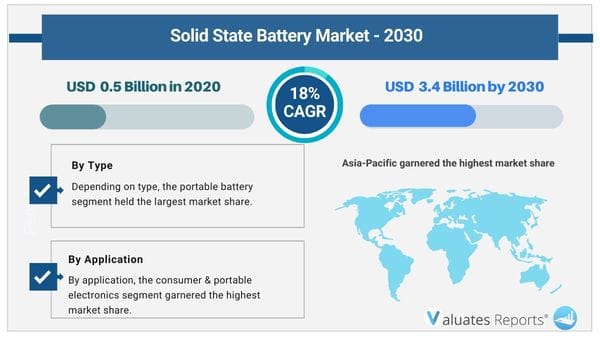
Solid State Battery Market Statistics - 2030
The global solid state battery market size was valued at $0.5 Billion in 2020, and is projected to reach $3.4 Billion by 2030, growing at a CAGR of 18% from 2021 to 2030.
Key drivers of the solid-state battery market include huge scope for application in consumer electronics. Solid state batteries are gradually finding use in the MedTech industry which will fuel the growth of the market in the coming years. Automobile manufacturers are actively investing in improving solid-state battery performance, in turn, driving the growth of the market.
Solid-state batteries are safer, more stable, and have higher energy densities compared to conventional Li-ion batteries with liquid electrolytes. They are used in various applications, including consumer electronics, electric vehicle, energy harvesting, medical devices, smart cards, and wireless communication. The global market has been analyzed based on revenue generated from the sales of commercialized solid-state batteries. In addition, investment from industry giants such as Apple, Samsung, Volkswagen, and BMW have been analyzed for deriving the numbers.
Solid State Battery Market Trends
Consumer electronics
Cordless electronic items are getting smaller and lighter. This makes them easier to use. The devices have different requirements and operate at different temperatures. The power source needs to be small, light, and have a high energy density. Solid-state batteries are longer-lasting and can function properly in humid conditions. This will positively impact the solid-state battery market in the coming years. The batteries are capable of charging quickly and are superior to lithium-ion battery as it does not have any liquid-gel electrolyte. It is easier to assemble and prevents thermal runaway in many electronic devices. The batteries support different capacities, sizes, and dimensions. The devices are intrinsically safe and do not cause any fire, leakage, or explosion. The technology employs electrodes and electrolytes in a solid state. The materials used are solid polymers, ceramics, oxides, phosphates, etc making it ideal for use in wearable devices and portable electronic items.
Medical device wearables
New battery designs are capable of changing the way smart healthcare implants work. Telemedicine and telemonitoring devices are driving the spread of medical implants that measure the core vitals of patients such as blood pressure, sugar levels, pulse monitoring, etc. Moreover, the spread of IoT devices has led to the miniaturization of electronic devices with smart sensors embedded for transmitting crucial data. They rely extensively on the internet. Hence the need for an efficient power source will augment the growth of the solid-state battery market in the upcoming years. The current large physical size of lithium-ion batteries makes them unsuitable for use in medical implants. This restricts the overall applications. The inherent battery electrolyte reacts with the oxygen present in the cathode to create a self-sustaining fire. The same electrolyte contains elements that are toxic. Solid state batteries are smaller, have greater power density, and provide a longer lifespan. The solid electrolytes prevent any instances of hazardous situations. Power-efficient electronic components benefit the most from solid-state battery performance.
Electric Vehicles
Lithium-ion is the sought-after material for an EV battery. However solid-state batteries consume more energy in less material. The solid ceramic material is used for carrying the electric current which makes the batteries lighter, faster to charge, and cheaper. Lithium-ion EV batteries have lower charging cycles and start to degrade eventually. On the other hand, solid-state batteries have higher electrochemical stability and are more reliable and compact in nature. The recharge capacity is more than regular batteries and has a higher energy density. This increase the operational safety of vehicles and provides a longer traveling range than their lithium coin-cell counterparts. This will bolster the growth of the solid-state battery market in the upcoming years. It does not contain any added volatile element. Hence automobile manufacturers are investing rapidly to improve the performance of solid-state batteries.
Complex manufacturing processes
Solid-state batteries are generally more expensive than other conventional batteries. The cost of the fabrication of the cells is high and there is a requirement for complex equipment. Battery manufacturers are finding it difficult to obtain highly efficient electrodes at cheaper prices. This will deter the growth of the solid-state battery market in the upcoming years. Mass production and manufacturing are still far away. On the other hand, lithium-ion batteries are abundantly available and easier to get. The suitable material for a solid-state electrolyte with superior ionic conductivity is still not available to produce commercially.
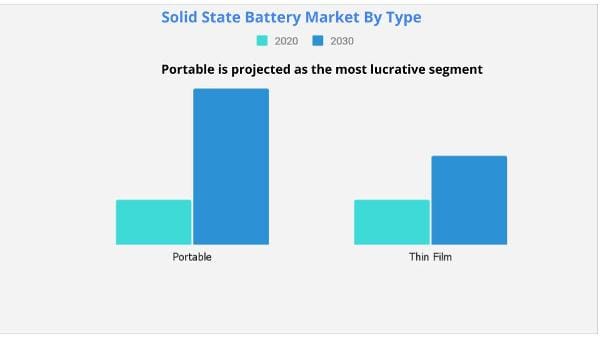
Solid State Battery Market By Type
Based on type, the portable segment will witness considerable growth opportunities in the solid state battery market share due to the extensive use of portable devices and rapid urbanization.
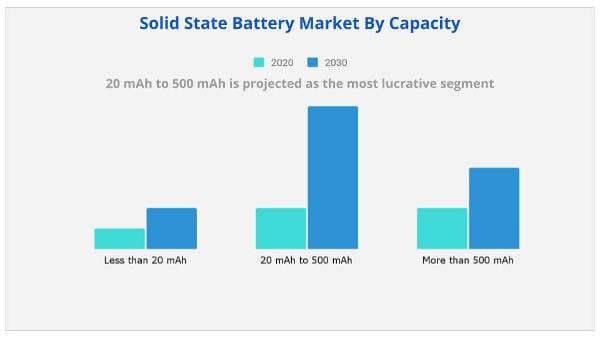
Solid State Battery Market By Capacity
Based on capacity, the 20 mAh-500 mAh segment will be the most lucrative during the forecast period due to the huge demand for solid-state batteries from many applications such as consumer electronics, energy storage, and the wearables industry.
Solid State Battery Market By Application
Based on application, the consumer and portable electronics segment will grow the highest in the solid state battery market share due to rising safety concerns against liquid-based electrolytes and increasing consumer spending on consumer electronic items like laptops, smartphones, tablets, PCs, etc.
Solid State Battery Market By Region
Based on region, Asia-pacific will maintain dominance due to the presence of a huge consumer base in emerging countries like India, and China and the increasing use of battery energy storage systems. The development of the renewable energy industry will also contribute to the growth of the market.
Key Benefits For Stakeholders
- This report provides a quantitative analysis of the market segments, current trends, estimations, and dynamics of the solid state battery market analysis from 2020 to 2030 to identify the prevailing solid state battery market opportunities.
- The market research is offered along with information related to key drivers, restraints, and opportunities.
- Porter's five forces analysis highlights the potency of buyers and suppliers to enable stakeholders make profit-oriented business decisions and strengthen their supplier-buyer network.
- In-depth analysis of the solid state battery market segmentation assists to determine the prevailing market opportunities.
- Major countries in each region are mapped according to their revenue contribution to the global market.
- Market player positioning facilitates benchmarking and provides a clear understanding of the present position of the market players.
- The report includes the analysis of the regional as well as global solid state battery market trends, key players, market segments, application areas, and market growth strategies.
Solid State Battery Market Segment By Type
Solid State Battery Market Segment By Application
Solid State Battery Market Segment By Capacity
- Less than 20 mAh
- 20 mAh to 500 mAh
- More than 500 mAh
By Region
North America
Europe
- UK
- Germany
- France
- Denmark
- Finland
- Rest of Europe
Asia-Pacific
- China
- Japan
- South Korea
- Australia
- Rest of Asia-Pacific
Solid State Battery Market Report Coverage
|
Report Metric |
Details |
|
Base Year: |
2020 |
|
Market Size in 2020: |
USD 0.5 Billion |
|
Forecast Period: |
2020 to 2030 |
|
Forecast Period 2022 to 2031 CAGR: |
18% |
|
2030 Value Projection: |
USD 3.4 Billion |
|
No. of Pages: |
230 |
|
Tables & Figures |
63 |
|
Charts |
136 |
|
Segments covered: |
By Type, by Capacity, by Application, by End User, by Region |
Frequently Asked Questions About This Report
1. What will drive the market size of Solid State Battery?
Ans. Investment from industry giants such as Apple, Samsung, Volkswagen, and BMW have been analyzed for deriving the numbers in Solid State Battery Market during the forecast period.
2. How big is the Solid State Battery Market?
Ans. Solid State Battery market size was valued at $0.5 billion in 2020, and is projected to reach $3.4 billion by 2030, growing at a CAGR of 18% from 2021 to 2030.
3. What is the market value of Solid State Battery Market in 2020?
Ans. The global Solid State Battery market value was valued at $0.5 billion in 2020.
4. Which region holds the largest market share of the Solid State Battery?
Ans. Asia-Pacific garnered the highest market share in the year 2020, in terms of revenue, and is anticipated to maintain its dominance throughout the forecast period in Solid State Battery market.
5. What would be forecast period in the Solid State Battery market report?
Ans. The forecast period considered for the global Solid State Battery market is 2020 to 2030.
6. Which segment by application will maintain the lead throughout the forecast period?
Ans. By application, the consumer & portable electronics segment garnered the highest market share in 2020.
FEATURED COMPANIES
Volkswagen AG
Cymbet Corporation Front Edge
Infinite Power Solution
Seeo Inc. (Robert Bosch GmbH Subsidiary) Saft
Excellatron Solid State
BrightVolt
PATHION
Solid Power
Samsung SDI Co. Ltd.
LIST OF TABLES
- TABLE 1. GLOBAL SOLID STATE BATTERY MARKET, BY APPLICATION, 2020-2030,($MILLION)
TABLE 2. SOLID STATE BATTERY MARKET FOR CONSUMER AND PORTABLE ELECTRONICS, BY REGION , 2020-2030,($MILLION)
TABLE 3. SOLID STATE BATTERY MARKET REVENUE, FOR ELECTRIC VEHICLE, BY REGION , 2020-2030,($MILLION)
TABLE 4. SOLID STATE BATTERY MARKET REVENUE, FOR ENERGY HARVESTING, BY REGION , 2020-2030,($MILLION)
TABLE 5. SOLID STATE BATTERY MARKET REVENUE, FOR WEARABLE AND MEDICAL DEVICES, BY REGION , 2020-2030,($MILLION)
TABLE 6. SOLID STATE BATTERY MARKET REVENUE, FOR OTHERS, BY REGION , 2020-2030,($MILLION)
TABLE 7. GLOBAL SOLID STATE BATTERY MARKET, BY TYPE, 2020-2030,($MILLION)
TABLE 8. SOLID STATE BATTERY MARKET REVENUE, FOR PORTABLE, BY REGION , 2020-2030,($MILLION)
TABLE 9. SOLID STATE BATTERY MARKET REVENUE, FOR THIN FILM, BY REGION , 2020-2030,($MILLION)
TABLE10. GLOBAL SOLID STATE BATTERY MARKET, BY CAPACITY, 2020-2030,($MILLION)
TABLE 11. SOLID STATE BATTERY MARKET REVENUE, FOR LESS THAN 20 MAH, BY REGION , 2020-2030,($MILLION)
TABLE 12. SOLID STATE BATTERY MARKET REVENUE, FOR 20 MAH TO 500 MAH, BY REGION , 2020-2030,($MILLION)
TABLE 13. SOLID STATE BATTERY MARKET REVENUE, FOR MORE THAN 500 MAH, BY REGION , 2020-2030,($MILLION)
TABLE 14. SOLID STATE BATTERY MARKET, BY REGION, 2020-2030,($MILLION)
TABLE 15. NORTH AMERICA SOLID STATE BATTERY MARKET, BY APPLICATION, 2020-2030,($MILLION)
TABLE 16. NORTH AMERICA SOLID STATE BATTERY MARKET, BY TYPE, 2020-2030,($MILLION)
TABLE 17. NORTH AMERICA SOLID STATE BATTERY MARKET, BY CAPACITY, 2020-2030,($MILLION)
TABLE 18. NORTH AMERICA SOLID STATE BATTERY MARKET, BY COUNTRY, 2020-2030,($MILLION)
TABLE 19. U.S. SOLID STATE BATTERY MARKET BY APPLICATION 2020-2030,($MILLION)
TABLE 20. U.S. SOLID STATE BATTERY MARKET BY TYPE 2020-2030,($MILLION)
TABLE 21. U.S. SOLID STATE BATTERY MARKET BY CAPACITY 2020-2030,($MILLION)
TABLE 22. CANADA SOLID STATE BATTERY MARKET BY APPLICATION 2020-2030,($MILLION)
TABLE 23. CANADA SOLID STATE BATTERY MARKET BY TYPE 2020-2030,($MILLION)
TABLE 24. CANADA SOLID STATE BATTERY MARKET BY CAPACITY 2020-2030,($MILLION)
TABLE 25. MEXICO SOLID STATE BATTERY MARKET BY APPLICATION 2020-2030,($MILLION)
TABLE 26. MEXICO SOLID STATE BATTERY MARKET BY TYPE 2020-2030,($MILLION)
TABLE 27. MEXICO SOLID STATE BATTERY MARKET BY CAPACITY 2020-2030,($MILLION)
TABLE 28. EUROPE SOLID STATE BATTERY MARKET, BY APPLICATION, 2020-2030,($MILLION)
TABLE 29. EUROPE SOLID STATE BATTERY MARKET, BY TYPE, 2020-2030,($MILLION)
TABLE 30. EUROPE SOLID STATE BATTERY MARKET, BY CAPACITY, 2020-2030,($MILLION)
TABLE 31. EUROPE SOLID STATE BATTERY MARKET, BY COUNTRY, 2020-2030,($MILLION)
TABLE 32. GERMANY SOLID STATE BATTERY MARKET BY APPLICATION 2020-2030,($MILLION)
TABLE 33. GERMANY SOLID STATE BATTERY MARKET BY TYPE 2020-2030,($MILLION)
TABLE 34. GERMANY SOLID STATE BATTERY MARKET BY CAPACITY 2020-2030,($MILLION)
TABLE 35. FRANCE SOLID STATE BATTERY MARKET BY APPLICATION 2020-2030,($MILLION)
TABLE 36. FRANCE SOLID STATE BATTERY MARKET BY TYPE 2020-2030,($MILLION)
TABLE 37. FRANCE SOLID STATE BATTERY MARKET BY CAPACITY 2020-2030,($MILLION)
TABLE 38. UK SOLID STATE BATTERY MARKET BY APPLICATION 2020-2030,($MILLION)
TABLE 39. UK SOLID STATE BATTERY MARKET BY TYPE 2020-2030,($MILLION)
TABLE 40. U.K. SOLID STATE BATTERY MARKET BY CAPACITY 2020-2030,($MILLION)
TABLE 41. ITALY SOLID STATE BATTERY MARKET BY APPLICATION 2020-2030,($MILLION)
TABLE 42. ITALY SOLID STATE BATTERY MARKET BY TYPE 2020-2030,($MILLION)
TABLE 43. ITALY SOLID STATE BATTERY MARKET BY CAPACITY 2020-2030,($MILLION)
TABLE 44. SPAIN SOLID STATE BATTERY MARKET BY APPLICATION 2020-2030,($MILLION)
TABLE 45. SPAIN SOLID STATE BATTERY MARKET BY TYPE 2020-2030,($MILLION)
TABLE 46. SPAIN SOLID STATE BATTERY MARKET BY CAPACITY 2020-2030,($MILLION)
TABLE 47. REST OF EUROPE SOLID STATE BATTERY MARKET BY APPLICATION 2020-2030,($MILLION)
TABLE 48. REST OF EUROPE SOLID STATE BATTERY MARKET BY TYPE 2020-2030,($MILLION)
TABLE 49. REST OF EUROPE SOLID STATE BATTERY MARKET BY CAPACITY 2020-2030,($MILLION)
TABLE 50. ASIA-PACIFIC SOLID STATE BATTERY MARKET, BY APPLICATION, 2020-2030,($MILLION)
TABLE 51. ASIA-PACIFIC SOLID STATE BATTERY MARKET, BY TYPE, 2020-2030,($MILLION)
TABLE 52. ASIA-PACIFIC SOLID STATE BATTERY MARKET, BY CAPACITY, 2020-2030,($MILLION)
TABLE 53. ASIA-PACIFIC SOLID STATE BATTERY MARKET, BY COUNTRY, 2020-2030,($MILLION)
TABLE 54. CHINA SOLID STATE BATTERY MARKET BY APPLICATION 2020-2030,($MILLION)
TABLE 55. CHINA SOLID STATE BATTERY MARKET BY TYPE 2020-2030,($MILLION)
TABLE 56. CHINA SOLID STATE BATTERY MARKET BY CAPACITY 2020-2030,($MILLION)
TABLE 57. JAPAN SOLID STATE BATTERY MARKET BY APPLICATION 2020-2030,($MILLION)
TABLE 58. JAPAN SOLID STATE BATTERY MARKET BY TYPE 2020-2030,($MILLION)
TABLE 59. JAPAN SOLID STATE BATTERY MARKET BY CAPACITY 2020-2030,($MILLION)
TABLE 60. INDIA SOLID STATE BATTERY MARKET BY APPLICATION 2020-2030,($MILLION)
TABLE 61. INDIA SOLID STATE BATTERY MARKET BY TYPE 2020-2030,($MILLION)
TABLE 62. INDIA SOLID STATE BATTERY MARKET BY CAPACITY 2020-2030,($MILLION)
TABLE 63. AUSTRALIA SOLID STATE BATTERY MARKET BY APPLICATION 2020-2030,($MILLION)
TABLE 64. AUSTRALIA SOLID STATE BATTERY MARKET BY TYPE 2020-2030,($MILLION)
TABLE 65. AUSTRALIA SOLID STATE BATTERY MARKET BY CAPACITY 2020-2030,($MILLION)
TABLE 66. SOUTH KOREA SOLID STATE BATTERY MARKET BY APPLICATION 2020-2030,($MILLION)
TABLE 67. SOUTH KOREA SOLID STATE BATTERY MARKET BY TYPE 2020-2030,($MILLION)
TABLE 68. SOUTH KOREA SOLID STATE BATTERY MARKET BY CAPACITY 2020-2030,($MILLION)
TABLE 69. REST OF ASIA-PACIFIC SOLID STATE BATTERY MARKET BY APPLICATION 2020-2030,($MILLION)
TABLE 70. REST OF ASIA-PACIFIC SOLID STATE BATTERY MARKET BY TYPE 2020-2030,($MILLION)
TABLE 71. REST OF ASIA-PACIFIC SOLID STATE BATTERY MARKET BY CAPACITY 2020-2030,($MILLION)
TABLE 72. LAMEA SOLID STATE BATTERY MARKET, BY APPLICATION, 2020-2030,($MILLION)
TABLE 73. LAMEA SOLID STATE BATTERY MARKET, BY TYPE, 2020-2030,($MILLION)
TABLE 74. LAMEA SOLID STATE BATTERY MARKET, BY CAPACITY, 2020-2030,($MILLION)
TABLE 75. LAMEA SOLID STATE BATTERY MARKET, BY COUNTRY, 2020-2030,($MILLION)
TABLE 76. BRAZIL SOLID STATE BATTERY MARKET BY APPLICATION 2020-2030,($MILLION)
TABLE 77. BRAZIL SOLID STATE BATTERY MARKET BY TYPE 2020-2030,($MILLION)
TABLE 78. BRAZIL SOLID STATE BATTERY MARKET BY CAPACITY 2020-2030,($MILLION)
TABLE 79. SOUTH AFRICA, SOLID STATE BATTERY MARKET BY APPLICATION 2020-2030,($MILLION)
TABLE 80. SOUTH AFRICA, SOLID STATE BATTERY MARKET BY TYPE 2020-2030,($MILLION)
TABLE 81. SOUTH AFRICA, SOLID STATE BATTERY MARKET BY CAPACITY 2020-2030,($MILLION)
TABLE 82. SAUDI ARABIA SOLID STATE BATTERY MARKET BY APPLICATION 2020-2030,($MILLION)
TABLE 83. SAUDI ARABIA SOLID STATE BATTERY MARKET BY TYPE 2020-2030,($MILLION)
TABLE 84. SAUDI ARABIA SOLID STATE BATTERY MARKET BY CAPACITY 2020-2030,($MILLION)
TABLE 85. REST OF LAMEA SOLID STATE BATTERY MARKET BY APPLICATION 2020-2030,($MILLION)
TABLE 86. REST OF LAMEA SOLID STATE BATTERY MARKET BY TYPE 2020-2030,($MILLION)
TABLE 87. REST OF LAMEA SOLID STATE BATTERY MARKET BY CAPACITY 2020-2030,($MILLION)
TABLE 88. SK INNOVATION CO., LTD.: COMPANY SNAPSHOT
TABLE 89. SK INNOVATION CO., LTD.: OPERATING SEGMENTS
TABLE 90. SK INNOVATION CO., LTD.: PRODUCT PORTFOLIO
TABLE 91. SK INNOVATION CO., LTD.: NET SALES,
TABLE 92. SK INNOVATION CO., LTD.: KEY STRATERGIES
TABLE 93. STMICROELECTRONICS: COMPANY SNAPSHOT
TABLE 94. STMICROELECTRONICS: OPERATING SEGMENTS
TABLE 95. STMICROELECTRONICS: PRODUCT PORTFOLIO
TABLE 96. STMICROELECTRONICS: NET SALES,
TABLE 97. STMICROELECTRONICS: KEY STRATERGIES
TABLE 98. TOTALENERGIES: COMPANY SNAPSHOT
TABLE 99. TOTALENERGIES: OPERATING SEGMENTS
TABLE 100.TOTALENERGIES: PRODUCT PORTFOLIO
TABLE 101.TOTALENERGIES: NET SALES,
TABLE 102.TOTALENERGIES: KEY STRATERGIES
TABLE 103.STORE DOT: COMPANY SNAPSHOT
TABLE 104.STORE DOT: OPERATING SEGMENTS
TABLE 105.STORE DOT: PRODUCT PORTFOLIO
TABLE 106.STORE DOT: NET SALES,
TABLE 107.STORE DOT: KEY STRATERGIES
TABLE 108.QUANTUMSCAPE CORPOATION: COMPANY SNAPSHOT
TABLE 109.QUANTUMSCAPE CORPOATION: OPERATING SEGMENTS
TABLE 110.QUANTUMSCAPE CORPOATION: PRODUCT PORTFOLIO
TABLE 111.QUANTUMSCAPE CORPOATION: NET SALES,
TABLE 112.QUANTUMSCAPE CORPOATION: KEY STRATERGIES
TABLE 113.SOLID POWER INC: COMPANY SNAPSHOT
TABLE 114.SOLID POWER INC: OPERATING SEGMENTS
TABLE 115.SOLID POWER INC: PRODUCT PORTFOLIO
TABLE 116.SOLID POWER INC: NET SALES,
TABLE 117.SOLID POWER INC: KEY STRATERGIES
TABLE 118.FACTORIAL INC: COMPANY SNAPSHOT
TABLE 119.FACTORIAL INC: OPERATING SEGMENTS
TABLE 120.FACTORIAL INC: PRODUCT PORTFOLIO
TABLE 121.FACTORIAL INC: NET SALES,
TABLE 122.FACTORIAL INC: KEY STRATERGIES
TABLE 123.GANFENG LITHIUM CO., LTD: COMPANY SNAPSHOT
TABLE 124.GANFENG LITHIUM CO., LTD: OPERATING SEGMENTS
TABLE 125.GANFENG LITHIUM CO., LTD: PRODUCT PORTFOLIO
TABLE 126.GANFENG LITHIUM CO., LTD: NET SALES,
TABLE 127.GANFENG LITHIUM CO., LTD: KEY STRATERGIES
TABLE 128.ILIKA: COMPANY SNAPSHOT
TABLE 129.ILIKA: OPERATING SEGMENTS
TABLE 130.ILIKA: PRODUCT PORTFOLIO
TABLE 131.ILIKA: NET SALES,
TABLE 132.ILIKA: KEY STRATERGIES
TABLE 133.PRIETO BATTERY: COMPANY SNAPSHOT
TABLE 134.PRIETO BATTERY: OPERATING SEGMENTS
TABLE 135.PRIETO BATTERY: PRODUCT PORTFOLIO
TABLE 136.PRIETO BATTERY: NET SALES,
TABLE 137.PRIETO BATTERY: KEY STRATERGIES
LIST OF FIGURES
- FIGURE 1.SOLID STATE BATTERY MARKET SEGMENTATION
FIGURE 2.SOLID STATE BATTERY MARKET,2020-2030
FIGURE 3.SOLID STATE BATTERY MARKET,2020-2030
FIGURE 4. TOP INVESTMENT POCKETS, BY REGION
FIGURE 5.HIGH BARGAINING POWER OF SUPPLIERS
FIGURE 6.MODERATE THREAT OF NEW ENTRANTS
FIGURE 7.MODERATE THREAT OF SUBSTITUTES
FIGURE 8.MODERATE INTENSITY OF RIVALRY
FIGURE 9.HIGH BARGAINING POWER OF BUYERS
FIGURE 10.TOP PLAYER POSITIONING
FIGURE 11.SOLID STATE BATTERY MARKET DYNAMICS: DRIVERS, RESTRAINTS AND OPPORTUNITIES
FIGURE 12.VALUE CHAIN ANALYSIS
FIGURE 14.PATENT ANALYSIS BY COMPANY
FIGURE 15.PATENT ANALYSIS BY COUNTRY
FIGURE 15.SOLID STATE BATTERY MARKET,BY APPLICATION,2020(%)
FIGURE 16.COMPARATIVE SHARE ANALYSIS OF CONSUMER & PORTABLE ELECTRONICS SOLID STATE BATTERY MARKET,2020-2030(%)
FIGURE 17.COMPARATIVE SHARE ANALYSIS OF ELECTRIC VEHICLE SOLID STATE BATTERY MARKET,2020-2030(%)
FIGURE 18.COMPARATIVE SHARE ANALYSIS OF ENERGY HARVESTING SOLID STATE BATTERY MARKET,2020-2030(%)
FIGURE 19.COMPARATIVE SHARE ANALYSIS OF WEARABLE AND MEDICAL DEVICES SOLID STATE BATTERY MARKET,2020-2030(%)
FIGURE 20.COMPARATIVE SHARE ANALYSIS OF OTHERS SOLID STATE BATTERY MARKET,2020-2030(%)
FIGURE 21.SOLID STATE BATTERY MARKET,BY TYPE,2020(%)
FIGURE 22.COMPARATIVE SHARE ANALYSIS OF PORTABLE SOLID STATE BATTERY MARKET,2020-2030(%)
FIGURE 23.COMPARATIVE SHARE ANALYSIS OF THIN FILM SOLID STATE BATTERY MARKET,2020-2030(%)
FIGURE 24.SOLID STATE BATTERY MARKET,BY CAPACITY,2020(%)
FIGURE 25.COMPARATIVE SHARE ANALYSIS OF LESS THAN 20 MAH SOLID STATE BATTERY MARKET,2020-2030(%)
FIGURE 26.COMPARATIVE SHARE ANALYSIS OF 20 MAH TO 500 MAH SOLID STATE BATTERY MARKET,2020-2030(%)
FIGURE 27.COMPARATIVE SHARE ANALYSIS OF MORE THAN 500 MAH SOLID STATE BATTERY MARKET,2020-2030(%)
FIGURE 28.SOLID STATE BATTERY MARKET BY REGION,2020
FIGURE 29.U.S. SOLID STATE BATTERY MARKET,2020-2030($MILLION)
FIGURE 30.CANADA SOLID STATE BATTERY MARKET,2020-2030($MILLION)
FIGURE 31.MEXICO SOLID STATE BATTERY MARKET,2020-2030($MILLION)
FIGURE 32.GERMANY SOLID STATE BATTERY MARKET,2020-2030($MILLION)
FIGURE 33.FRANCE SOLID STATE BATTERY MARKET,2020-2030($MILLION)
FIGURE 34.U.K. SOLID STATE BATTERY MARKET,2020-2030($MILLION)
FIGURE 35.ITALY SOLID STATE BATTERY MARKET,2020-2030($MILLION)
FIGURE 36.SPAIN SOLID STATE BATTERY MARKET,2020-2030($MILLION)
FIGURE 37.REST OF EUROPE SOLID STATE BATTERY MARKET,2020-2030($MILLION)
FIGURE 38.CHINA SOLID STATE BATTERY MARKET,2020-2030($MILLION)
FIGURE 39.JAPAN SOLID STATE BATTERY MARKET,2020-2030($MILLION)
FIGURE 40.INDIA SOLID STATE BATTERY MARKET,2020-2030($MILLION)
FIGURE 41.AUSTRALIA SOLID STATE BATTERY MARKET,2020-2030($MILLION)
FIGURE 42.SOUTH KOREA SOLID STATE BATTERY MARKET,2020-2030($MILLION)
FIGURE 43.REST OF ASIA-PACIFIC SOLID STATE BATTERY MARKET,2020-2030($MILLION)
FIGURE 44.BRAZIL SOLID STATE BATTERY MARKET,2020-2030($MILLION)
FIGURE 45.SOUTH AFRICA, SOLID STATE BATTERY MARKET,2020-2030($MILLION)
FIGURE 46.SAUDI ARABIA SOLID STATE BATTERY MARKET,2020-2030($MILLION)
FIGURE 47.REST OF LAMEA SOLID STATE BATTERY MARKET,2020-2030($MILLION)
FIGURE 48. TOP WINNING STRATEGIES, BY YEAR
FIGURE 49. TOP WINNING STRATEGIES, BY DEVELOPMENT
FIGURE 50. TOP WINNING STRATEGIES, BY COMPANY
FIGURE 51.PRODUCT MAPPING OF TOP 10 PLAYERS
FIGURE 52.COMPETITIVE DASHBOARD
FIGURE 53.COMPETITIVE HEATMAP OF TOP 10 KEY PLAYERS
FIGURE 54.SK INNOVATION CO., LTD..: NET SALES ,($MILLION)
FIGURE 55.STMICROELECTRONICS.: NET SALES ,($MILLION)
FIGURE 56.TOTALENERGIES.: NET SALES ,($MILLION)
FIGURE 57.STORE DOT.: NET SALES ,($MILLION)
FIGURE 58.QUANTUMSCAPE CORPOATION.: NET SALES ,($MILLION)
FIGURE 59.SOLID POWER INC.: NET SALES ,($MILLION)
FIGURE 60.FACTORIAL INC.: NET SALES ,($MILLION)
FIGURE 61.GANFENG LITHIUM CO., LTD.: NET SALES ,($MILLION)
FIGURE 62.ILIKA.: NET SALES ,($MILLION)
FIGURE 63.PRIETO BATTERY.: NET SALES ,($MILLION)

