0
U.S. (TOLL FREE)
+1 (315) 215-3225
Automative

0
U.S. (TOLL FREE)
+1 (315) 215-3225
Personalized Nutrition Market By Product Type (Active Measurement, Standard Measurement), By Application (Standard Supplement, Disease Based), By End Use (Direct-to-Consumer, Wellness and Fitness Centers, Hospital and Clinics, Institutions): Global Opportunity Analysis and Industry Forecast, 2021-2030
Published Date: June 2022
|
Report Code: ALLI-Auto-2U579
Home | Market Reports | Health| Nutrition| Vitamins & Supplements
Personalized Nutrition Market By Product Type Active Measurement Standard Measurement By Application Standard Supplement Disease Based By End Use Direct to Consumer Wellness and Fitness Centers Hospital and Clinics Institutions Global Opportunity Analysis and Industry Forecast 2021 2030
BUY CHAPTERS

Personalized Nutrition Market By Product Type (Active Measurement, Standard Measurement), By Application (Standard Supplement, Disease Based), By End Use (Direct-to-Consumer, Wellness and Fitness Centers, Hospital and Clinics, Institutions): Global Opportunity Analysis and Industry Forecast, 2021-2030

Code: ALLI-Auto-2U579
Report
June 2022
Pages:180
Allied Market Research
Buy Now with 15% Discount
DESCRIPTION
TABLE OF CONTENT
TABLES & FIGURES

Personalized Nutritions Market 2030

The global personalized nutrition market was valued at $14612.1 million in 2021 and is projected to reach $37286.9 million by 2030, growing at a CAGR of 11.48% from 2022 to 2030.

Personalized-Nutrition-Market

The aging population across regions, the growing trend of digital healthcare solutions, and the rising demand for customized solutions as a result of increased health awareness are some of the key factors anticipated to significantly impact the growth of the personalized nutrition market during the forecast period.

A need for high-quality nutritional foods based on their nutrient profiles, which will support market expansion, is one consumer trend that is expected to encourage the development of personalized nutrition methods.

Personalized Nutritions Market Trends

Because each person's lifestyle, microbiome, and genetics are unique, almost everyone responds to nutrition in a different way. An approach to offering recommendations for healthy eating programs, products, and services is personalized nutrition. Furthermore, individualized nutrition has advantages for both healthy people and the ill. The personalized nutrition market is predicted to develop as a result of this factor.

The personalized nutrition market has performed well throughout the COVID-19 pandemic. Additionally, personalized nutrition is regarded as the first line of defense against a number of health conditions, such as diabetes, cardiovascular disease, and hypertension, according to an article by the American Nutrition Association, which has led to a significant increase in demand for it.

Personalized-Nutrition-Market-By-Product-Type

As people's knowledge of holistic well-being increases, the demand for personalized meals and supplements has significantly increased. Due to rising disposable money and consumer health awareness, individualized nutrition has gained popularity. The personalized nutrition market is predicted to develop as a result of this factor. As a result of changing consumer preferences for health and wellness products, individualized diets are in high demand. A genetically based personalized diet is rising in popularity as consumers become more nutrient-specific. More and more people are deciding to replace their generic dietary supplements with ones that are genetically personalized to them and particularly treat their health issues.

Personalized-Nutrition-Market-By-Application

The personalized nutrition market is expected to grow in the next years, and technology will continue to be a key factor in this growth. In order to provide personalized dietary recommendations, a number of businesses evaluate data relevant to biological systems, such as gene regulatory networks and metabolic pathways, using computational methods and artificial intelligence. As more data is gathered, the recommendations become more precise.

Personalized Nutritions Market Share Analysis

The product-based active measuring customized nutrition sub-segment, which attained global dominance in 2021, is anticipated to hold the largest market share over the forecasted period.

Personalized-Nutrition-Market-By-End-Use

The application-based standard supplement sub-segment, which attained global dominance in 2021, is anticipated to have the largest market share over the forecasted period.

During the forecast period, the direct-to-consumer sub-segment, which ranked first globally in 2021 based on end-use, is anticipated to hold the largest market share.

Asia-Pacific is expected to have the market's fastest growth during the projected period, according to the region. This is accounted for by the region's growing embrace of fortified and functional foods.

Despite growing demand for personalized nutrition for health, some major factors that hampers the market growth are its high cost, that are expected to hamper the growth of personalized nutrition market.

Furthermore, several market players are continuously implementing various initiatives such as business expansion and collaborations to gain a major position in the overall marketplace. For instance, Herbalife Nutrition, a US based company, on October 2019 announced that they have launched new immunity essentials and relaxation tea that is used to meet the nutrition demand in the body. This will strengthen the company’s product portfolio for personalized nutrition. Also, DSM, a science-based company in Nutrition, on November 2019 acquired AVA (Boston, MA). This acquisition will offer digital personalized nutrition platform and nutritionists across the wellness and health segments. Presence of global players such as DSM that are following strategies such as acquisition, partnership and product innovation will ultimately drive the market of personalized nutrition.  

The global personalized nutrition market is segmented on the basis of product type, application, end-use, and region. By product type, the market has been divided into active measurement and standard measurement. By application, the market has been divided into standard supplements and disease based. By end-use, the market is divided into direct-to-consumer, wellness & fitness center, hospitals & clinics, and institutions. By region, the market is analyzed across North America, Europe, Asia-Pacific, and LAMEA.   

The key players profiled in this report include BASF SE, DSM, Herbalife Nutrition, Amway, DNAfit, Wellness Coaches, Atlas Biomed, Habit, LLC, Bactolac Pharmaceutical, and Balchem Corporation. 

KEY MARKET SEGMENTS

By Product

● Active Measurement
● Standard Measurement

By Application

● Standard Supplement
● Disease Based

By End Use

● Direct-to-Consumer
● Wellness and Fitness Centers
● Hospital and Clinics
● Institutions

By Region

● North America
○ U.S.
○ Canada
○ Mexico
● Europe
○ Germany
○ United Kingdom
○ France
○ Spain
○ Italy
○ Rest of Europe
● Asia-Pacific
○ China
○ Japan
○ India
○ South Korea
○ Australia
○ Rest Of Asia Pacific
● LAMEA
○ Brazil
○ Saudi Arabia
○ UAE
○ South Africa
○ Rest of LAMEA

By Key Players

  • BASF SE
  • DSM
  • Herbalife Nutrition Ltd
  • Amway
  • DNAfit
  • wellness coaches usa
  • Atlas Biomed Group Limited
  • Habit, LLC
  • Bactolac Pharmaceutical
  • Balchem Corporation

Personalized Nutrition Market Scope

Report Metric

Details

Report Name

Personalized Nutrition Market

The Market size value in 2021

14.6 Billion USD

The Revenue forecast in 2030

37.3 Billion USD

Growth Rate

CAGR of 11.48% from 2022 to 2030

Base year considered

2021

Forecast period

2022- 2030

Forecast units

Value (USD)

Segments covered

By Type, By Application, By End Use and Region

Report coverage

Revenue & volume forecast, company share, competitive landscape, growth factors, and trends

Geographic regions covered

North America, Europe, Asia Pacific, Latin America, Middle East & Africa

Companies covered

The key players profiled in this report include BASF SE, DSM, Herbalife Nutrition, Amway, DNAfit, Wellness Coaches, Atlas Biomed, Habit, LLC, Bactolac Pharmaceutical, and Balchem Corporation.

Frequently Asked Questions About This Report

1.How Big is the Personalized Nutrition Market?

Ans. The global personalized nutrition market size was $14.6 billion in 2021, and is projected to reach $37.3 billion by 2030, growing at a CAGR of 11.48% from 2022 to 2030.

2. Which is the most lucrative segment by product type for Personalized Nutrition Market Growth?

Ans. On the basis of Product Type, The active Measurement sub-segment held 61.1% share in 2021.

3. Which region holds the dominant position for Personalized Nutrition Market?

Ans. Asia-Pacific is projected to grow with a CAGR of 12.76% from 2022 - 2030

CHAPTER 1:INTRODUCTION
1.1.Report description
1.2.Key market segments
1.3.Key benefits to the stakeholders
1.4.Research Methodology
1.4.1.Secondary research
1.4.2.Primary research
1.4.3.Analyst tools and models
CHAPTER 2:EXECUTIVE SUMMARY
2.1.Key findings of the study
2.2.CXO Perspective
CHAPTER 3:MARKET OVERVIEW
3.1.Market definition and scope
3.2.Key findings
3.2.1.Top investment pockets
3.3.Porter’s five forces analysis
3.4.Top player positioning
3.5.Market dynamics
3.5.1.Drivers
3.5.2.Restraints
3.5.3.Opportunities
3.6.COVID-19 Impact Analysis on the market
3.7.Regulatory Guidelines
3.8.Value Chain Analysis
3.9.Market Share Analysis
3.10.Key Regulation Analysis
3.11.Patent Landscape
CHAPTER 4: PERSONALIZED NUTRITION MARKET, BY PRODUCT TYPE
4.1 Overview
4.1.1 Market size and forecast
4.2 Active Measurement
4.2.1 Key market trends, growth factors and opportunities
4.2.2 Market size and forecast, by region
4.2.3 Market analysis by country
4.3 Standard Measurement
4.3.1 Key market trends, growth factors and opportunities
4.3.2 Market size and forecast, by region
4.3.3 Market analysis by country
CHAPTER 5: PERSONALIZED NUTRITION MARKET, BY APPLICATION
5.1 Overview
5.1.1 Market size and forecast
5.2 Standard Supplement
5.2.1 Key market trends, growth factors and opportunities
5.2.2 Market size and forecast, by region
5.2.3 Market analysis by country
5.3 Disease Based
5.3.1 Key market trends, growth factors and opportunities
5.3.2 Market size and forecast, by region
5.3.3 Market analysis by country
CHAPTER 6: PERSONALIZED NUTRITION MARKET, BY END USE
6.1 Overview
6.1.1 Market size and forecast
6.2 Direct-to-Consumer
6.2.1 Key market trends, growth factors and opportunities
6.2.2 Market size and forecast, by region
6.2.3 Market analysis by country
6.3 Wellness and Fitness Centers
6.3.1 Key market trends, growth factors and opportunities
6.3.2 Market size and forecast, by region
6.3.3 Market analysis by country
6.4 Hospital and Clinics
6.4.1 Key market trends, growth factors and opportunities
6.4.2 Market size and forecast, by region
6.4.3 Market analysis by country
6.5 Institutions
6.5.1 Key market trends, growth factors and opportunities
6.5.2 Market size and forecast, by region
6.5.3 Market analysis by country
CHAPTER 7: PERSONALIZED NUTRITION MARKET, BY REGION
7.1 Overview
7.1.1 Market size and forecast
7.2 North America
7.2.1 Key trends and opportunities
7.2.2 North America Market size and forecast, by Product Type
7.2.3 North America Market size and forecast, by Application
7.2.4 North America Market size and forecast, by End Use
7.2.5 North America Market size and forecast, by country
7.2.5.1 U.S.
7.2.5.1.1 Market size and forecast, by Product Type
7.2.5.1.2 Market size and forecast, by Application
7.2.5.1.3 Market size and forecast, by End Use
7.2.5.2 Canada
7.2.5.2.1 Market size and forecast, by Product Type
7.2.5.2.2 Market size and forecast, by Application
7.2.5.2.3 Market size and forecast, by End Use
7.2.5.3 Mexico
7.2.5.3.1 Market size and forecast, by Product Type
7.2.5.3.2 Market size and forecast, by Application
7.2.5.3.3 Market size and forecast, by End Use
7.3 Europe
7.3.1 Key trends and opportunities
7.3.2 Europe Market size and forecast, by Product Type
7.3.3 Europe Market size and forecast, by Application
7.3.4 Europe Market size and forecast, by End Use
7.3.5 Europe Market size and forecast, by country
7.3.5.1 Germany
7.3.5.1.1 Market size and forecast, by Product Type
7.3.5.1.2 Market size and forecast, by Application
7.3.5.1.3 Market size and forecast, by End Use
7.3.5.2 United Kingdom
7.3.5.2.1 Market size and forecast, by Product Type
7.3.5.2.2 Market size and forecast, by Application
7.3.5.2.3 Market size and forecast, by End Use
7.3.5.3 France
7.3.5.3.1 Market size and forecast, by Product Type
7.3.5.3.2 Market size and forecast, by Application
7.3.5.3.3 Market size and forecast, by End Use
7.3.5.4 Spain
7.3.5.4.1 Market size and forecast, by Product Type
7.3.5.4.2 Market size and forecast, by Application
7.3.5.4.3 Market size and forecast, by End Use
7.3.5.5 Italy
7.3.5.5.1 Market size and forecast, by Product Type
7.3.5.5.2 Market size and forecast, by Application
7.3.5.5.3 Market size and forecast, by End Use
7.3.5.6 Rest of Europe
7.3.5.6.1 Market size and forecast, by Product Type
7.3.5.6.2 Market size and forecast, by Application
7.3.5.6.3 Market size and forecast, by End Use
7.4 Asia-Pacific
7.4.1 Key trends and opportunities
7.4.2 Asia-Pacific Market size and forecast, by Product Type
7.4.3 Asia-Pacific Market size and forecast, by Application
7.4.4 Asia-Pacific Market size and forecast, by End Use
7.4.5 Asia-Pacific Market size and forecast, by country
7.4.5.1 China
7.4.5.1.1 Market size and forecast, by Product Type
7.4.5.1.2 Market size and forecast, by Application
7.4.5.1.3 Market size and forecast, by End Use
7.4.5.2 Japan
7.4.5.2.1 Market size and forecast, by Product Type
7.4.5.2.2 Market size and forecast, by Application
7.4.5.2.3 Market size and forecast, by End Use
7.4.5.3 India
7.4.5.3.1 Market size and forecast, by Product Type
7.4.5.3.2 Market size and forecast, by Application
7.4.5.3.3 Market size and forecast, by End Use
7.4.5.4 South Korea
7.4.5.4.1 Market size and forecast, by Product Type
7.4.5.4.2 Market size and forecast, by Application
7.4.5.4.3 Market size and forecast, by End Use
7.4.5.5 Australia
7.4.5.5.1 Market size and forecast, by Product Type
7.4.5.5.2 Market size and forecast, by Application
7.4.5.5.3 Market size and forecast, by End Use
7.4.5.6 Rest Of Asia Pacific
7.4.5.6.1 Market size and forecast, by Product Type
7.4.5.6.2 Market size and forecast, by Application
7.4.5.6.3 Market size and forecast, by End Use
7.5 LAMEA
7.5.1 Key trends and opportunities
7.5.2 LAMEA Market size and forecast, by Product Type
7.5.3 LAMEA Market size and forecast, by Application
7.5.4 LAMEA Market size and forecast, by End Use
7.5.5 LAMEA Market size and forecast, by country
7.5.5.1 Brazil
7.5.5.1.1 Market size and forecast, by Product Type
7.5.5.1.2 Market size and forecast, by Application
7.5.5.1.3 Market size and forecast, by End Use
7.5.5.2 Saudi Arabia
7.5.5.2.1 Market size and forecast, by Product Type
7.5.5.2.2 Market size and forecast, by Application
7.5.5.2.3 Market size and forecast, by End Use
7.5.5.3 UAE
7.5.5.3.1 Market size and forecast, by Product Type
7.5.5.3.2 Market size and forecast, by Application
7.5.5.3.3 Market size and forecast, by End Use
7.5.5.4 South Africa
7.5.5.4.1 Market size and forecast, by Product Type
7.5.5.4.2 Market size and forecast, by Application
7.5.5.4.3 Market size and forecast, by End Use
7.5.5.5 Rest of LAMEA
7.5.5.5.1 Market size and forecast, by Product Type
7.5.5.5.2 Market size and forecast, by Application
7.5.5.5.3 Market size and forecast, by End Use
CHAPTER 8: COMPANY LANDSCAPE
8.1. Introduction
8.2. Top winning strategies
8.3. Product Mapping of Top 10 Player
8.4. Competitive Dashboard
8.5. Competitive Heatmap
8.6. Key developments
CHAPTER 9: COMPANY PROFILES
9.1 BASF SE
9.1.1 Company overview
9.1.2 Company snapshot
9.1.3 Operating business segments
9.1.4 Product portfolio
9.1.5 Business performance
9.1.6 Key strategic moves and developments
9.2 DSM
9.2.1 Company overview
9.2.2 Company snapshot
9.2.3 Operating business segments
9.2.4 Product portfolio
9.2.5 Business performance
9.2.6 Key strategic moves and developments
9.3 Herbalife Nutrition Ltd
9.3.1 Company overview
9.3.2 Company snapshot
9.3.3 Operating business segments
9.3.4 Product portfolio
9.3.5 Business performance
9.3.6 Key strategic moves and developments
9.4 Amway
9.4.1 Company overview
9.4.2 Company snapshot
9.4.3 Operating business segments
9.4.4 Product portfolio
9.4.5 Business performance
9.4.6 Key strategic moves and developments
9.5 DNAfit
9.5.1 Company overview
9.5.2 Company snapshot
9.5.3 Operating business segments
9.5.4 Product portfolio
9.5.5 Business performance
9.5.6 Key strategic moves and developments
9.6 wellness coaches usa
9.6.1 Company overview
9.6.2 Company snapshot
9.6.3 Operating business segments
9.6.4 Product portfolio
9.6.5 Business performance
9.6.6 Key strategic moves and developments
9.7 Atlas Biomed Group Limited
9.7.1 Company overview
9.7.2 Company snapshot
9.7.3 Operating business segments
9.7.4 Product portfolio
9.7.5 Business performance
9.7.6 Key strategic moves and developments
9.8 Habit, LLC
9.8.1 Company overview
9.8.2 Company snapshot
9.8.3 Operating business segments
9.8.4 Product portfolio
9.8.5 Business performance
9.8.6 Key strategic moves and developments
9.9 Bactolac Pharmaceutical
9.9.1 Company overview
9.9.2 Company snapshot
9.9.3 Operating business segments
9.9.4 Product portfolio
9.9.5 Business performance
9.9.6 Key strategic moves and developments
9.10 Balchem Corporation
9.10.1 Company overview
9.10.2 Company snapshot
9.10.3 Operating business segments
9.10.4 Product portfolio
9.10.5 Business performance
9.10.6 Key strategic moves and development
LIST OF TABLES
TABLE 1. GLOBAL PERSONALIZED NUTRITION MARKET, BY PRODUCT TYPE, 2021-2030 ($MILLION)
TABLE 2. PERSONALIZED NUTRITION MARKET SIZE, FOR ACTIVE MEASUREMENT, BY REGION, 2021-2030 ($MILLION)
TABLE 3. PERSONALIZED NUTRITION MARKET FOR ACTIVE MEASUREMENT, BY COUNTRY, 2021-2030 ($MILLION)
TABLE 4. PERSONALIZED NUTRITION MARKET SIZE, FOR STANDARD MEASUREMENT, BY REGION, 2021-2030 ($MILLION)
TABLE 5. PERSONALIZED NUTRITION MARKET FOR STANDARD MEASUREMENT, BY COUNTRY, 2021-2030 ($MILLION)
TABLE 6. GLOBAL PERSONALIZED NUTRITION MARKET, BY APPLICATION, 2021-2030 ($MILLION)
TABLE 7. PERSONALIZED NUTRITION MARKET SIZE, FOR STANDARD SUPPLEMENT, BY REGION, 2021-2030 ($MILLION)
TABLE 8. PERSONALIZED NUTRITION MARKET FOR STANDARD SUPPLEMENT, BY COUNTRY, 2021-2030 ($MILLION)
TABLE 9. PERSONALIZED NUTRITION MARKET SIZE, FOR DISEASE BASED, BY REGION, 2021-2030 ($MILLION)
TABLE 10. PERSONALIZED NUTRITION MARKET FOR DISEASE BASED, BY COUNTRY, 2021-2030 ($MILLION)
TABLE 11. GLOBAL PERSONALIZED NUTRITION MARKET, BY END USE, 2021-2030 ($MILLION)
TABLE 12. PERSONALIZED NUTRITION MARKET SIZE, FOR DIRECT-TO-CONSUMER, BY REGION, 2021-2030 ($MILLION)
TABLE 13. PERSONALIZED NUTRITION MARKET FOR DIRECT-TO-CONSUMER, BY COUNTRY, 2021-2030 ($MILLION)
TABLE 14. PERSONALIZED NUTRITION MARKET SIZE, FOR WELLNESS AND FITNESS CENTERS, BY REGION, 2021-2030 ($MILLION)
TABLE 15. PERSONALIZED NUTRITION MARKET FOR WELLNESS AND FITNESS CENTERS, BY COUNTRY, 2021-2030 ($MILLION)
TABLE 16. PERSONALIZED NUTRITION MARKET SIZE, FOR HOSPITAL AND CLINICS, BY REGION, 2021-2030 ($MILLION)
TABLE 17. PERSONALIZED NUTRITION MARKET FOR HOSPITAL AND CLINICS, BY COUNTRY, 2021-2030 ($MILLION)
TABLE 18. PERSONALIZED NUTRITION MARKET SIZE, FOR INSTITUTIONS, BY REGION, 2021-2030 ($MILLION)
TABLE 19. PERSONALIZED NUTRITION MARKET FOR INSTITUTIONS, BY COUNTRY, 2021-2030 ($MILLION)
TABLE 20. PERSONALIZED NUTRITION MARKET, BY REGION, 2021-2030 ($MILLION)
TABLE 21. NORTH AMERICA PERSONALIZED NUTRITION MARKET, BY PRODUCT TYPE, 2021-2030 ($MILLION)
TABLE 22. NORTH AMERICA PERSONALIZED NUTRITION MARKET, BY APPLICATION, 2021-2030 ($MILLION)
TABLE 23. NORTH AMERICA PERSONALIZED NUTRITION MARKET, BY END USE, 2021-2030 ($MILLION)
TABLE 24. NORTH AMERICA PERSONALIZED NUTRITION MARKET, BY COUNTRY, 2021-2030 ($MILLION)
TABLE 25. U.S. PERSONALIZED NUTRITION MARKET, BY PRODUCT TYPE, 2021-2030 ($MILLION)
TABLE 26. U.S. PERSONALIZED NUTRITION MARKET, BY APPLICATION, 2021-2030 ($MILLION)
TABLE 27. U.S. PERSONALIZED NUTRITION MARKET, BY END USE, 2021-2030 ($MILLION)
TABLE 28. CANADA PERSONALIZED NUTRITION MARKET, BY PRODUCT TYPE, 2021-2030 ($MILLION)
TABLE 29. CANADA PERSONALIZED NUTRITION MARKET, BY APPLICATION, 2021-2030 ($MILLION)
TABLE 30. CANADA PERSONALIZED NUTRITION MARKET, BY END USE, 2021-2030 ($MILLION)
TABLE 31. MEXICO PERSONALIZED NUTRITION MARKET, BY PRODUCT TYPE, 2021-2030 ($MILLION)
TABLE 32. MEXICO PERSONALIZED NUTRITION MARKET, BY APPLICATION, 2021-2030 ($MILLION)
TABLE 33. MEXICO PERSONALIZED NUTRITION MARKET, BY END USE, 2021-2030 ($MILLION)
TABLE 34. EUROPE PERSONALIZED NUTRITION MARKET, BY PRODUCT TYPE, 2021-2030 ($MILLION)
TABLE 35. EUROPE PERSONALIZED NUTRITION MARKET, BY APPLICATION, 2021-2030 ($MILLION)
TABLE 36. EUROPE PERSONALIZED NUTRITION MARKET, BY END USE, 2021-2030 ($MILLION)
TABLE 37. EUROPE PERSONALIZED NUTRITION MARKET, BY COUNTRY, 2021-2030 ($MILLION)
TABLE 38. GERMANY PERSONALIZED NUTRITION MARKET, BY PRODUCT TYPE, 2021-2030 ($MILLION)
TABLE 39. GERMANY PERSONALIZED NUTRITION MARKET, BY APPLICATION, 2021-2030 ($MILLION)
TABLE 40. GERMANY PERSONALIZED NUTRITION MARKET, BY END USE, 2021-2030 ($MILLION)
TABLE 41. UNITED KINGDOM PERSONALIZED NUTRITION MARKET, BY PRODUCT TYPE, 2021-2030 ($MILLION)
TABLE 42. UNITED KINGDOM PERSONALIZED NUTRITION MARKET, BY APPLICATION, 2021-2030 ($MILLION)
TABLE 43. UNITED KINGDOM PERSONALIZED NUTRITION MARKET, BY END USE, 2021-2030 ($MILLION)
TABLE 44. FRANCE PERSONALIZED NUTRITION MARKET, BY PRODUCT TYPE, 2021-2030 ($MILLION)
TABLE 45. FRANCE PERSONALIZED NUTRITION MARKET, BY APPLICATION, 2021-2030 ($MILLION)
TABLE 46. FRANCE PERSONALIZED NUTRITION MARKET, BY END USE, 2021-2030 ($MILLION)
TABLE 47. SPAIN PERSONALIZED NUTRITION MARKET, BY PRODUCT TYPE, 2021-2030 ($MILLION)
TABLE 48. SPAIN PERSONALIZED NUTRITION MARKET, BY APPLICATION, 2021-2030 ($MILLION)
TABLE 49. SPAIN PERSONALIZED NUTRITION MARKET, BY END USE, 2021-2030 ($MILLION)
TABLE 50. ITALY PERSONALIZED NUTRITION MARKET, BY PRODUCT TYPE, 2021-2030 ($MILLION)
TABLE 51. ITALY PERSONALIZED NUTRITION MARKET, BY APPLICATION, 2021-2030 ($MILLION)
TABLE 52. ITALY PERSONALIZED NUTRITION MARKET, BY END USE, 2021-2030 ($MILLION)
TABLE 53. REST OF EUROPE PERSONALIZED NUTRITION MARKET, BY PRODUCT TYPE, 2021-2030 ($MILLION)
TABLE 54. REST OF EUROPE PERSONALIZED NUTRITION MARKET, BY APPLICATION, 2021-2030 ($MILLION)
TABLE 55. REST OF EUROPE PERSONALIZED NUTRITION MARKET, BY END USE, 2021-2030 ($MILLION)
TABLE 56. ASIA-PACIFIC PERSONALIZED NUTRITION MARKET, BY PRODUCT TYPE, 2021-2030 ($MILLION)
TABLE 57. ASIA-PACIFIC PERSONALIZED NUTRITION MARKET, BY APPLICATION, 2021-2030 ($MILLION)
TABLE 58. ASIA-PACIFIC PERSONALIZED NUTRITION MARKET, BY END USE, 2021-2030 ($MILLION)
TABLE 59. ASIA-PACIFIC PERSONALIZED NUTRITION MARKET, BY COUNTRY, 2021-2030 ($MILLION)
TABLE 60. CHINA PERSONALIZED NUTRITION MARKET, BY PRODUCT TYPE, 2021-2030 ($MILLION)
TABLE 61. CHINA PERSONALIZED NUTRITION MARKET, BY APPLICATION, 2021-2030 ($MILLION)
TABLE 62. CHINA PERSONALIZED NUTRITION MARKET, BY END USE, 2021-2030 ($MILLION)
TABLE 63. JAPAN PERSONALIZED NUTRITION MARKET, BY PRODUCT TYPE, 2021-2030 ($MILLION)
TABLE 64. JAPAN PERSONALIZED NUTRITION MARKET, BY APPLICATION, 2021-2030 ($MILLION)
TABLE 65. JAPAN PERSONALIZED NUTRITION MARKET, BY END USE, 2021-2030 ($MILLION)
TABLE 66. INDIA PERSONALIZED NUTRITION MARKET, BY PRODUCT TYPE, 2021-2030 ($MILLION)
TABLE 67. INDIA PERSONALIZED NUTRITION MARKET, BY APPLICATION, 2021-2030 ($MILLION)
TABLE 68. INDIA PERSONALIZED NUTRITION MARKET, BY END USE, 2021-2030 ($MILLION)
TABLE 69. SOUTH KOREA PERSONALIZED NUTRITION MARKET, BY PRODUCT TYPE, 2021-2030 ($MILLION)
TABLE 70. SOUTH KOREA PERSONALIZED NUTRITION MARKET, BY APPLICATION, 2021-2030 ($MILLION)
TABLE 71. SOUTH KOREA PERSONALIZED NUTRITION MARKET, BY END USE, 2021-2030 ($MILLION)
TABLE 72. AUSTRALIA PERSONALIZED NUTRITION MARKET, BY PRODUCT TYPE, 2021-2030 ($MILLION)
TABLE 73. AUSTRALIA PERSONALIZED NUTRITION MARKET, BY APPLICATION, 2021-2030 ($MILLION)
TABLE 74. AUSTRALIA PERSONALIZED NUTRITION MARKET, BY END USE, 2021-2030 ($MILLION)
TABLE 75. REST OF ASIA PACIFIC PERSONALIZED NUTRITION MARKET, BY PRODUCT TYPE, 2021-2030 ($MILLION)
TABLE 76. REST OF ASIA PACIFIC PERSONALIZED NUTRITION MARKET, BY APPLICATION, 2021-2030 ($MILLION)
TABLE 77. REST OF ASIA PACIFIC PERSONALIZED NUTRITION MARKET, BY END USE, 2021-2030 ($MILLION)
TABLE 78. LAMEA PERSONALIZED NUTRITION MARKET, BY PRODUCT TYPE, 2021-2030 ($MILLION)
TABLE 79. LAMEA PERSONALIZED NUTRITION MARKET, BY APPLICATION, 2021-2030 ($MILLION)
TABLE 80. LAMEA PERSONALIZED NUTRITION MARKET, BY END USE, 2021-2030 ($MILLION)
TABLE 81. LAMEA PERSONALIZED NUTRITION MARKET, BY COUNTRY, 2021-2030 ($MILLION)
TABLE 82. BRAZIL PERSONALIZED NUTRITION MARKET, BY PRODUCT TYPE, 2021-2030 ($MILLION)
TABLE 83. BRAZIL PERSONALIZED NUTRITION MARKET, BY APPLICATION, 2021-2030 ($MILLION)
TABLE 84. BRAZIL PERSONALIZED NUTRITION MARKET, BY END USE, 2021-2030 ($MILLION)
TABLE 85. SAUDI ARABIA PERSONALIZED NUTRITION MARKET, BY PRODUCT TYPE, 2021-2030 ($MILLION)
TABLE 86. SAUDI ARABIA PERSONALIZED NUTRITION MARKET, BY APPLICATION, 2021-2030 ($MILLION)
TABLE 87. SAUDI ARABIA PERSONALIZED NUTRITION MARKET, BY END USE, 2021-2030 ($MILLION)
TABLE 88. UAE PERSONALIZED NUTRITION MARKET, BY PRODUCT TYPE, 2021-2030 ($MILLION)
TABLE 89. UAE PERSONALIZED NUTRITION MARKET, BY APPLICATION, 2021-2030 ($MILLION)
TABLE 90. UAE PERSONALIZED NUTRITION MARKET, BY END USE, 2021-2030 ($MILLION)
TABLE 91. SOUTH AFRICA PERSONALIZED NUTRITION MARKET, BY PRODUCT TYPE, 2021-2030 ($MILLION)
TABLE 92. SOUTH AFRICA PERSONALIZED NUTRITION MARKET, BY APPLICATION, 2021-2030 ($MILLION)
TABLE 93. SOUTH AFRICA PERSONALIZED NUTRITION MARKET, BY END USE, 2021-2030 ($MILLION)
TABLE 94. REST OF LAMEA PERSONALIZED NUTRITION MARKET, BY PRODUCT TYPE, 2021-2030 ($MILLION)
TABLE 95. REST OF LAMEA PERSONALIZED NUTRITION MARKET, BY APPLICATION, 2021-2030 ($MILLION)
TABLE 96. REST OF LAMEA PERSONALIZED NUTRITION MARKET, BY END USE, 2021-2030 ($MILLION)
TABLE 97.BASF SE: COMPANY SNAPSHOT
TABLE 98.BASF SE: OPERATING SEGMENTS
TABLE 99.BASF SE: PRODUCT PORTFOLIO
TABLE 100.BASF SE: NET SALES,
TABLE 101.BASF SE: KEY STRATERGIES
TABLE 102.DSM: COMPANY SNAPSHOT
TABLE 103.DSM: OPERATING SEGMENTS
TABLE 104.DSM: PRODUCT PORTFOLIO
TABLE 105.DSM: NET SALES,
TABLE 106.DSM: KEY STRATERGIES
TABLE 107.HERBALIFE NUTRITION LTD: COMPANY SNAPSHOT
TABLE 108.HERBALIFE NUTRITION LTD: OPERATING SEGMENTS
TABLE 109.HERBALIFE NUTRITION LTD: PRODUCT PORTFOLIO
TABLE 110.HERBALIFE NUTRITION LTD: NET SALES,
TABLE 111.HERBALIFE NUTRITION LTD: KEY STRATERGIES
TABLE 112.AMWAY: COMPANY SNAPSHOT
TABLE 113.AMWAY: OPERATING SEGMENTS
TABLE 114.AMWAY: PRODUCT PORTFOLIO
TABLE 115.AMWAY: NET SALES,
TABLE 116.AMWAY: KEY STRATERGIES
TABLE 117.DNAFIT: COMPANY SNAPSHOT
TABLE 118.DNAFIT: OPERATING SEGMENTS
TABLE 119.DNAFIT: PRODUCT PORTFOLIO
TABLE 120.DNAFIT: NET SALES,
TABLE 121.DNAFIT: KEY STRATERGIES
TABLE 122.WELLNESS COACHES USA: COMPANY SNAPSHOT
TABLE 123.WELLNESS COACHES USA: OPERATING SEGMENTS
TABLE 124.WELLNESS COACHES USA: PRODUCT PORTFOLIO
TABLE 125.WELLNESS COACHES USA: NET SALES,
TABLE 126.WELLNESS COACHES USA: KEY STRATERGIES
TABLE 127.ATLAS BIOMED GROUP LIMITED: COMPANY SNAPSHOT
TABLE 128.ATLAS BIOMED GROUP LIMITED: OPERATING SEGMENTS
TABLE 129.ATLAS BIOMED GROUP LIMITED: PRODUCT PORTFOLIO
TABLE 130.ATLAS BIOMED GROUP LIMITED: NET SALES,
TABLE 131.ATLAS BIOMED GROUP LIMITED: KEY STRATERGIES
TABLE 132.HABIT, LLC: COMPANY SNAPSHOT
TABLE 133.HABIT, LLC: OPERATING SEGMENTS
TABLE 134.HABIT, LLC: PRODUCT PORTFOLIO
TABLE 135.HABIT, LLC: NET SALES,
TABLE 136.HABIT, LLC: KEY STRATERGIES
TABLE 137.BACTOLAC PHARMACEUTICAL: COMPANY SNAPSHOT
TABLE 138.BACTOLAC PHARMACEUTICAL: OPERATING SEGMENTS
TABLE 139.BACTOLAC PHARMACEUTICAL: PRODUCT PORTFOLIO
TABLE 140.BACTOLAC PHARMACEUTICAL: NET SALES,
TABLE 141.BACTOLAC PHARMACEUTICAL: KEY STRATERGIES
TABLE 142.BALCHEM CORPORATION: COMPANY SNAPSHOT
TABLE 143.BALCHEM CORPORATION: OPERATING SEGMENTS
TABLE 144.BALCHEM CORPORATION: PRODUCT PORTFOLIO
TABLE 145.BALCHEM CORPORATION: NET SALES,
TABLE 146.BALCHEM CORPORATION: KEY STRATERGIES LIST OF FIGURES
FIGURE 1.PERSONALIZED NUTRITION MARKET SEGMENTATION
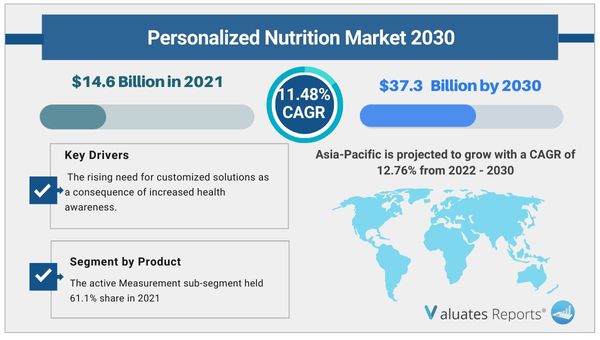
FIGURE 2.PERSONALIZED NUTRITION MARKET,2021-2030
FIGURE 3.PERSONALIZED NUTRITION MARKET,2021-2030
FIGURE 4. TOP INVESTMENT POCKETS, BY REGION
FIGURE 5.PORTER FIVE-1
FIGURE 6.PORTER FIVE-2
FIGURE 7.PORTER FIVE-3
FIGURE 8.PORTER FIVE-4
FIGURE 9.PORTER FIVE-5
FIGURE 10.TOP PLAYER POSITIONING
FIGURE 11.PERSONALIZED NUTRITION MARKET:DRIVERS, RESTRAINTS AND OPPORTUNITIES
FIGURE 12.REGULATORY GUIDELINES
FIGURE 13.VALUE CHAIN ANALYSIS
FIGURE 14.MARKET SHARE ANALYSIS
FIGURE 15.KEY REGULATION ANALYSIS
FIGURE 16.PATENT ANALYSIS BY COMPANY
FIGURE 17.PATENT ANALYSIS BY COUNTRY
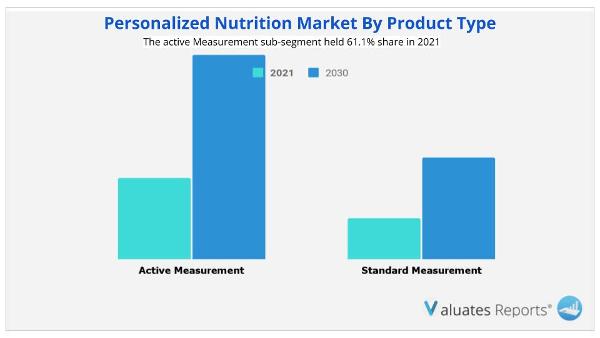
FIGURE 18.PERSONALIZED NUTRITION MARKET,BY PRODUCT TYPE,2021(%)
FIGURE 19.COMPARATIVE SHARE ANALYSIS OF ACTIVE MEASUREMENT PERSONALIZED NUTRITION MARKET,2021-2030(%)
FIGURE 20.COMPARATIVE SHARE ANALYSIS OF STANDARD MEASUREMENT PERSONALIZED NUTRITION MARKET,2021-2030(%)
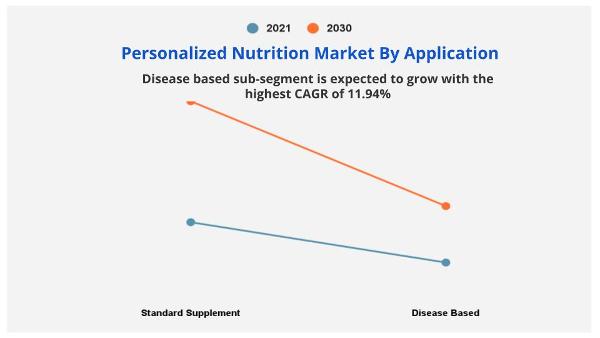
FIGURE 21.PERSONALIZED NUTRITION MARKET,BY APPLICATION,2021(%)
FIGURE 22.COMPARATIVE SHARE ANALYSIS OF STANDARD SUPPLEMENT PERSONALIZED NUTRITION MARKET,2021-2030(%)
FIGURE 23.COMPARATIVE SHARE ANALYSIS OF DISEASE BASED PERSONALIZED NUTRITION MARKET,2021-2030(%)
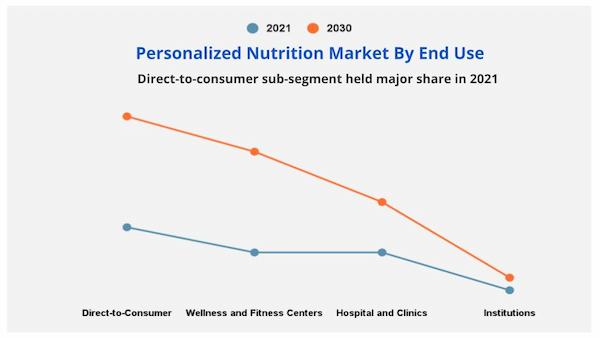
FIGURE 24.PERSONALIZED NUTRITION MARKET,BY END USE,2021(%)
FIGURE 25.COMPARATIVE SHARE ANALYSIS OF DIRECT-TO-CONSUMER PERSONALIZED NUTRITION MARKET,2021-2030(%)
FIGURE 26.COMPARATIVE SHARE ANALYSIS OF WELLNESS AND FITNESS CENTERS PERSONALIZED NUTRITION MARKET,2021-2030(%)
FIGURE 27.COMPARATIVE SHARE ANALYSIS OF HOSPITAL AND CLINICS PERSONALIZED NUTRITION MARKET,2021-2030(%)
FIGURE 28.COMPARATIVE SHARE ANALYSIS OF INSTITUTIONS PERSONALIZED NUTRITION MARKET,2021-2030(%)
FIGURE 29.PERSONALIZED NUTRITION MARKET BY REGION,2021
FIGURE 30.U.S. PERSONALIZED NUTRITION MARKET,2021-2030($MILLION)
FIGURE 31.CANADA PERSONALIZED NUTRITION MARKET,2021-2030($MILLION)
FIGURE 32.MEXICO PERSONALIZED NUTRITION MARKET,2021-2030($MILLION)
FIGURE 33.GERMANY PERSONALIZED NUTRITION MARKET,2021-2030($MILLION)
FIGURE 34.UNITED KINGDOM PERSONALIZED NUTRITION MARKET,2021-2030($MILLION)
FIGURE 35.FRANCE PERSONALIZED NUTRITION MARKET,2021-2030($MILLION)
FIGURE 36.SPAIN PERSONALIZED NUTRITION MARKET,2021-2030($MILLION)
FIGURE 37.ITALY PERSONALIZED NUTRITION MARKET,2021-2030($MILLION)
FIGURE 38.REST OF EUROPE PERSONALIZED NUTRITION MARKET,2021-2030($MILLION)
FIGURE 39.CHINA PERSONALIZED NUTRITION MARKET,2021-2030($MILLION)
FIGURE 40.JAPAN PERSONALIZED NUTRITION MARKET,2021-2030($MILLION)
FIGURE 41.INDIA PERSONALIZED NUTRITION MARKET,2021-2030($MILLION)
FIGURE 42.SOUTH KOREA PERSONALIZED NUTRITION MARKET,2021-2030($MILLION)
FIGURE 43.AUSTRALIA PERSONALIZED NUTRITION MARKET,2021-2030($MILLION)
FIGURE 44.REST OF ASIA PACIFIC PERSONALIZED NUTRITION MARKET,2021-2030($MILLION)
FIGURE 45.BRAZIL PERSONALIZED NUTRITION MARKET,2021-2030($MILLION)
FIGURE 46.SAUDI ARABIA PERSONALIZED NUTRITION MARKET,2021-2030($MILLION)
FIGURE 47.UAE PERSONALIZED NUTRITION MARKET,2021-2030($MILLION)
FIGURE 48.SOUTH AFRICA PERSONALIZED NUTRITION MARKET,2021-2030($MILLION)
FIGURE 49.REST OF LAMEA PERSONALIZED NUTRITION MARKET,2021-2030($MILLION)
FIGURE 50. TOP WINNING STRATEGIES, BY YEAR
FIGURE 51. TOP WINNING STRATEGIES, BY DEVELOPMENT
FIGURE 52. TOP WINNING STRATEGIES, BY COMPANY
FIGURE 53.PRODUCT MAPPING OF TOP 10 PLAYERS
FIGURE 54.COMPETITIVE DASHBOARD
FIGURE 55.COMPETITIVE HEATMAP OF TOP 10 KEY PLAYERS
FIGURE 56.BASF SE.: NET SALES ,($MILLION)
FIGURE 57.DSM.: NET SALES ,($MILLION)
FIGURE 58.HERBALIFE NUTRITION LTD.: NET SALES ,($MILLION)
FIGURE 59.AMWAY.: NET SALES ,($MILLION)
FIGURE 60.DNAFIT.: NET SALES ,($MILLION)
FIGURE 61.WELLNESS COACHES USA.: NET SALES ,($MILLION)
FIGURE 62.ATLAS BIOMED GROUP LIMITED.: NET SALES ,($MILLION)
FIGURE 63.HABIT, LLC.: NET SALES ,($MILLION)
FIGURE 64.BACTOLAC PHARMACEUTICAL.: NET SALES ,($MILLION)
FIGURE 65.BALCHEM CORPORATION.: NET SALES ,($MILLION
SELECT A FORMAT
Added to Cart
Electronic (PDF)

$5769

This license allows only one user to access the PDF.
Electronic (PDF)

$6450

This license allows 1 - 5 user to access the PDF, license is suitable for small groups of 5 users working together
Electronic (PDF)

$10995

This license allows users/teams in a same Enterprise to use this report, various departments within an enterpise can use this report
Electronic (PDF)

$3840

This license just provides quantitative data in a excel sheet
Add to Cart
Buy Now (15% Discount)

OUR CUSTOMER

Nano String

RELATED REPORTS

Global Calcium AKG Supplement Market Research Report 2024

120 Pages
Type: Report
Code: QYRE-Auto-39Z11851
Wed May 08 00:00:00 UTC 2024

Add to Cart

Global Electrolyte Supplement Market Research Report 2024

120 Pages
Type: Report
Code: QYRE-Auto-12E14830
Wed May 08 00:00:00 UTC 2024

Add to Cart

Global Nicotinamide Mononucleotide Supplement Market Research Report 2024

120 Pages
Type: Report
Code: QYRE-Auto-37J14678
Wed May 08 00:00:00 UTC 2024

Add to Cart

Global Zeolite Supplements Market Research Report 2024

120 Pages
Type: Report
Code: QYRE-Auto-38R14505
Wed May 08 00:00:00 UTC 2024

Add to Cart