
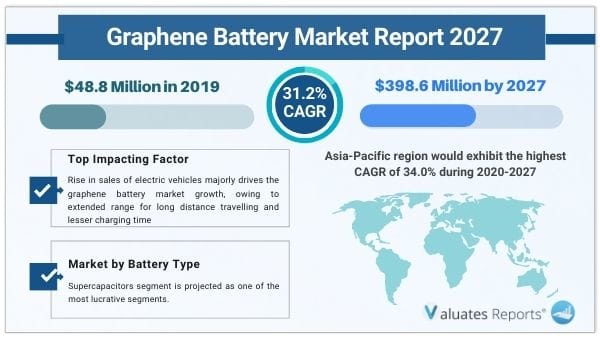
The global graphene battery market size was valued at $48.8 million in 2019 and is projected to reach $398.6 million by 2027, to register a CAGR of 31.2% during the forecast period. Key drivers of the graphene battery market include growing sales of electric vehicles and acceptance of non-conventional sources of energy.
The R&D initiatives and rising investments by government authorities will augment the graphene battery market growth in the coming years. However, high cost, lack of awareness, and less commercialization will hinder the market expansion during the review period.
Increasing preference for electric vehicles
The sales of EVs and plug-in hybrid vehicles are increasing year on year. Lithium-ion batteries suffer from overheating, high cost of production, and easy degradation. Hence market players are switching to graphene-based batteries as energy storage systems in EVs. Supercapacitors, lead-acid batteries, graphene lithium-ion, and Li-sulfur batteries hold the potential for transforming the battery industry in the next couple of years. Graphene has high porosity and flexibility. It has an efficient charging capacity and is an excellent conductor of thermal and electrical energy. At the same time, these batteries are strong, lightweight, and charge faster with less heat. Sustainability and longevity are maintained. These factors are attributed to the growth of the graphene battery market in the subsequent years.
Rapid research activities
Government authorities and key players are pouring investments into developing graphene-based materials for use in several industry verticals. The ongoing research initiatives include enhancing the electrical conductivity and quality of lithium-ion batteries. Hybrid materials with graphene as the structural binder can be used on li-ion cathodes for fast charge, discharge, and faster-charging cycle along with durability. These gradual developments will surge the growth of the graphene battery market in the coming years.
Early-stage market
Graphene has exciting possibilities in the aerospace, automotive, electronics, and healthcare sector. However, current manufacturing processes such as chemical vapor disposition have certain limitations. The detachment of the graphene layer from the substrate is not easy and a costly affair. Moreover, as graphene has still not reached full stage commercialization few players are looking to buy in large quantities. Additional expenses are incurred to make the thin graphene layers useable. These factors will hinder the market expansion during the forecasted period.
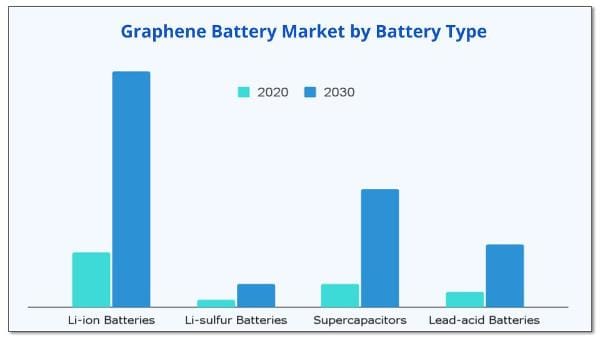
Based on battery type, the Li-ion segment will grow the highest in the graphene battery market share with a 30.50% CAGR during the review period. On other hand, the supercapacitors segment will grow the fastest.
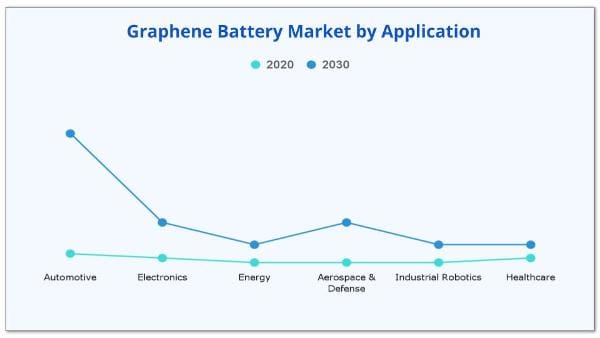
Based on application, the automotive segment will provide lucrative opportunities for growth in the graphene battery market share with 45%. This is due to the growing environment-friendly consciousness and booming sales of electric vehicles.
Based on region, Europe was the dominant segment in the graphene battery market share with the UK at 40.0% share in 2019. However, the Asia-Pacific region will grow the fastest at a CAGR of 34.0% due to growing awareness of non-conventional energy sources and tighter regulations on CO2 emissions.
| Report Metric | Details |
| Report Name | Graphene battery market |
| The market size in 2019 | USD 48.8 Million |
| The revenue forecast in 2027 | USD 398.6 Million |
| Growth Rate | Compound Annual Growth Rate (CAGR) of 31.2% from 2021 to 2027 |
| Market size available for years | 2021-2027 |
| Forecast units | Value (USD) |
| Segments covered | By Service, Industry, Traveler, Regions |
| Report coverage | Revenue & volume forecast, company share, competitive landscape, growth factors, and trends |
| Geographic regions covered | North America, Europe, Asia Pacific, Latin America, Middle East & Africa |
Ans. The global graphene battery market size was valued at $48.8 million in 2019 and is projected to reach $398.6 million by 2027, registering a CAGR of 31.2% during the forecast period.
Ans. Asia-Pacific region would exhibit the highest CAGR of 34.0% during 2020-2027
Ans. The significant impacting factors in the graphene battery market include exponential increase in sales of electric vehicles, rise in portable electronics market, and surge in adoption of non-conventional energy resources, thereby driving the growth of the global graphene battery market
Ans. The major graphene battery market players, such as Cabot Corporation, Cambridge Nanosystems Ltd., G6 Materials Corp., Graphenano S.L., GrapheneNanoChemplc, Graphenea S.A., NanoXplore Inc
Ans. The automotive segment is expected to secure a leading position during the forecast period.
Ans. The forecast period for the graphene battery market is 2021 to 2027.
Chapter 1:Introduction
1.1.Report description
1.2.Key benefits for stakeholders
1.3.Key market segments
1.4.Key Audiences
1.5.Research methodology
1.5.1.Primary research
1.5.2.Secondary research
1.5.3.Analyst tools and models
Chapter 2:Executive summary
2.1.Key findings
2.1.1.Top impacting factors
2.1.1.1.Exponential growth in sales of electric vehicles
2.1.1.2.Thriving portable electronics market
2.1.1.3.Increasing demand for adoption of non-conventional energy resources
2.1.1.4.Graphene battery market- in commercialization process
2.1.1.5.High cost of raw material
2.1.1.6.Lack of awareness of the technology
2.1.2.Top investment pockets
2.2.CXO perspective
Chapter 3:MARKET OVERVIEW
3.1.Market definition and scope
3.2.Technology Road Map
3.3.Key Forces Shaping graphene battery Industry/Market
3.3.1.Low-to-moderate bargaining power of suppliers
3.3.2.Low-to-high threat of new entrants
3.3.3.Low-to-moderate threat of substitutes
3.3.4.Moderate-to-high intensity of rivalry
3.3.5.Low-to-moderate bargaining power of buyers
3.4.Value Chain Analysis
3.4.1.Raw material
3.4.2.Manufacturing
3.4.3.Applications
3.5.Patent Analysis
3.5.1.By Region
3.5.2.By Applicant
3.6.Market dynamics
3.6.1.Drivers
3.6.1.1.Rise in sales of electric vehicles
3.6.1.2.Thriving portable electronics market
3.6.2.Restraints
3.6.2.1.Lack of awareness of graphene technology
3.6.2.2.Market in-commercialization process
3.6.3.Opportunities
3.6.3.1.Increasing government investments in R&D
Chapter 4:GRAPHENE BATTERY MARKET, BY BATTERY TYPE
4.1.Overview
4.2.Li-ion Batteries
4.2.1.Key market trends, growth factors and opportunities
4.2.2.Market size and forecast, by region
4.2.3.Market analysis by country
4.3.Li-Sulfur Batteries
4.3.1.Key market trends, growth factors, and opportunities
4.3.2.Market size and forecast, by region
4.3.3.Market analysis by country
4.4.Supercapacitors
4.4.1.Key market trends, growth factors, and opportunities
4.4.2.Market size and forecast, by region
4.4.3.Market analysis by country
4.5.Lead-acid Batteries
4.5.1.Key market trends, growth factors, and opportunities
4.5.2.Market size and forecast, by region
4.5.3.Market analysis by country
CHAPTER 5:GRAPHENE BATTERY MARKET, BY APPLICATION
5.1.Overview
5.2.Automotive
5.2.1.Key market trends, growth factors and opportunities
5.2.2.Market size and forecast, by region
5.2.3.Market analysis by country
5.3.Electronics
5.3.1.Key market trends, growth factors and opportunities
5.3.2.Market size and forecast, by region
5.3.3.Market analysis by country
5.4.Energy
5.4.1.Key market trends, growth factors and opportunities
5.4.2.Market size and forecast, by region
5.4.3.Market analysis by country
5.5.Aerospace & Defense
5.5.1.Key market trends, growth factors and opportunities
5.5.2.Market size and forecast, by region
5.5.3.Market analysis by country
5.6.Industrial Robotics
5.6.1.Key market trends, growth factors and opportunities
5.6.2.Market size and forecast, by region
5.6.3.Market analysis by country
5.7.Healthcare
5.7.1.Key market trends, growth factors and opportunities
5.7.2.Market size and forecast, by region
5.7.3.Market analysis by country
Chapter 6:GRAPHENE BATTERY MARKET, BY REGION
6.1.Overview
6.2.North America
6.2.1.Key market trends, growth factors and opportunities
6.2.2.Market size and forecast, by Battery Type
6.2.3.Market size and forecast, by application
6.2.4.Market analysis by country
6.2.4.1.U.S.
6.2.4.1.1.Market size and forecast, by Battery Type
6.2.4.1.2.Market size and forecast, by application
6.2.4.2.Canada
6.2.4.2.1.Market size and forecast, by Battery Type
6.2.4.2.2.Market size and forecast, by application
6.2.4.3.Mexico
6.2.4.3.1.Market size and forecast, by Battery Type
6.2.4.3.2.Market size and forecast, by application
6.3.Europe
6.3.1.Key market trends, growth factors and opportunities
6.3.2.Market size and forecast, by Battery Type
6.3.3.Market size and forecast, by application
6.3.4.Market analysis by country
6.3.4.1.UK
6.3.4.1.1.Market size and forecast, by Battery Type
6.3.4.1.2.Market size and forecast, by application
6.3.4.2.Germany
6.3.4.2.1.Market size and forecast, by Battery Type
6.3.4.2.2.Market size and forecast, by application
6.3.4.3.Turkey
6.3.4.3.1.Market size and forecast, by Battery Type
6.3.4.3.2.Market size and forecast, by application
6.3.4.4.Spain
6.3.4.4.1.Market size and forecast, by Battery Type
6.3.4.4.2.Market size and forecast, by application
6.3.4.5.Rest of Europe
6.3.4.5.1.Market size and forecast, by Battery Type
6.3.4.5.2.Market size and forecast, by application
6.4.Asia-Pacific
6.4.1.Key market trends, growth factors and opportunities
6.4.2.Market size and forecast, by Battery Type
6.4.3.Market size and forecast, by application
6.4.4.Market size and forecast, by Country
6.4.4.1.China
6.4.4.1.1.Market size and forecast, by Battery Type
6.4.4.1.2.Market size and forecast, by application
6.4.4.2.India
6.4.4.2.1.Market size and forecast, by Battery Type
6.4.4.2.2.Market size and forecast, by application
6.4.4.3.Japan
6.4.4.3.1.Market size and forecast, by Battery Type
6.4.4.3.2.Market size and forecast, by application
6.4.4.4.Australia
6.4.4.4.1.Market size and forecast, by Battery Type
6.4.4.4.2.Market size and forecast, by application
6.4.4.5.Rest of Asia-Pacific
6.4.4.5.1.Market size and forecast, by Battery Type
6.4.4.5.2.Market size and forecast, by application
6.5.LAMEA
6.5.1.Key market trends, growth factors and opportunities
6.5.2.Market size and forecast, by Battery Type
6.5.3.Market size and forecast, by application
6.5.4.Market size and forecast, by country
6.5.4.1.Latin America
6.5.4.1.1.Market size and forecast, by Battery Type
6.5.4.1.2.Market size and forecast, by application
6.5.4.2.Middle East
6.5.4.2.1.Market size and forecast, by Battery Type
6.5.4.2.2.Market size and forecast, by application
6.5.4.3.Africa
6.5.4.3.1.Market size and forecast, by Battery Type
6.5.4.3.2.Market size and forecast, by application
Chapter 7:COMPETITIVE LANDSCAPE
7.1.INTRODUCTION
7.1.1.MARKET PLAYER POSITIONING, 2019
7.2.TOP WINNING STRATEGIES
7.2.1.Top winning strategies, by year
7.2.2.Top winning strategies, by development
7.2.3.Top winning strategies, by company
7.3.COMPETITIVE DASHBOARD
7.4.COMPETITIVE HEATMAP
7.5.KEY DEVELOPMENTS
7.5.1.New product launches
7.5.2.Mergers and acquisition
7.5.3.Other developments
Chapter 8:Company profiles
8.1.CABOT CORPORATION
8.1.1.Company overview
8.1.2.Key Executives
8.1.3.Company snapshot
8.1.4.Operating business segments
8.1.5.Product portfolio
8.1.6.R&D Expenditure
8.1.7.Business performance
8.1.8.Key strategic moves and developments
8.2.FGV CAMBRIDGE NANOSYSTEMS LTD.
8.2.1.Company overview
8.2.2.Key Executives
8.2.3.Company snapshot
8.2.4.Operating business segments
8.2.5.Product portfolio
8.3.G6 MATERIALS CORP.
8.3.1.Company overview
8.3.2.Key Executives
8.3.3.Company snapshot
8.3.4.Operating business segments
8.3.5.Product portfolio
8.3.6.R&D Expenditure
8.3.7.Business performance
8.4.GRAPHENANO S.L.
8.4.1.Company overview
8.4.2.Key Executives
8.4.3.Company snapshot
8.4.4.Operating business segments
8.4.5.Product portfolio
8.5.GRAPHENE NANOCHEM PLC
8.5.1.Company overview
8.5.2.Key Executives
8.5.3.Company snapshot
8.5.4.Operating business segments
8.5.5.Product portfolio
8.6.GRAPHENEA S.A.
8.6.1.Company overview
8.6.2.Key Executives
8.6.3.Company snapshot
8.6.4.Operating business segments
8.6.5.Product portfolio
8.7.NANOXPLORE INC.
8.7.1.Company overview
8.7.2.Key Executives
8.7.3.Company snapshot
8.7.4.Operating business segments
8.7.5.Product portfolio
8.7.6.Key strategic moves and developments
8.8.REAL GRAPHENE
8.8.1.Company overview
8.8.2.Key Executives
8.8.3.Company snapshot
8.8.4.Operating business segments
8.8.5.Product portfolio
8.8.6.Key strategic moves and developments
8.9.VORBECK MATERIALS CORP.
8.9.1.Company overview
8.9.2.Key Executives
8.9.3.Company snapshot
8.9.4.Operating business segments
8.9.5.Product portfolio
8.10.XG SCIENCES, INC.
8.10.1.Company overview
8.10.2.Key Executives
8.10.3.Company snapshot
8.10.4.Operating business segments
8.10.5.Product portfolio
8.10.6.R&D Expenditure
8.10.7.Business performance
TABLE 01.GLOBAL GRAPHENE BATTERY MARKET, BY BATTERY TYPE, 2020-2027 ($MILLION)
TABLE 02.GRAPHENE BATTERY MARKET REVENUE FOR LI-ION BATTERIES, BY REGION 2020–2027 ($MILLION)
TABLE 03.GRAPHENE BATTERY MARKET REVENUE FOR LI-SULFUR BATTERIES, BY REGION 2020–2027($MILLION)
TABLE 04.GRAPHENE BATTERY MARKET REVENUE FOR SUPERCAPACITORS, BY REGION 2020–2027($MILLION)
TABLE 05.GRAPHENE BATTERY MARKET REVENUE FOR LEAD-ACID BATTERIES, BY REGION 2020–2027($MILLION)
TABLE 06.GLOBAL GRAPHENE BATTERY MARKET REVENUE, BY APPLICATION, 2020-2027 ($MILLION)
TABLE 07.GRAPHENE BATTERY MARKET REVENUE FOR AUTOMOTIVE, BY REGION 2020–2027($MILLION)
TABLE 08.GRAPHENE BATTERY MARKET REVENUE FOR ELECTRONICS, BY REGION 2020–2027($MILLION)
TABLE 09.GRAPHENE BATTERY MARKET REVENUE FOR ENERGY, BY REGION 2020–2027($MILLION)
TABLE 10.GRAPHENE BATTERY MARKET REVENUE FOR AEROSPACE & DEFENSE, BY REGION 2020–2027($MILLION)
TABLE 11.GRAPHENE BATTERY MARKET REVENUE FOR INDUSTRIAL ROBOTICS, BY REGION 2020–2027($MILLION)
TABLE 12.GRAPHENE BATTERY MARKET REVENUE FOR HEALTHCARE, BY REGION 2020–2027($MILLION)
TABLE 13.NORTH AMERICA GRAPHENE BATTERY MARKET REVENUE, BY BATTERY TYPE 2020–2027($MILLION)
TABLE 14.NORTH AMERICA GRAPHENE BATTERY MARKET REVENUE, BY APPLICATION 2020–2027($MILLION)
TABLE 16.NORTH AMERICA GRAPHENE BATTERY MARKET REVENUE, BY COUNTRY, 2020–2027($MILLION)
TABLE 17.U.S. GRAPHENE BATTERY MARKET REVENUE, BY BATTERY TYPE 2020–2027($MILLION)
TABLE 18.U.S. GRAPHENE BATTERY MARKET REVENUE, BY APPLICATION 2020–2027($MILLION)
TABLE 20.CANADA GRAPHENE BATTERY MARKET REVENUE, BY BATTERY TYPE 2020–2027($MILLION)
TABLE 21.CANADA GRAPHENE BATTERY MARKET REVENUE, BY APPLICATION 2020–2027($MILLION)
TABLE 22.MEXICO GRAPHENE BATTERY MARKET REVENUE, BY BATTERY TYPE 2020–2027($MILLION)
TABLE 23.MEXICO GRAPHENE BATTERY MARKET REVENUE, BY APPLICATION 2020–2027($MILLION)
TABLE 24.EUROPE GRAPHENE BATTERY MARKET REVENUE, BY BATTERY TYPE 2020–2027($MILLION)
TABLE 25.EUROPE GRAPHENE BATTERY MARKET REVENUE, BY APPLICATION 2020–2027($MILLION)
TABLE 26.EUROPE GRAPHENE BATTERY MARKET REVENUE, BY COUNRTY, 2020–2027($MILLION)
TABLE 27.UK GRAPHENE BATTERY MARKET REVENUE, BY BATTERY TYPE 2020–2027($MILLION)
TABLE 28.UK GRAPHENE BATTERY MARKET REVENUE, BY APPLICATION 2020–2027($MILLION)
TABLE 29.GERMANY GRAPHENE BATTERY MARKET REVENUE, BY BATTERY TYPE 2020–2027($MILLION)
TABLE 30.GERMANY GRAPHENE BATTERY MARKET REVENUE, BY APPLICATION 2020–2027($MILLION)
TABLE 31.TURKEY GRAPHENE BATTERY MARKET REVENUE, BY BATTERY TYPE 2020–2027($MILLION)
TABLE 32.TURKEY GRAPHENE BATTERY MARKET REVENUE, BY APPLICATION 2020–2027($MILLION)
TABLE 33.SPAIN GRAPHENE BATTERY MARKET REVENUE, BY BATTERY TYPE 2020–2027($MILLION)
TABLE 34.SPAIN GRAPHENE BATTERY MARKET REVENUE, BY APPLICATION 2020–2027($MILLION)
TABLE 35.REST OF EUROPE GRAPHENE BATTERY MARKET REVENUE, BY BATTERY TYPE 2020–2027($MILLION)
TABLE 36.REST OF EUROPE GRAPHENE BATTERY MARKET REVENUE, BY APPLICATION 2020–2027($MILLION)
TABLE 37.ASIA-PACIFIC GRAPHENE BATTERY MARKET REVENUE, BY BATTERY TYPE 2020–2027($MILLION)
TABLE 38.ASIA-PACIFIC GRAPHENE BATTERY MARKET REVENUE, BY APPLICATION 2020–2027($MILLION)
TABLE 39.ASIA-PACIFIC GRAPHENE BATTERY MARKET REVENUE, BY APPLICATION 2020–2027($MILLION)
TABLE 40.CHINA GRAPHENE BATTERY MARKET REVENUE, BY BATTERY TYPE 2020–2027($MILLION)
TABLE 41.CHINA GRAPHENE BATTERY MARKET REVENUE, BY APPLICATION 2020–2027($MILLION)
TABLE 42.INDIA GRAPHENE BATTERY MARKET REVENUE, BY BATTERY TYPE 2020–2027($MILLION)
TABLE 43.INDIA GRAPHENE BATTERY MARKET REVENUE, BY APPLICATION 2020–2027($MILLION)
TABLE 44.JAPAN GRAPHENE BATTERY MARKET REVENUE, BY BATTERY TYPE 2020–2027($MILLION)
TABLE 45.JAPAN GRAPHENE BATTERY MARKET REVENUE, BY APPLICATION 2020–2027($MILLION)
TABLE 46.AUSTRALIA GRAPHENE BATTERY MARKET REVENUE, BY BATTERY TYPE 2020–2027($MILLION)
TABLE 47.AUSTRALIA GRAPHENE BATTERY MARKET REVENUE, BY APPLICATION 2020–2027($MILLION)
TABLE 48.REST OF ASIA-PACIFIC GRAPHENE BATTERY MARKET REVENUE, BY BATTERY TYPE 2020–2027($MILLION)
TABLE 49.REST OF ASIA-PACIFIC GRAPHENE BATTERY MARKET REVENUE, BY APPLICATION 2020–2027($MILLION)
TABLE 50.LAMEA GRAPHENE BATTERY MARKET REVENUE, BY BATTERY TYPE 2020–2027($MILLION)
TABLE 51.LAMEA GRAPHENE BATTERY MARKET REVENUE, BY APPLICATION 2020–2027($MILLION)
TABLE 52.LAMEA GRAPHENE BATTERY MARKET REVENUE, BY APPLICATION 2020–2027($MILLION)
TABLE 53.LATIN AMERICA GRAPHENE BATTERY MARKET REVENUE, BY BATTERY TYPE 2020–2027($MILLION)
TABLE 54.LATIN AMERICA GRAPHENE BATTERY MARKET REVENUE, BY APPLICATION 2020–2027($MILLION)
TABLE 55.MIDDLE EAST GRAPHENE BATTERY MARKET REVENUE, BY BATTERY TYPE 2020–2027($MILLION)
TABLE 56.MIDDLE EAST GRAPHENE BATTERY MARKET REVENUE, BY APPLICATION 2020–2027($MILLION)
TABLE 57.AFRICA GRAPHENE BATTERY MARKET REVENUE, BY BATTERY TYPE 2020–2027($MILLION)
TABLE 58.AFRICA GRAPHENE BATTERY MARKET REVENUE, BY APPLICATION 2020–2027($MILLION)
TABLE 59.KEY NEW PRODUCT LAUNCHES (2017-2019)
TABLE 60.KEY MERGERS AND ACQUISITION (2017-2020*)
TABLE 61.OTHER KEY DEVELOPMENTS (2017-2019)
TABLE 62.KEY EXECUTIVES
TABLE 63.CABOT CORPORATION: COMPANY SNAPSHOT
TABLE 64.CABOT CORPORATION: OPERATING SEGMENTS
TABLE 65.CABOT CORPORATION: PRODUCT PORTFOLIO
TABLE 66.KEY EXECUTIVES
TABLE 67.FGV CAMBRIDGE NANOSYSTEMS: COMPANY SNAPSHOT
TABLE 68.FGV CAMBRIDGE NANOSYSTEMS: OPERATING SEGMENTS
TABLE 69.FGV CAMBRIDGE NANOSYSTEMS: PRODUCT PORTFOLIO
TABLE 70.KEY EXECUTIVES
TABLE 71.G6 MATERIALS CORP.: COMPANY SNAPSHOT
TABLE 72.G6 MATERIALS CORP.: OPERATING SEGMENTS
TABLE 73.G6 MATERIALS CORP.: PRODUCT PORTFOLIO
TABLE 74.KEY EXECUTIVES
TABLE 75.GRAPHENANO: COMPANY SNAPSHOT
TABLE 76.GRAPHENANO: OPERATING SEGMENTS
TABLE 77.GRAPHENANO: PRODUCT PORTFOLIO
TABLE 78.KEY EXECUTIVES
TABLE 79.GRAPHENE NANOCHEM: COMPANY SNAPSHOT
TABLE 80.GRAPHENE NANOCHEM: OPERATING SEGMENTS
TABLE 81.GRAPHENE NANOCHEM: PRODUCT PORTFOLIO
TABLE 82.KEY EXECUTIVES
TABLE 83.GRAPHENEA: COMPANY SNAPSHOT
TABLE 84.GRAPHENEA: OPERATING SEGMENTS
TABLE 85.GRAPHENEA: PRODUCT PORTFOLIO
TABLE 86.KEY EXECUTIVES
TABLE 87.NANOXPLORE: COMPANY SNAPSHOT
TABLE 88.NANOXPLORE: OPERATING SEGMENTS
TABLE 89.NANOXPLORE: PRODUCT PORTFOLIO
TABLE 90.KEY EXECUTIVES
TABLE 91.PROLOGIUM: COMPANY SNAPSHOT
TABLE 92.REAL GRAPHENE: OPERATING SEGMENTS
TABLE 93.REAL GRAPHENE: PRODUCT PORTFOLIO
TABLE 94.KEY EXECUTIVES
TABLE 95.VORBECK MATERIALS: COMPANY SNAPSHOT
TABLE 96.VORBECK MATERIALS: OPERATING SEGMENTS
TABLE 97.VORBECK MATERIALS: PRODUCT PORTFOLIO
TABLE 98.KEY EXECUTIVES
TABLE 99.XG SCIENCES: COMPANY SNAPSHOT
TABLE 100.XG SCIENCES: OPERATING SEGMENTS
TABLE 101.XG SCIENCES: PRODUCT PORTFOLIO
LIST OF FIGURES
FIGURE 01.KEY MARKET SEGMENTS
FIGURE 02.GLOBAL GRAPHENE MARKET, KEY AUDIENCES
FIGURE 03.EXECUTIVE SUMMARY
FIGURE 04.TOP IMPACTING FACTORS
FIGURE 05.TOP INVESTMENT POCKETS
FIGURE 06.TECHNOLOGY ROAD MAP
FIGURE 07.VALUE CHAIN ANALYSIS
FIGURE 08.PATENT ANALYSIS, BY REGION
FIGURE 09.PATENT ANALYSIS, BY APPLICANT
FIGURE 10.GLOBAL ELECTRIC VEHICLE DEPLOYMENT
FIGURE 11.GLOBAL GRAPHENE BATTERY MARKET, BY BATTERY TYPE, 2020-2027
FIGURE 12.COMPARATIVE SHARE ANALYSIS OF LI-ION BATTERIES GRAPHENE BATTERY MARKET, BY COUNTRY, 2020 & 2027 (%)
FIGURE 13.COMPARATIVE SHARE ANALYSIS OF LI-SULFUR BATTERIES GRAPHENE BATTERY MARKET, BY COUNTRY, 2020 & 2027 (%)
FIGURE 14.COMPARATIVE SHARE ANALYSIS OF SUPERCAPACITORS GRAPHENE BATTERY MARKET, BY COUNTRY, 2020 & 2027 (%)
FIGURE 15.COMPARATIVE SHARE ANALYSIS OF LEAD-ACID BATTERIES GRAPHENE BATTERY MARKET, BY COUNTRY, 2020 & 2027 (%)
FIGURE 16.GLOBAL GRAPHENE BATTERY MARKET, BY APPLICATION, 2020-2027
FIGURE 17.COMPARATIVE SHARE ANALYSIS OF AUTOMOTIVE GRAPHENE BATTERY MARKET, BY COUNTRY, 2019 & 2027 (%)
FIGURE 18.COMPARATIVE SHARE ANALYSIS OF ELECTRONICS GRAPHENE BATTERY MARKET, BY COUNTRY, 2019& 2027 (%)
FIGURE 19.COMPARATIVE SHARE ANALYSIS OF ENERGY GRAPHENE BATTERY MARKET, BY COUNTRY, 2019 & 2027 (%)
FIGURE 20.COMPARATIVE SHARE ANALYSIS OF AEROSPACE & DEFENSE GRAPHENE BATTERY MARKET, BY COUNTRY, 2019& 2027 (%)
FIGURE 21.COMPARATIVE SHARE ANALYSIS OF INDUSTRIAL ROBOTICS GRAPHENE BATTERY MARKET, BY COUNTRY, 2019& 2027 (%)
FIGURE 22.COMPARATIVE SHARE ANALYSIS OF HEALTHCARE GRAPHENE BATTERY MARKET, BY COUNTRY, 2019& 2027 (%)
FIGURE 23.GLOBAL GRAPHENE BATTERY MARKET REVENUE, BY REGION, 2020–2027($MILLION)
FIGURE 24.NORTH AMERICA GRAPHENE BATTERY MARKET REVENUE, BY COUNTRY, 2020–2027($MILLION)
FIGURE 25.U.S. GRAPHENE BATTERY MARKET REVENUE, 2020-2027($MILLION)
FIGURE 26.CANADA GRAPHENE BATTERY MARKET REVENUE, 2020-2027($MILLION)
FIGURE 27.MEXICO GRAPHENE BATTERY MARKET REVENUE, 2020-2027($MILLION)
FIGURE 28.EUROPE GRAPHENE BATTERY MARKET REVENUE, BY COUNTRY, 2020-2027($MILLION)
FIGURE 29.UK GRAPHENE BATTERY MARKET REVENUE, 2020-2027($MILLION)
FIGURE 30.GERMANY GRAPHENE BATTERY MARKET REVENUE, 2020-2027($MILLION)
FIGURE 31.TURKEY GRAPHENE BATTERY MARKET REVENUE, 2020-2027($MILLION)
FIGURE 32.SPAIN GRAPHENE BATTERY MARKET REVENUE, 2020-2027($MILLION)
FIGURE 33.REST OF EUROPE GRAPHENE BATTERY MARKET REVENUE, 2020-2027($MILLION)
FIGURE 34.ASIA GRAPHENE BATTERY MARKET REVENUE, BY COUNRTY, 2020–2027($MILLION)
FIGURE 35.CHINA GRAPHENE BATTERY MARKET REVENUE, 2020-2027($MILLION)
FIGURE 36.INDIA GRAPHENE BATTERY MARKET REVENUE, 2020-2027($MILLION)
FIGURE 37.JAPAN GRAPHENE BATTERY MARKET REVENUE, 2020-2027($MILLION)
FIGURE 38.AUSTRALIA GRAPHENE BATTERY MARKET REVENUE, 2020-2027($MILLION)
FIGURE 39.REST OF ASIA-PACIFIC GRAPHENE BATTERY MARKET REVENUE, 2020-2027($MILLION)
FIGURE 40.LAMEA GRAPHENE BATTERY MARKET REVENUE, BY COUNTRY, 2020-2027($MILLION)
FIGURE 41.LATIN AMERICA GRAPHENE BATTERY MARKET REVENUE, 2020-2027($MILLION)
FIGURE 42.MIDDLE EAST GRAPHENE BATTERY MARKET REVENUE, 2020-2027($MILLION)
FIGURE 43.AFRICA GRAPHENE BATTERY MARKET REVENUE, 2020-2027($MILLION)
FIGURE 44.MARKET PLAYER POSITIONING, 2019
FIGURE 45.TOP WINNING STRATEGIES, BY YEAR, 2017–2020*
FIGURE 46.TOP WINNING STRATEGIES, BY DEVELOPMENT, 2017–2020* (%)
FIGURE 47.TOP WINNING STRATEGIES, BY COMPANY, 2017-2020*
FIGURE 48.COMPETITIVE DASHBOARD
FIGURE 49.COMPETITIVE HEATMAP OF KEY PLAYERS
FIGURE 50.R&D EXPENDITURE, 2017–2019 ($MILLION)
FIGURE 51.CABOT CORPORATION: REVENUE, 2017–2019 ($MILLION)
FIGURE 52.CABOT CORPORATION: REVENUE SHARE BY SEGMENT, 2019 (%)
FIGURE 53.CABOT CORPORATION: REVENUE SHARE BY GEOGRAPHY, 2019 (%)
FIGURE 54.R&D EXPENDITURE, 2017–2019 ($MILLION)
FIGURE 55.G6 MATERIALS CORP.: REVENUE, 2017–2019 ($MILLION)
FIGURE 56.R&D EXPENDITURE, 2016–2018 ($MILLION)
FIGURE 57.XG SCIENCES: REVENUE, 2016–2018 ($MILLION)
$5769
$6450
$8995
HAVE A QUERY?
OUR CUSTOMER
SIMILAR REPORTS