
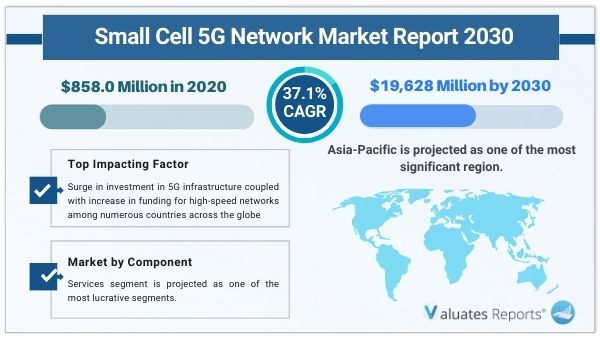
The global small cell 5G network market was valued at $858 million in 2020, and is projected to reach $19,628 million by 2030, registering a CAGR of 37.1%.
The global small cell 5G network market is anticipated to develop as a result of increased financing for high-speed networks along with increased investment in 5G infrastructure.
Increased network densification, an increase in mobile data traffic, and the advent of the Citizens Broadband Radio Service (CBRS) spectrum are the primary reasons driving the growth of the worldwide small cell 5G network market. Additionally, a rise in 5G infrastructure investment by several nations is a major driver of industry expansion. The surge in demand for ultra-reliable, low-latency communications and the introduction of the Internet of Things (IoT), are predicted to create profitable chances for the expansion of the worldwide market in the years to come.
A considerable spike in data traffic is being caused by the widespread use of smartphones, the emergence of data-intensive apps, and the expanding uptake of Internet of Things (IoT) devices. To increase network capacity and meet the rising need for high-speed data access, small cell networks offer specialized coverage and offload data from macro cellular networks. Traditional macrocellular networks could struggle to maintain coverage and quality in crowded cities, enclosed spaces, and far-off sites. In these difficult circumstances, small cells provide a cost-effective solution by increasing network coverage and signal quality, and strength. The deployment of small-cell 5G networks is being driven by the demand for dependable and high-performance connections.
Cities are rapidly becoming more populated, and smart city projects are emerging, necessitating a reliable and effective network infrastructure. With support for applications like smart mobility, public safety, energy management, and IoT connection, small-cell 5G networks are ideally suited to meet the connectivity needs of densely populated metropolitan regions. Small cells provide effective spectrum utilization since they may operate on both licensed and unlicensed spectra. Network operators can optimize the use of the available spectrum resources, increase network capacity, and improve overall network performance by placing tiny cells in certain areas. Small cell networks are essential for maximizing the capabilities of 5G by effectively using the available spectrum. This in turn is expected to drive growth of the Small Cell 5G Network Market
For demanding applications like real-time video streaming, augmented reality, and virtual reality, 5G networks offer ultra-low latency and seamless communication. Small cells that are placed close to end users increase network responsiveness and minimize latency, offering a better mobile experience and supporting latency-sensitive apps. To increase network capacity and coverage, network operators are implementing network densification initiatives. These solutions rely heavily on small cells, which support macrocellular networks by offering specialized coverage in high-demand locations. Operators may solve network congestion, enhance user experience, and support future network growth through the deployment of small cells. This factor is expected to drive the growth of the Small Cell 5G Network Market
The region with the highest growth rate is anticipated to be Asia-Pacific. With the introduction of tiny cells for 5G networks, the mobile cellular sector in Asia-Pacific is deploying a variety of technological and commercial solutions. This is a key component in this region's adoption of tiny cell 5G networks. China's state-owned mobile service providers, including China Mobile, China Unicom, and China Telecom, have contributed to a 5G national action plan to coordinate industry R&D and deployment activities with the help of the national government. Research conducted by the European Parliament predicts that overall investments will be substantial and long-term, lasting until 2030, with at least $30.76 billion annually
|
Report Metric |
Details |
|
Report Name |
Small Cell 5G Network Market |
|
The market size in 2020 |
USD 858.0 Million |
|
The revenue forecast in 2030 |
USD 19,628 Million |
|
Growth Rate |
CAGR of 37.1% from 2021 to 2030 |
|
Market size available for years |
2021-2030 |
|
Forecast units |
Value (USD) |
|
Segments covered |
Component, Radio Technology, Frequency Band, Cell Type, Applications, End-User, and Region |
|
Report coverage |
Revenue & volume forecast, company share, competitive landscape, growth factors, and trends |
|
Geographic regions covered |
North America, Europe, Asia Pacific, Latin America, Middle East & Africa |
Ans. The small cell 5G network market size was valued at $858.0 million in 2020 and is projected to reach $19,628 million by 2030, growing at a CAGR of 37.1% from 2021 to 2030.
Ans. A surge in investment in 5G infrastructure coupled with the increase in funding for high-speed networks among numerous countries across the globe is expected to drive the growth of the global small cell 5G network market.
Ans. The COVID-19 outbreak has low impact on the growth of the global small cell 5G network market, owing to the fact that the government and private sectors in emerging countries are working together to speed up the development of 5G infrastructure in the wake of the pandemic.
Ans. On the basis of radio technology, the standalone segment dominated the growth of the global small cell 5G network market.
Ans. Some of the key small cell 5G network industry players profiled in the report include Altiostar Networks, Inc., Aviat Networks, Inc., Baicells Technologies, Blinq Networks, Cambium Networks Corporation, Casa Systems, Inc., Ceragon Networks Ltd, Comba Telecom Systems Holdings Ltd., Contela Inc., Shenzhen Gongjin Electronics Co., Ltd., IP.Access Ltd., Pctel, Qucell Inc., Radisys Corporation, and Rad
Ans. The forecast period for the small cell 5g network market is 2021 to 2030.
List of Tables & Figures
Table 01.Small Cell 5g Network Market Revenue, By Component, 2020–2030 ($Million)
Table 02.Small Cell 5g Network Solution Market Revenue, By Region, 2020–2030 ($Million)
Table 03.Small Cell 5g Network Services Market Revenue, By Region, 2020–2030 ($Million)
Table 04.Small Cell 5g Network Professional Services Market Revenue, 2020–2030 ($Million)
Table 05.Small Cell 5g Network Market Revenue For Consulting Services, 2020–2030 ($Million)
Table 06.Small Cell 5g Network Market Revenue For Training & Support Services, 2020–2030 ($Million)
Table 07.Small Cell 5g Network Market Revenue For Implementation & Integration Services, 2020–2030 ($Million)
Table 08.Small Cell 5g Network Market Revenue For Managed Services, 2020–2030 ($Million)
Table 09.Small Cell 5g Network Market Revenue, By Radio Technology, 2020–2030 ($Million)
Table 10.Small Cell 5g Network Market Volume, By Radio Technology, 2020–2030 (Thousand Units)
Table 11.Small Cell 5g Network Market Revenue Fornon-standalone, By Region, 2020–2030 ($Million)
Table 12.Small Cell 5g Network Market Volume For Non-standalone, By Region, 2020–2030 (Thousand Units)
Table 13.Small Cell 5g Network Market Revenue For Standalone, By Region, 2020–2030 ($Million)
Table 14.Small Cell 5g Network Market Volume For Standalone, By Region, 2020–2030 (Thousand Units)
Table 15.Small Cell 5g Network Market Revenue, By Frequency Band2020–2030 ($Million)
Table 16.Small Cell 5g Network Market Volume For Frequency Band, By Region, 2020–2030 (Thousand Units)
Table 17.Small Cell 5g Network Market Revenue For Low-band, By Region, 2020–2030 ($Million)
Table 18.Small Cell 5g Network Market Volume For Low-band, By Region, 2020–2030 (Thousand Units)
Table 19.Small Cell 5g Network Market Revenue For Mid-band, By Region, 2020–2030 ($Million)
Table 20.Small Cell 5g Network Market Volume For Mid-band, By Region, 2020–2030 (Thousand Units)
Table 21.Small Cell 5g Network Market Revenue For Millimeter Wave (High-band), By Region, 2020–2030 ($Million)
Table 22.Small Cell 5g Network Market Volume For Millimeter Wave (High-band), By Region, 2020–2030 ($Thousand Units)
Table 23.Small Cell 5g Network Market Revenue, By Cell Type, 2020–2030 ($Million)
Table 24.Small Cell 5g Network Market Volume, By Cell Type, 2020–2030 (Thousand Units)
Table 25.Small Cell 5g Network Market Revenue For Femtocells, By Region, 2020–2030 ($Million)
Table 26.Small Cell 5g Network Market Volume For Femtocells, By Region, 2020–2030 (Thousand Units)
Table 27.Small Cell 5g Network Market Revenue For Picocells, By Region, 2020–2030 ($Million)
Table 28.Small Cell 5g Network Market Volume For Picocells, By Region, 2020–2030 (Thousand Units)
Table 29.Small Cell 5g Network Market Revenue For Microcells, By Region, 2020–2030 ($Million)
Table 30.Small Cell 5g Network Market Volume For Microcells, By Region, 2020–2030 (Thousand Units)
Table 31.Small Cell 5g Network Market Revenue, By Application, 2020–2030 ($Million)
Table 32.Small Cell 5g Network Market Volume, By Application, 2020–2030 (Thousand Units)
Table 33.Small Cell 5g Network Market Revenue For Indoor Application, By Region, 2020–2030 ($Million)
Table 34.Small Cell 5g Network Market Volume For Indoor Application, By Region, 2020–2030 (Thousand Units)
Table 35.Small Cell 5g Network Market Revenue For Outdoor Application, By Region, 2020–2030 ($Million)
Table 36.Small Cell 5g Network Market Volume For Outdoor Application, By Region, 2020–2030 (Thousand Units)
Table 37.Small Cell 5g Network Market Revenue, By End User, 2020–2030 ($Million)
Table 38.Small Cell 5g Network Market Volume, By End User, 2020–2030 (Thousand Units)
Table 39.Small Cell 5g Network Market Revenue For Residential, By Region, 2020–2030 ($Million)
Table 40.Small Cell 5g Network Market Volume For Residential, By Region, 2020–2030 (Thousand Units)
Table 41.Small Cell 5g Network Market Revenue For Commercial, By Region, 2020–2030 ($Million)
Table 42.Small Cell 5g Network Market Volume For Commercial, By Region, 2020–2030 (Thousand Units)
Table 43.Small Cell 5g Network Market Revenue, By Commercial Segment Type, 2020–2030 ($Million)
Table 44.Small Cell 5g Network Market Volume, By Commercial Segment Type, 2020–2030 (Thousand Units)
Table 45.Small Cell 5g Network Market Revenue For Industrial, By Region, 2020–2030 ($Million)
Table 46.Small Cell 5g Network Market Volume For Industrial, By Region, 2020–2030 (Thousand Units)
Table 47.Small Cell 5g Network Market Revenue, By Industrial Segment Type, 2020–2030 ($Million)
Table 48.Small Cell 5g Network Market Volume, By Industrial Segment Type, 2020–2030 (Thousand Units)
Table 49.Small Cell 5g Network Market Revenue For Smart City, By Region, 2020–2030 ($Million)
Table 50.Small Cell 5g Network Market Volume For Smart City, By Region, 2020–2030 (Thousand Units)
Table 51.Small Cell 5g Network Market Revenue For Transportation And Logistics, By Region, 2020–2030 ($Million)
Table 52.Small Cell 5g Network Market Volume For Transportation And Logistics, By Region, 2020–2030 ($Thousand Units)
Table 53.Small Cell 5g Network Market Revenue For Government And Defense, By Region, 2020–2030 ($Million)
Table 54.Small Cell 5g Network Market Volume For Government And Defense, By Region, 2020–2030 ($Thousand Units)
Table 55.Small Cell 5g Network Market Revenue For Others, By Region, 2020–2030 ($Million)
Table 56.Small Cell 5g Network Market Volume For Others, By Region, 2020–2030 (Thousand Units)
Table 57.Small Cell 5g Network Market Revenue, By Region , 2020–2030 ($Million)
Table 58.Small Cell 5g Network Market Volume, By Region , 2020–2030 (Thousand Units)
Table 59.North America Small Cell 5g Network Market Revenue, By Component 2020-2030 ($Million)
Table 60.North America Small Cell 5g Network Market Revenue, By Radio Technology, 2020-2030 ($Million)
Table 61.North America Small Cell 5g Network Market Volume, By Radio Technology, 2020-2030 (Thousand Units)
Table 62.North America Small Cell 5g Network Market Revenue, By Frequency Band, 2020-2030 ($Million)
Table 63.North America Small Cell 5g Network Market Volume, By Frequency Band, 2020-2030 (Thousand Units)
Table 64.North America Small Cell 5g Network Market Revenue, By Cell Type, 2020-2030 ($Million)
Table 65.North America Small Cell 5g Network Market Volume, By Cell Type, 2020-2030 (Thousand Units)
Table 66.North America Small Cell 5g Network Market Revenue, By Application, 2020-2030 ($Million)
Table 67.North America Small Cell 5g Network Market Volume, By Application, 2020-2030 (Thousand Units)
Table 68.North America Small Cell 5g Network Market Revenue, By End User, 2020-2030 ($Million)
Table 69.North America Small Cell 5g Network Market Volume, By End User, 2020-2030 (Thousand Units)
Table 70.North America Small Cell 5g Network Market Revenue, By Country, 2020-2030 ($Million)
Table 71.North America Small Cell 5g Network Market Volume, By Country, 2020-2030 (Thousand Units)
Table 72.U.S. Small Cell 5g Network Market Revenue, By Component 2020-2030 ($Million)
Table 73.U.S. Small Cell 5g Network Market Revenue, By Radio Technology, 2020-2030 ($Million)
Table 74.U.S. Small Cell 5g Network Market Volume, By Radio Technology, 2020-2030 (Thousand Units)
Table 75.U.S. Small Cell 5g Network Market Revenue, By Frequency Band, 2020-2030 ($Million)
Table 76.U.S. Small Cell 5g Network Market Volume, By Frequency Band, 2020-2030 (Thousand Units)
Table 77.U.S. Small Cell 5g Network Market Revenue, By Cell Type, 2020-2030 ($Million)
Table 78.U.S. Small Cell 5g Network Market Volume, By Cell Type, 2020-2030 (Thousand Units)
Table 79.U.S. Small Cell 5g Network Market Revenue, By Application, 2020-2030 ($Million)
Table 80.U.S. Small Cell 5g Network Market Volume, By Application, 2020-2030 (Thousand Units)
Table 81.U.S. Small Cell 5g Network Market Revenue, By End User, 2020-2030 ($Million)
Table 82.U.S. Small Cell 5g Network Market Volume, By End User, 2020-2030 (Thousand Units)
Table 83.Canada Small Cell 5g Network Market Revenue, By Component 2020-2030 ($Million)
Table 84.Canada Small Cell 5g Network Market Revenue, By Radio Technology, 2020-2030 ($Million)
Table 85.Canada Small Cell 5g Network Market Volume, By Radio Technology, 2020-2030 (Thousand Units)
Table 86.Canada Small Cell 5g Network Market Revenue, By Frequency Band, 2020-2030 ($Million)
Table 87.Canada Small Cell 5g Network Market Volume, By Frequency Band, 2020-2030 (Thousand Units)
Table 88.Canada Small Cell 5g Network Market Revenue, By Cell Type, 2020-2030 ($Million)
Table 89.Canada Small Cell 5g Network Market Volume, By Cell Type, 2020-2030 (Thousand Units)
Table 90.Canada Small Cell 5g Network Market Revenue, By Application, 2020-2030 ($Million)
Table 91.Canada Small Cell 5g Network Market Volume, By Application, 2020-2030 (Thousand Units)
Table 92.Canada Small Cell 5g Network Market Revenue, By End User, 2020-2030 ($Million)
Table 93.Canada Small Cell 5g Network Market Volume, By End User, 2020-2030 (Thousand Units)
Table 94.Europe Small Cell 5g Network Market Revenue, By Component 2020-2030 ($Million)
Table 95.Europe Small Cell 5g Network Market Revenue, By Radio Technology, 2020-2030 ($Million)
Table 96.Europe Small Cell 5g Network Market Volume, By Radio Technology, 2020-2030 (Thousand Units)
Table 97.Europe Small Cell 5g Network Market Revenue, By Frequency Band, 2020-2030 ($Million)
Table 98.Europe Small Cell 5g Network Market Volume, By Frequency Band, 2020-2030 (Thousand Units)
Table 99.Europe Small Cell 5g Network Market Revenue, By Cell Type, 2020-2030 ($Million)
Table 100.Europe Small Cell 5g Network Market Volume, By Cell Type, 2020-2030 (Thousand Units)
Table 101.Europe Small Cell 5g Network Market Revenue, By Application, 2020-2030 ($Million)
Table 102.Europe Small Cell 5g Network Market Volume, By Application, 2020-2030 (Thousand Units)
Table 103.Europe Small Cell 5g Network Market Revenue, By End User, 2020-2030 ($Million)
Table 104.Europe Small Cell 5g Network Market Volume, By End User, 2020-2030 (Thousand Units)
Table 105.Europe Small Cell 5g Network Market Revenue, By Country, 2020-2030 ($Million)
Table 106.Europe Small Cell 5g Network Market Volume, By Country, 2020-2030 (Thousand Units)
Table 107.Germany Small Cell 5g Network Market Revenue, By Component 2020-2030 ($Million)
Table 108.Germany Small Cell 5g Network Market Revenue, By Radio Technology, 2020-2030 ($Million)
Table 109.Germany Small Cell 5g Network Market Volume, By Radio Technology, 2020-2030 (Thousand Units)
Table 110.Germany Small Cell 5g Network Market Revenue, By Frequency Band, 2020-2030 ($Million)
Table 111.Germany Small Cell 5g Network Market Volume, By Frequency Band, 2020-2030 (Thousand Units)
Table 112.Germany Small Cell 5g Network Market Revenue, By Cell Type, 2020-2030 ($Million)
Table 113.Germany Small Cell 5g Network Market Volume, By Cell Type, 2020-2030 (Thousand Units)
Table 114.Germany Small Cell 5g Network Market Revenue, By Application, 2020-2030 ($Million)
Table 115.Germany Small Cell 5g Network Market Volume, By Application, 2020-2030 (Thousand Units)
Table 116.Germany Small Cell 5g Network Market Revenue, By End User, 2020-2030 ($Million)
Table 117.Germany Small Cell 5g Network Market Volume, By End User, 2020-2030 (Thousand Units)
Table 118.France Small Cell 5g Network Market Revenue, By Component 2020-2030 ($Million)
Table 119.France Small Cell 5g Network Market Revenue, By Radio Technology, 2020-2030 ($Million)
Table 120.France Small Cell 5g Network Market Volume, By Radio Technology, 2020-2030 (Thousand Units)
Table 121.France Small Cell 5g Network Market Revenue, By Frequency Band, 2020-2030 ($Million)
Table 122.France Small Cell 5g Network Market Volume, By Frequency Band, 2020-2030 (Thousand Units)
Table 123.France Small Cell 5g Network Market Revenue, By Cell Type, 2020-2030 ($Million)
Table 124.France Small Cell 5g Network Market Volume, By Cell Type, 2020-2030 (Thousand Units)
Table 125.France Small Cell 5g Network Market Revenue, By Application, 2020-2030 ($Million)
Table 126.France Small Cell 5g Network Market Volume, By Application, 2020-2030 (Thousand Units)
Table 127.France Small Cell 5g Network Market Revenue, By End User, 2020-2030 ($Million)
Table 128.France Small Cell 5g Network Market Volume, By End User, 2020-2030 (Thousand Units)
Table 129.Uk Small Cell 5g Network Market Revenue, By Component 2020-2030 ($Million)
Table 130.Uk Small Cell 5g Network Market Revenue, By Radio Technology, 2020-2030 ($Million)
Table 131.Uk Small Cell 5g Network Market Volume, By Radio Technology, 2020-2030 (Thousand Units)
Table 132.Uk Small Cell 5g Network Market Revenue, By Frequency Band, 2020-2030 ($Million)
Table 133.Uk Small Cell 5g Network Market Volume, By Frequency Band, 2020-2030 (Thousand Units)
Table 134.Uk Small Cell 5g Network Market Revenue, By Cell Type, 2020-2030 ($Million)
Table 135.Uk Small Cell 5g Network Market Volume, By Cell Type, 2020-2030 (Thousand Units)
Table 136.Uk Small Cell 5g Network Market Revenue, By Application, 2020-2030 ($Million)
Table 137.Uk Small Cell 5g Network Market Volume, By Application, 2020-2030 (Thousand Units)
Table 138.Uk Small Cell 5g Network Market Revenue, By End User, 2020-2030 ($Million)
Table 139.Uk Small Cell 5g Network Market Volume, By End User, 2020-2030 (Thousand Units)
Table 140.Russia Small Cell 5g Network Market Revenue, By Component 2020-2030 ($Million)
Table 141.Russia Small Cell 5g Network Market Revenue, By Radio Technology, 2020-2030 ($Million)
Table 142.Russia Small Cell 5g Network Market Volume, By Radio Technology, 2020-2030 (Thousand Units)
Table 143.Russia Small Cell 5g Network Market Revenue, By Frequency Band, 2020-2030 ($Million)
Table 144.Russia Small Cell 5g Network Market Volume, By Frequency Band, 2020-2030 (Thousand Units)
Table 145.Russia Small Cell 5g Network Market Revenue, By Cell Type, 2020-2030 ($Million)
Table 146.Russia Small Cell 5g Network Market Volume, By Cell Type, 2020-2030 (Thousand Units)
Table 147.Russia Small Cell 5g Network Market Revenue, By Application, 2020-2030 ($Million)
Table 148.Russia Small Cell 5g Network Market Volume, By Application, 2020-2030 (Thousand Units)
Table 149.Russia Small Cell 5g Network Market Revenue, By End User, 2020-2030 ($Million)
Table 150.Russia Small Cell 5g Network Market Volume, By End User, 2020-2030 (Thousand Units)
Table 151.Italy Small Cell 5g Network Market Revenue, By Component 2020-2030 ($Million)
Table 152.Italy Small Cell 5g Network Market Revenue, By Radio Technology, 2020-2030 ($Million)
Table 153.Italy Small Cell 5g Network Market Volume, By Radio Technology, 2020-2030 (Thousand Units)
Table 154.Italy Small Cell 5g Network Market Revenue, By Frequency Band, 2020-2030 ($Million)
Table 155.Italy Small Cell 5g Network Market Volume, By Frequency Band, 2020-2030 (Thousand Units)
Table 156.Italy Small Cell 5g Network Market Revenue, By Cell Type, 2020-2030 ($Million)
Table 157.Italy Small Cell 5g Network Market Volume, By Cell Type, 2020-2030 (Thousand Units)
Table 158.Italy Small Cell 5g Network Market Revenue, By Application, 2020-2030 ($Million)
Table 159.Italy Small Cell 5g Network Market Volume, By Application, 2020-2030 (Thousand Units)
Table 160.Italy Small Cell 5g Network Market Revenue, By End User, 2020-2030 ($Million)
Table 161.Italy Small Cell 5g Network Market Volume, By End User, 2020-2030 (Thousand Units)
Table 162.Rest Of Europe Small Cell 5g Network Market Revenue, By Component 2020-2030 ($Million)
Table 163.Rest Of Europe Small Cell 5g Network Market Revenue, By Radio Technology, 2020-2030 ($Million)
Table 164.Rest Of Europe Small Cell 5g Network Market Volume, By Radio Technology, 2020-2030 (Thousand Units)
Table 165.Rest Of Europe Small Cell 5g Network Market Revenue, By Frequency Band, 2020-2030 ($Million)
Table 166.Rest Of Europe Small Cell 5g Network Market Volume, By Frequency Band, 2020-2030 (Thousand Units)
Table 167.Rest Of Europe Small Cell 5g Network Market Revenue, By Cell Type, 2020-2030 ($Million)
Table 168.Rest Of Europe Small Cell 5g Network Market Volume, By Cell Type, 2020-2030 (Thousand Units)
Table 169.Rest Of Europe Small Cell 5g Network Market Revenue, By Application, 2020-2030 ($Million)
Table 170.Rest Of Europe Small Cell 5g Network Market Volume, By Application, 2020-2030 (Thousand Units)
Table 171.Rest Of Europe Small Cell 5g Network Market Revenue, By End User, 2020-2030 ($Million)
Table 172.Rest Of Europe Small Cell 5g Network Market Volume, By End User, 2020-2030 (Thousand Units)
Table 173.Asia-pacific Small Cell 5g Network Market Revenue, By Component 2020-2030 ($Million)
Table 174.Asia-pacific Small Cell 5g Network Market Revenue, By Radio Technology, 2020-2030 ($Million)
Table 175.Asia-pacific Small Cell 5g Network Market Volume, By Radio Technology, 2020-2030 (Thousand Units)
Table 176.Asia-pacific Small Cell 5g Network Market Revenue, By Frequency Band, 2020-2030 ($Million)
Table 177.Asia-pacific Small Cell 5g Network Market Volume, By Frequency Band, 2020-2030 (Thousand Units)
Table 178.Asia-pacific Small Cell 5g Network Market Revenue, By Cell Type, 2020-2030 ($Million)
Table 179.Asia-pacific Small Cell 5g Network Market Volume, By Cell Type, 2020-2030 (Thousand Units)
Table 180.Asia-pacific Small Cell 5g Network Market Revenue, By Application, 2020-2030 ($Million)
Table 181.Asia-pacific Small Cell 5g Network Market Volume, By Application, 2020-2030 (Thousand Units)
Table 182.Asia-pacific Small Cell 5g Network Market Revenue, By End User, 2020-2030 ($Million)
Table 183.Asia-pacific Small Cell 5g Network Market Volume, By End User, 2020-2030 (Thousand Units)
Table 184.Asia-pacific Small Cell 5g Network Market Revenue, By Country, 2020-2030 ($Million)
Table 185.Asia-pacific Small Cell 5g Network Market Volume, By Country, 2020-2030 (Thousand Units)
Table 186.Japan Small Cell 5g Network Market Revenue, By Component 2020-2030 ($Million)
Table 187.Japan Small Cell 5g Network Market Revenue, By Radio Technology, 2020-2030 ($Million)
Table 188.Japan Small Cell 5g Network Market Volume, By Radio Technology, 2020-2030 (Thousand Units)
Table 189.Japan Small Cell 5g Network Market Revenue, By Frequency Band, 2020-2030 ($Million)
Table 190.Japan Small Cell 5g Network Market Volume, By Frequency Band, 2020-2030 (Thousand Units)
Table 191.Japan Small Cell 5g Network Market Revenue, By Cell Type, 2020-2030 ($Million)
Table 192.Japan Small Cell 5g Network Market Volume, By Cell Type, 2020-2030 (Thousand Units)
Table 193.Japan Small Cell 5g Network Market Revenue, By Application, 2020-2030 ($Million)
Table 194.Japan Small Cell 5g Network Market Volume, By Application, 2020-2030 (Thousand Units)
Table 195.Japan Small Cell 5g Network Market Revenue, By End User, 2020-2030 ($Million)
Table 196.Japan Small Cell 5g Network Market Volume, By End User, 2020-2030 (Thousand Units)
Table 197.China Small Cell 5g Network Market Revenue, By Component 2020-2030 ($Million)
Table 198.China Small Cell 5g Network Market Revenue, By Radio Technology, 2020-2030 ($Million)
Table 199.China Small Cell 5g Network Market Volume, By Radio Technology, 2020-2030 (Thousand Units)
Table 200.China Small Cell 5g Network Market Revenue, By Frequency Band, 2020-2030 ($Million)
Table 201.China Small Cell 5g Network Market Volume, By Frequency Band, 2020-2030 (Thousand Units)
Table 202.China Small Cell 5g Network Market Revenue, By Cell Type, 2020-2030 ($Million)
Table 203.China Small Cell 5g Network Market Volume, By Cell Type, 2020-2030 (Thousand Units)
Table 204.China Small Cell 5g Network Market Revenue, By Application, 2020-2030 ($Million)
Table 205.China Small Cell 5g Network Market Volume, By Application, 2020-2030 (Thousand Units)
Table 206.China Small Cell 5g Network Market Revenue, By End User, 2020-2030 ($Million)
Table 207.China Small Cell 5g Network Market Volume, By End User, 2020-2030 (Thousand Units)
Table 208.India Small Cell 5g Network Market Revenue, By Component 2020-2030 ($Million)
Table 209.India Small Cell 5g Network Market Revenue, By Radio Technology, 2020-2030 ($Million)
Table 210.India Small Cell 5g Network Market Volume, By Radio Technology, 2020-2030 (Thousand Units)
Table 211.India Small Cell 5g Network Market Revenue, By Frequency Band, 2020-2030 ($Million)
Table 212.India Small Cell 5g Network Market Volume, By Frequency Band, 2020-2030 (Thousand Units)
Table 213.India Small Cell 5g Network Market Revenue, By Cell Type, 2020-2030 ($Million)
Table 214.India Small Cell 5g Network Market Volume, By Cell Type, 2020-2030 (Thousand Units)
Table 215.India Small Cell 5g Network Market Revenue, By Application, 2020-2030 ($Million)
Table 216.India Small Cell 5g Network Market Volume, By Application, 2020-2030 (Thousand Units)
Table 217.India Small Cell 5g Network Market Revenue, By End User, 2020-2030 ($Million)
Table 218.India Small Cell 5g Network Market Volume, By End User, 2020-2030 (Thousand Units)
Table 219.South Korea Small Cell 5g Network Market Revenue, By Component 2020-2030 ($Million)
Table 220.South Korea Small Cell 5g Network Market Revenue, By Radio Technology, 2020-2030 ($Million)
Table 221.South Korea Small Cell 5g Network Market Volume, By Radio Technology, 2020-2030 (Thousand Units)
Table 222.South Korea Small Cell 5g Network Market Revenue, By Frequency Band, 2020-2030 ($Million)
Table 223.South Korea Small Cell 5g Network Market Volume, By Frequency Band, 2020-2030 (Thousand Units)
Table 224.South Korea Small Cell 5g Network Market Revenue, By Cell Type, 2020-2030 ($Million)
Table 225.South Korea Small Cell 5g Network Market Volume, By Cell Type, 2020-2030 (Thousand Units)
Table 226.South Korea Small Cell 5g Network Market Revenue, By Application, 2020-2030 ($Million)
Table 227.South Korea Small Cell 5g Network Market Volume, By Application, 2020-2030 (Thousand Units)
Table 228.South Korea Small Cell 5g Network Market Revenue, By End User, 2020-2030 ($Million)
Table 229.South Korea Small Cell 5g Network Market Volume, By End User, 2020-2030 (Thousand Units)
Table 230.Indonesia Small Cell 5g Network Market Revenue, By Component 2020-2030 ($Million)
Table 231.Indonesia Small Cell 5g Network Market Revenue, By Radio Technology, 2020-2030 ($Million)
Table 232.Indonesia Small Cell 5g Network Market Volume, By Radio Technology, 2020-2030 (Thousand Units)
Table 233.Indonesia Small Cell 5g Network Market Revenue, By Frequency Band, 2020-2030 ($Million)
Table 234.Indonesia Small Cell 5g Network Market Volume, By Frequency Band, 2020-2030 (Thousand Units)
Table 235.Indonesia Small Cell 5g Network Market Revenue, By Cell Type, 2020-2030 ($Million)
Table 236.Indonesia Small Cell 5g Network Market Volume, By Cell Type, 2020-2030 (Thousand Units)
Table 237.Indonesia Small Cell 5g Network Market Revenue, By Application, 2020-2030 ($Million)
Table 238.Indonesia Small Cell 5g Network Market Volume, By Application, 2020-2030 (Thousand Units)
Table 239.Indonesia Small Cell 5g Network Market Revenue, By End User, 2020-2030 ($Million)
Table 240.Indonesia Small Cell 5g Network Market Volume, By End User, 2020-2030 (Thousand Units)
Table 241.Rest Of Asia-pacific Small Cell 5g Network Market Revenue, By Component 2020-2030 ($Million)
Table 242.Rest Of Asia-pacific Small Cell 5g Network Market Revenue, By Radio Technology, 2020-2030 ($Million)
Table 243.Rest Of Asia-pacific Small Cell 5g Network Market Volume, By Radio Technology, 2020-2030 (Thousand Units)
Table 244.Rest Of Asia-pacific Small Cell 5g Network Market Revenue, By Frequency Band, 2020-2030 ($Million)
Table 245.Rest Of Asia-pacific Small Cell 5g Network Market Volume, By Frequency Band, 2020-2030 (Thousand Units)
Table 246.Rest Of Asia-pacific Small Cell 5g Network Market Revenue, By Cell Type, 2020-2030 ($Million)
Table 247.Rest Of Asia-pacific Small Cell 5g Network Market Volume, By Cell Type, 2020-2030 (Thousand Units)
Table 248.Rest Of Asia-pacific Small Cell 5g Network Market Revenue, By Application, 2020-2030 ($Million)
Table 249.Rest Of Asia-pacific Small Cell 5g Network Market Volume, By Application, 2020-2030 (Thousand Units)
Table 250.Rest Of Asia-pacific Small Cell 5g Network Market Revenue, By End User, 2020-2030 ($Million)
Table 251.Rest Of Asia-pacific Small Cell 5g Network Market Volume, By End User, 2020-2030 (Thousand Units)
Table 252.Lamea Small Cell 5g Network Market Revenue, By Component 2020-2030 ($Million)
Table 253.Lamea Small Cell 5g Network Market Revenue, By Radio Technology, 2020-2030 ($Million)
Table 254.Lamea Small Cell 5g Network Market Volume, By Radio Technology, 2020-2030 (Thousand Units)
Table 255.Lamea Small Cell 5g Network Market Revenue, By Frequency Band, 2020-2030 ($Million)
Table 256.Lamea Small Cell 5g Network Market Volume, By Frequency Band, 2020-2030 (Thousand Units)
Table 257.Lamea Small Cell 5g Network Market Revenue, By Cell Type, 2020-2030 ($Million)
Table 258.Lamea Small Cell 5g Network Market Volume, By Cell Type, 2020-2030 (Thousand Units)
Table 259.Lamea Small Cell 5g Network Market Revenue, By Application, 2020-2030 ($Million)
Table 260.Lamea Small Cell 5g Network Market Volume, By Application, 2020-2030 (Thousand Units)
Table 261.Lamea Small Cell 5g Network Market Revenue, By End User, 2020-2030 ($Million)
Table 262.Lamea Small Cell 5g Network Market Volume, By End User, 2020-2030 (Thousand Units)
Table 263.Lamea Small Cell 5g Network Market Revenue, By Country, 2020-2030 ($Million)
Table 264.Lamea Small Cell 5g Network Market Volume, By Country, 2020-2030 (Thousand Units)
Table 265.Brazil Small Cell 5g Network Market Revenue, By Component 2020-2030 ($Million)
Table 266.Brazil Small Cell 5g Network Market Revenue, By Radio Technology, 2020-2030 ($Million)
Table 267.Brazil Small Cell 5g Network Market Volume, By Radio Technology, 2020-2030 (Thousand Units)
Table 268.Brazil Small Cell 5g Network Market Revenue, By Frequency Band, 2020-2030 ($Million)
Table 269.Brazil Small Cell 5g Network Market Volume, By Frequency Band, 2020-2030 (Thousand Units)
Table 270.Brazil Small Cell 5g Network Market Revenue, By Cell Type, 2020-2030 ($Million)
Table 271.Brazil Small Cell 5g Network Market Volume, By Cell Type, 2020-2030 (Thousand Units)
Table 272.Brazil Small Cell 5g Network Market Revenue, By Application, 2020-2030 ($Million)
Table 273.Brazil Small Cell 5g Network Market Volume, By Application, 2020-2030 (Thousand Units)
Table 274.Brazil Small Cell 5g Network Market Revenue, By End User, 2020-2030 ($Million)
Table 275.Brazil Small Cell 5g Network Market Volume, By End User, 2020-2030 (Thousand Units)
Table 276.Saudi Arabia Small Cell 5g Network Market Revenue, By Component 2020-2030 ($Million)
Table 277.Saudi Arabia Small Cell 5g Network Market Revenue, By Radio Technology, 2020-2030 ($Million)
Table 278.Saudi Arabia Small Cell 5g Network Market Volume, By Radio Technology, 2020-2030 (Thousand Units)
Table 279.Saudi Arabia Small Cell 5g Network Market Revenue, By Frequency Band, 2020-2030 ($Million)
Table 280.Saudi Arabia Small Cell 5g Network Market Volume, By Frequency Band, 2020-2030 (Thousand Units)
Table 281.Saudi Arabia Small Cell 5g Network Market Revenue, By Cell Type, 2020-2030 ($Million)
Table 282.Saudi Arabia Small Cell 5g Network Market Volume, By Cell Type, 2020-2030 (Thousand Units)
Table 283.Saudi Arabia Small Cell 5g Network Market Revenue, By Application, 2020-2030 ($Million)
Table 284.Saudi Arabia Small Cell 5g Network Market Volume, By Application, 2020-2030 (Thousand Units)
Table 285.Saudi Arabia Small Cell 5g Network Market Revenue, By End User, 2020-2030 ($Million)
Table 286.Saudi Arabia Small Cell 5g Network Market Volume, By End User, 2020-2030 (Thousand Units)
Table 287.South Africa Small Cell 5g Network Market Revenue, By Component 2020-2030 ($Million)
Table 288.South Africa Small Cell 5g Network Market Revenue, By Radio Technology, 2020-2030 ($Million)
Table 289.South Africa Small Cell 5g Network Market Volume, By Radio Technology, 2020-2030 (Thousand Units)
Table 290.South Africa Small Cell 5g Network Market Revenue, By Frequency Band, 2020-2030 ($Million)
Table 291.South Africa Small Cell 5g Network Market Volume, By Frequency Band, 2020-2030 (Thousand Units)
Table 292.South Africa Small Cell 5g Network Market Revenue, By Cell Type, 2020-2030 ($Million)
Table 293.South Africa Small Cell 5g Network Market Volume, By Cell Type, 2020-2030 (Thousand Units)
Table 294.South Africa Small Cell 5g Network Market Revenue, By Application, 2020-2030 ($Million)
Table 295.South Africa Small Cell 5g Network Market Volume, By Application, 2020-2030 (Thousand Units)
Table 296.South Africa Small Cell 5g Network Market Revenue, By End User, 2020-2030 ($Million)
Table 297.South Africa Small Cell 5g Network Market Volume, By End User, 2020-2030 (Thousand Units)
Table 298.Turkey Small Cell 5g Network Market Revenue, By Component 2020-2030 ($Million)
Table 299.Turkey Small Cell 5g Network Market Revenue, By Radio Technology, 2020-2030 ($Million)
Table 300.Turkey Small Cell 5g Network Market Volume, By Radio Technology, 2020-2030 (Thousand Units)
Table 301.Turkey Small Cell 5g Network Market Revenue, By Frequency Band, 2020-2030 ($Million)
Table 302.Turkey Small Cell 5g Network Market Volume, By Frequency Band, 2020-2030 (Thousand Units)
Table 303.Turkey Small Cell 5g Network Market Revenue, By Cell Type, 2020-2030 ($Million)
Table 304.Turkey Small Cell 5g Network Market Volume, By Cell Type, 2020-2030 (Thousand Units)
Table 305.Turkey Small Cell 5g Network Market Revenue, By Application, 2020-2030 ($Million)
Table 306.Turkey Small Cell 5g Network Market Volume, By Application, 2020-2030 (Thousand Units)
Table 307.Turkey Small Cell 5g Network Market Revenue, By End User, 2020-2030 ($Million)
Table 308.Turkey Small Cell 5g Network Market Volume, By End User, 2020-2030 (Thousand Units)
Table 309.United Arab Emirates Small Cell 5g Network Market Revenue, By Component 2020-2030 ($Million)
Table 310.United Arab Emirates Small Cell 5g Network Market Revenue, By Radio Technology, 2020-2030 ($Million)
Table 311.United Arab Emirates Small Cell 5g Network Market Volume, By Radio Technology, 2020-2030 (Thusand Units)
Table 312.United Arab Emirates Small Cell 5g Network Market Revenue, By Frequency Band, 2020-2030 ($Million)
Table 313.United Arab Emirates Small Cell 5g Network Market Volume, By Frequency Band, 2020-2030 (Thousand Units)
Table 314.United Arab Emirates Small Cell 5g Network Market Revenue, By Cell Type, 2020-2030 ($Million)
Table 315.United Arab Emirates Small Cell 5g Network Market Volume, By Cell Type, 2020-2030 (Thousand Units)
Table 316.United Arab Emirates Small Cell 5g Network Market Revenue, By Application, 2020-2030 ($Million)
Table 317.United Arab Emirates Small Cell 5g Network Market Volume, By Application, 2020-2030 (Thousand Units)
Table 318.United Arab Emirates Small Cell 5g Network Market Revenue, By End User, 2020-2030 ($Million)
Table 319.United Arab Emirates Small Cell 5g Network Market Volume, By End User, 2020-2030 (Thousand Units)
Table 320.Egypt Small Cell 5g Network Market Revenue, By Component 2020-2030 ($Million)
Table 321.Egypt Small Cell 5g Network Market Revenue, By Radio Technology, 2020-2030 ($Million)
Table 322.Egypt Small Cell 5g Network Market Volume, By Radio Technology, 2020-2030 (Thousand Units)
Table 323.Egypt Small Cell 5g Network Market Revenue, By Frequency Band, 2020-2030 ($Million)
Table 324.Egypt Small Cell 5g Network Market Volume, By Frequency Band, 2020-2030 (Thousand Units)
Table 325.Egypt Small Cell 5g Network Market Revenue, By Cell Type, 2020-2030 ($Million)
Table 326.Egypt Small Cell 5g Network Market Volume, By Cell Type, 2020-2030 (Thousand Units)
Table 327.Egypt Small Cell 5g Network Market Revenue, By Application, 2020-2030 ($Million)
Table 328.Egypt Small Cell 5g Network Market Volume, By Application, 2020-2030 (Thousand Units)
Table 329.Egypt Small Cell 5g Network Market Revenue, By End User, 2020-2030 ($Million)
Table 330.Egypt Small Cell 5g Network Market Volume, By End User, 2020-2030 (Thousand Units)
Table 331.Rest Of Africa Small Cell 5g Network Market Revenue, By Component 2020-2030 ($Million)
Table 332.Rest Of Africa Small Cell 5g Network Market Revenue, By Radio Technology, 2020-2030 ($Million)
Table 333.Rest Of Africa Small Cell 5g Network Market Volume, By Radio Technology, 2020-2030 (Thousand Units)
Table 334.Rest Of Africa Small Cell 5g Network Market Revenue, By Frequency Band, 2020-2030 ($Million)
Table 335.Rest Of Africa Small Cell 5g Network Market Volume, By Frequency Band, 2020-2030 (Thousand Units)
Table 336.Rest Of Africa Small Cell 5g Network Market Revenue, By Cell Type, 2020-2030 ($Million)
Table 337.Rest Of Africa Small Cell 5g Network Market Volume, By Cell Type, 2020-2030 (Thousand Units)
Table 338.Rest Of Africa Small Cell 5g Network Market Revenue, By Application, 2020-2030 ($Million)
Table 339.Rest Of Africa Small Cell 5g Network Market Volume, By Application, 2020-2030 (Thousand Units)
Table 340.Rest Of Africa Small Cell 5g Network Market Revenue, By End User, 2020-2030 ($Million)
Table 341.Rest Of Africa Small Cell 5g Network Market Volume, By End User, 2020-2030 (Thousand Units)
Table 342.Rest Of Middle East Small Cell 5g Network Market Revenue, By Component 2020-2030 ($Million)
Table 343.Rest Of Middle East Small Cell 5g Network Market Revenue, By Radio Technology, 2020-2030 ($Million)
Table 344.Rest Of Middle East Small Cell 5g Network Market Volume, By Radio Technology, 2020-2030 (Thousand Units)
Table 345.Rest Of Middle East Small Cell 5g Network Market Revenue, By Frequency Band, 2020-2030 ($Million)
Table 346.Rest Of Middle East Small Cell 5g Network Market Volume, By Frequency Band, 2020-2030 (Thousand Units)
Table 347.Rest Of Middle East Small Cell 5g Network Market Revenue, By Cell Type, 2020-2030 ($Million)
Table 348.Rest Of Middle East Small Cell 5g Network Market Volume, By Cell Type, 2020-2030 (Thousand Units)
Table 349.Rest Of Middle East Small Cell 5g Network Market Revenue, By Application, 2020-2030 ($Million)
Table 350.Rest Of Middle East Small Cell 5g Network Market Volume, By Application, 2020-2030 (Thousand Units)
Table 351.Rest Of Middle East Small Cell 5g Network Market Revenue, By End User, 2020-2030 ($Million)
Table 352.Rest Of Middle East Small Cell 5g Network Market Volume, By End User, 2020-2030 (Thousand Units)
Table 353.Rest Of Latin America Small Cell 5g Network Market Revenue, By Component 2020-2030 ($Million)
Table 354.Rest Of Latin America Small Cell 5g Network Market Revenue, By Radio Technology, 2020-2030 ($Million)
Table 355.Rest Of Latin America Small Cell 5g Network Market Volume, By Radio Technology, 2020-2030 (Thousand Units)
Table 356.Rest Of Latin America Small Cell 5g Network Market Revenue, By Frequency Band, 2020-2030 ($Million)
Table 357.Rest Of Latin America Small Cell 5g Network Market Volume, By Frequency Band, 2020-2030 (Thousand Units)
Table 358.Rest Of Latin America Small Cell 5g Network Market Revenue, By Cell Type, 2020-2030 ($Million)
Table 359.Rest Of Latin America Small Cell 5g Network Market Volume, By Cell Type, 2020-2030 (Thousand Units)
Table 360.Rest Of Latin America Small Cell 5g Network Market Revenue, By Application, 2020-2030 ($Million)
Table 361.Rest Of Latin America Small Cell 5g Network Market Volume, By Application, 2020-2030 (Thousand Units)
Table 362.Rest Of Latin America Small Cell 5g Network Market Revenue, By End User, 2020-2030 ($Million)
Table 363.Rest Of Latin America Small Cell 5g Network Market Volume, By End User, 2020-2030 (Thousand Units)
Table 364.Key New Product Launches (2016-2019)
Table 365.Partnership (2016-2019)
Table 366.Acquistion (2016-2019)
Table 367.Key Expansions (2016-2019)
Table 368.Product Development (2016-2019)
Table 369.Collaboration (2016-2019)
Table 370.Agreement (2016-2019)
Table 371.Altiostar Networks, Inc.: Key Executive
Table 372.Altiostar Networks, Inc.: Company Snapshot
Table 373.Altiostar Networks, Inc.: Product Portfolio
Table 374.Altiostar Networks, Inc.:Key Strategic Moves And Developments
Table 375.Aviat Networks, Inc.: Key Executive
Table 376.Aviat Networks, Inc.: Company Snapshot
Table 377.Aviat Networks, Inc.: Product Portfolio
Table 378.Aviat Networks, Inc. Limited:Key Strategic Moves And Developments
Table 379.Baicells Technologies: Key Executive
Table 380.Baicells Technologies: Company Snapshot
Table 381.Baicells Technologies: Product Portfolio
Table 382.Baicells Technologies:Key Strategic Moves And Developments
Table 383.Blinq Networks: Key Executive
Table 384.Blinq Networks: Company Snapshot
Table 385.Blinq Networks: Product Portfolio
Table 386.Blinq Networks:Key Strategic Moves And Developments
Table 387.Cambium Networks Corporation: Key Executive
Table 388.Cambium Networks Corporation.: Company Snapshot
Table 389.Cambium Networks Corporation.: Operating Segments
Table 390.Cambium Networks Corporation.: Product Portfolio
Table 391.Cambium Networks Corporation.:Key Strategic Moves And Developments
Table 392.Casa Systems, Inc.: Key Executive
Table 393.Casa Systems, Inc.: Company Snapshot
Table 394.Casa Systems, Inc.: Product Portfolio
Table 395.Casa Systems, Inc.:Key Strategic Moves And Developments
Table 396.Ceragon Networks Ltd: Key Executive
Table 397.Ceragon Networks Ltd: Company Snapshot
Table 398.Ceragon Networks Ltd: Product Portfolio
Table 399.Ceragon Networks Ltd:Key Strategic Moves And Developments
Table 400.Comba Telecom Systems Holdings Ltd.: Key Executive
Table 401.Comba Telecom Systems Holdings Ltd.: Company Snapshot
Table 402.Comba Telecom Systems Holdings Ltd.: Product Portfolio
Table 403.Comba Telecom Systems Holdings Ltd.:Key Strategic Moves And Developments
Table 404.Contela Inc.: Key Executive
Table 405.Contela Inc.: Company Snapshot
Table 406.Contela Inc.: Product Portfolio
Table 407.Contela Inc.:Key Strategic Moves And Developments
Table 408.Shenzhen Gongjin Electronics Co., Ltd: Key Executive
Table 409.Shenzhen Gongjin Electronics Co., Ltd: Company Snapshot
Table 410.Shenzhen Gongjin Electronics Co., Ltd: Product Portfolio
Table 411.Shenzhen Gongjin Electronics Co., Ltd:Key Strategic Moves And Developments
Table 412.Mavenir: Key Executive
Table 413.Ip.Access Ltd: Company Snapshot
Table 414.Ip. Access Ltd: Product Portfolio
Table 415.Ip. Access Ltd:Key Strategic Moves And Developments
Table 416.Pctel, Inc.: Key Executive
Table 417.Pctel, Inc.: Company Snapshot
Table 418.Pctel, Inc.: Operating Segments
Table 419.Pctel, Inc.: Product Portfolio
Table 420.Pctel, Inc.:Key Strategic Moves And Developments
Table 421.Qucell Inc.: Key Executive
Table 422.Qucell Inc.: Company Snapshot
Table 423.Qucell Inc.: Product Portfolio
Table 424.Qucell Inc.:Key Strategic Moves And Developments
Table 425.Radisys Corporation: Key Executive
Table 426.Radisys Corporation: Company Snapshot
Table 427.Radisys Corporation: Product Portfolio
Table 428.Radisys Corporation:Key Strategic Moves And Developments
Table 429.Radwin: Key Executive
Table 430.Radwin: Company Snapshot
Table 431.Radwin: Product Portfolio
Table 432.Radwin:Key Strategic Moves And Developments
List Of Figures
Figure 01.Key Market Segments
Figure 02.Small Cell 5g Network Market, 2020–2030
Figure 03.Small Cell 5g Network Market, By Country, 2020-2030
Figure 04.Top Impacting Factors
Figure 05.Top Investment Pockets
Figure 06.Market Evolution/Industry Roadmap
Figure 07.Moderate-to-high Bargaining Power Of Suppliers
Figure 08.High Bargaining Power Of Buyers
Figure 10.Moderate-to-high Threat Of Substitutes
Figure 11.Moderate-to-high Threat Of New Entrants
Figure 12.High Competitive Rivalry
Figure 13.Market Dynamics: Drivers, Restraints & Opportunities
Figure 14.Value Chain Anaysis
Figure 15.Market Share Analysis, 2020
Figure 16.Market Share Analysis, 2030
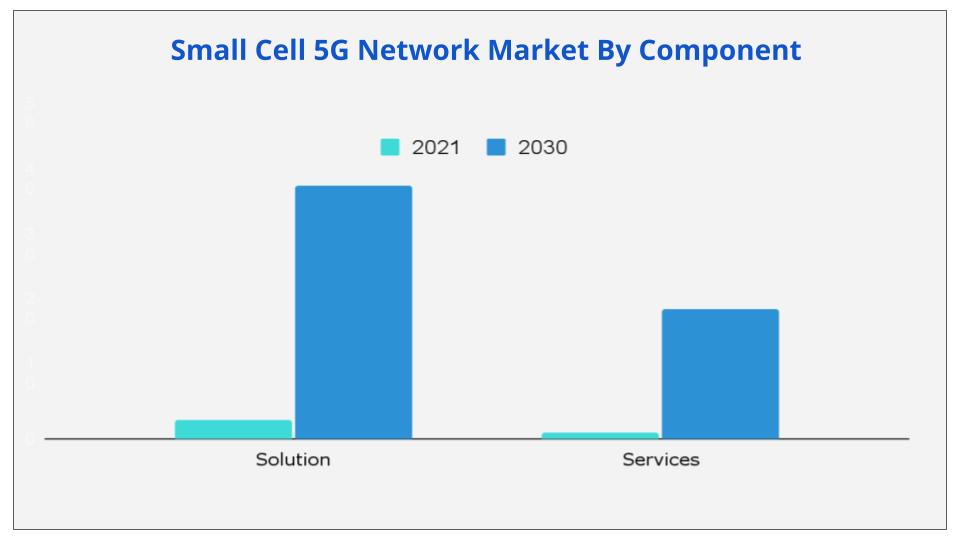
Figure 17.Small Cell 5g Network Market Revenue, By Component, 2020–2030 ($Million)
Figure 18.Comparative Share Analysis Of Small Cell 5g Network Solution Market, By Country, 2020 & 2030 (%)
Figure 19.Comparative Share Analysis Of Small Cell 5g Network Services Market, By Country, 2020 & 2030(%)
Figure 20.Competitive Landscape
Figure 21.Competitive Landscape
Figure 22.Product Heatmap
Figure 23.Competitive Landscape
Figure 24.Competitive Landscape
Figure 25.Product Heatmap
Figure 26.Competitive Landscape
Figure 27.Competitive Landscape
Figure 28.Product Heatmap
Figure 29.Competitive Landscape
Figure 30.Competitive Landscape
Figure 31.Product Heatmap
Figure 32.Small Cell 5g Network Market Revenue, By Radio Technology, 2020–2030 ($Million)
Figure 33.Comparative Share Analysis Of Small Cell 5g Network Market For Non-standalone, By Country, 2020 & 2030(%)
Figure 34.Comparative Share Analysis Of Small Cell 5g Network Market For Standalone, By Country, 2020 & 2030(%)
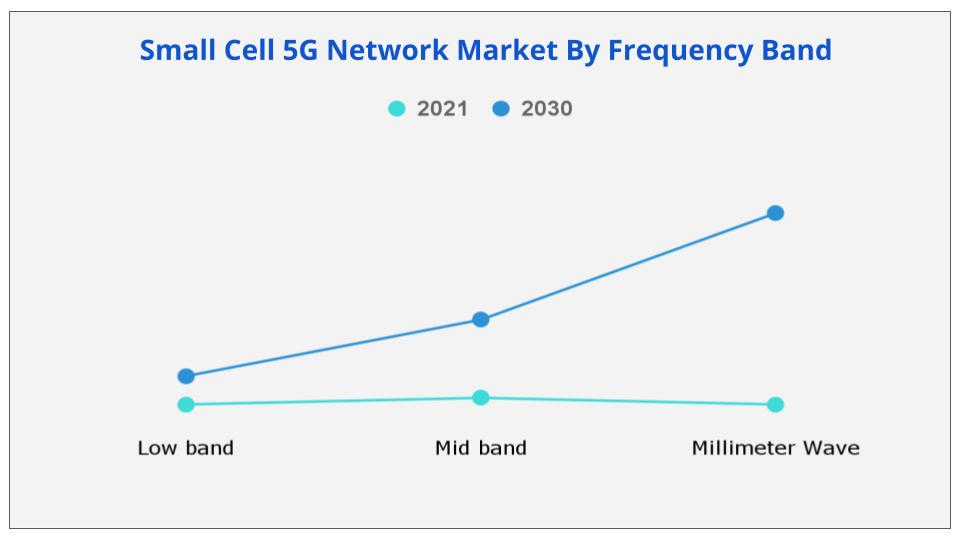
Figure 35.Small Cell 5g Network Market Revenue, By Frequency Band, 2020–2030 ($Million)
Figure 36.Comparative Share Analysis Of Small Cell 5g Network For Low-band, By Country, 2020 & 2030(%)
Figure 37.Comparative Share Analysis Of Small Cell 5g Network Market For Mid-band, By Country, 2020 & 2030 (%)
Figure 38.Comparative Share Analysis Of Small Cell 5g Network Market For Millimeter Wave (High-band), By Country, 2020 & 2030(%)
Figure 39.Small Cell 5g Network Market Revenue, By Cell Type, 2020–2030 ($Million)
Figure 40.Comparative Share Analysis Of Small Cell 5g Network Market For Femtocells, By Country, 2020 & 2030 (%)
Figure 41.Comparative Share Analysis Of Small Cell 5g Network Market For Picocells, By Country, 2020 & 2030 (%)
Figure 42.Comparative Share Analysis Of Small Cell 5g Network Market For Microcells, By Country, 2020 & 2030 (%)
Figure 43.Small Cell 5g Network Market Revenue, By Application, 2020–2030 ($Million)
Figure 44.Comparative Share Analysis Of Small Cell 5g Network Market For Indoor Application, By Country, 2020 & 2030(%)
Figure 45.Comparative Share Analysis Of Small Cell 5g Network Market For Outdoor Application, By Country, 2020 & 2030(%)
Figure 46.Small Cell 5g Network Market Revenue, By End User, 2020–2030 ($Million)
Figure 47.Comparative Share Analysis Of Small Cell 5g Network Market For Residential, By Country, 2020 & 2030 (%)
Figure 48.Comparative Share Analysis Of Small Cell 5g Network Market For Commercial, By Country, 2020 & 2030(%)
Figure 49.Comparative Share Analysis Of Small Cell 5g Network Market For Industrial, By Country, 2020 & 2030 (%)
Figure 50.Comparative Share Analysis Of Small Cell 5g Network Market For Smart City, By Country, 2020 & 2030 (%)
Figure 51.Comparative Share Analysis Of Small Cell 5g Network Market For Transportation And Logistics, By Country, 2020 & 2030(%)
Figure 52.Comparative Share Analysis Of Small Cell 5g Network Market For Government And Defense, By Country, 2020 & 2030(%)
Figure 53.Comparative Share Analysis Of Small Cell 5g Network Market For Others, By Country, 2020 & 2030 (%)
Figure 54.U.S. Small Cell 5g Network Market Revenue, 2020-2030 ($Million)
Figure 55.Canada Small Cell 5g Network Market Revenue, 2020-2030 ($Million)
Figure 56.Germany Small Cell 5g Network Market Revenue, 2020-2030 ($Million)
Figure 57.France Small Cell 5g Network Market Revenue, 2020-2030 ($Million)
Figure 58.Uk Small Cell 5g Network Market Revenue, 2020-2030 ($Million)
Figure 59.Russia Small Cell 5g Network Market Revenue, 2020-2030 ($Million)
Figure 60.Italy Small Cell 5g Network Market Revenue, 2020-2030 ($Million)
Figure 61.Rest Of Europe Small Cell 5g Network Market Revenue, 2020-2030 ($Million)
Figure 62.Japan Small Cell 5g Network Market Revenue, 2020-2030 ($Million)
Figure 63.China Small Cell 5g Network Market Revenue, 2020-2030 ($Million)
Figure 64.India Small Cell 5g Network Market Revenue, 2020-2030 ($Million)
Figure 65.South Korea Small Cell 5g Network Market Revenue, 2020-2030 ($Million)
Figure 66.Indonesia Small Cell 5g Network Market Revenue, 2020-2030 ($Million)
Figure 67.Rest Of Asia-pacific Small Cell 5g Network Market Revenue, 2020-2030 ($Million)
Figure 68.Brazil Small Cell 5g Network Market Revenue, 2020-2030 ($Million)
Figure 69.Saudi Arabia Small Cell 5g Network Market Revenue, 2020-2030 ($Million)
Figure 70.South Africa Small Cell 5g Network Market Revenue, 2020-2030 ($Million)
Figure 71.Turkey Small Cell 5g Network Market Revenue, 2020-2030 ($Million)
Figure 72.United Arab Emirates Small Cell 5g Network Market Revenue, 2020-2030 ($Million)
Figure 73.Egypt Small Cell 5g Network Market Revenue, 2020-2030 ($Million)
Figure 74.Rest Of Africa Small Cell 5g Network Market Revenue, 2020-2030 ($Million)
Figure 75.Rest Of Middle East Small Cell 5g Network Market Revenue, 2020-2030 ($Million)
Figure 76.Rest Of Latin America Small Cell 5g Network Market Revenue, 2020-2030 ($Million)
Figure 77.Competitive Dashboard
Figure 78.Competitive Dashboard
Figure 79.Competitive Dashboard
Figure 80.Competitive Heatmap Of Key Players
Figure 81.R&D Expenditure, 2018–2020 ($Million)
Figure 82.Aviat Networks, Inc.: Revenue, 2018–2020 ($Million)
Figure 83.Aviat Networks, Inc.: Revenue Share By Region, 2020 (%)
Figure 84.R&D Expenditure, 2018–2020 ($Million)
Figure 85.Cambium Networks Corporation: Revenue, 2018–2020 ($Million)
Figure 86.Cambium Networks Corporation: Revenue Share By Product Category, 2020 (%)
Figure 87.Cambium Networks Corporation: Revenue Share By Region, 2020 (%)
Figure 88.R&D Expenditure, 2018–2020 ($Million)
Figure 89.Casa Systems, Inc.: Revenue, 2018–2020 ($Million)
Figure 90.Casa Systems, Inc.: Revenue Share By Region, 2020 (%)
Figure 91.R&D Expenditure, 2018–2020 ($Million)
Figure 92.Ceragon Networks Ltd: Revenue, 2018–2020 ($Million)
Figure 93.Ceragon Networks Ltd: Revenue Share By Region, 2020 (%)
Figure 94.R&D Expenditure, 2018–2020 ($Million)
Figure 95.Comba Telecom Systems Holdings Ltd.: Revenue, 2018–2020 ($Million)
Figure 96.Comba Telecom Systems Holdings Ltd.: Revenue Share By Segment, 2020 (%)
Figure 97.Comba Telecom Systems Holdings Ltd.: Revenue Share By Region, 2020 (%)
Figure 98.R&D Expenditure, 2018–2020 ($Million)
Figure 99.Pctel, Inc.: Revenue, 2018–2020 ($Million)
Figure 100.Pctel, Inc.: Revenue Share By Product Line, 2020 (%)
Figure 101.Pctel, Inc.: Revenue Share By Region, 2020 (%)
Figure 102.Reliance Industries: Revenue, 2018–2020 ($Million)
$6169
$6930
$10665
$4126
HAVE A QUERY?
OUR CUSTOMER
