
|
Report Metric |
Details |
|
Report Name |
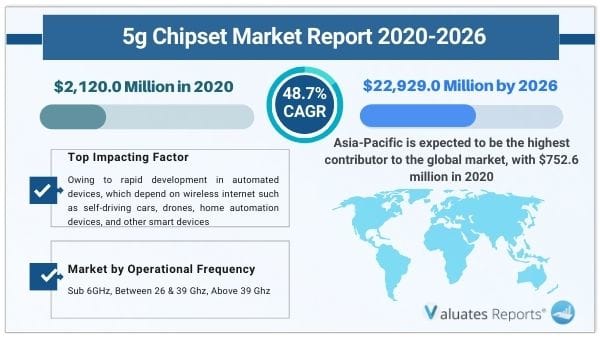
5G Chipset Market |
|
The market size in 2020 |
USD 2,120.0 Million |
|
The revenue forecast in 2026 |
USD 22,929.0 Million |
|
Growth Rate |
CAGR of 48.7% from 2020 to 2026 |
|
Market size available for years |
2020-2026 |
|
Forecast units |
Value (USD) |
|
Segments covered |
IC Type, Operational Frequency, Product, and Industry Vertical, and Region |
|
Report coverage |
Revenue & volume forecast, company share, competitive landscape, growth factors, and trends |
|
Geographic regions covered |
North America, Europe, Asia Pacific, Latin America, Middle East & Africa |
Ans. The global 5G Chipset market size is expected to be $2,120.0 million in 2020, and is projected to reach $22,929.0 million by 2026, registering a CAGR of 48.7% from 2020 to 2026.
Ans. The top companies profiled in the market are Qualcomm Technologies, Inc., Broadcom, Intel Corporation, Nokia Corporation, Samsung Electronics Co., Ltd., Mediatek Inc., Xilinx Inc., Huawei Technologies Co., Ltd., Qorvo, and Infineon Technologies AG.
Ans. Asia-Pacific is expected to be the highest contributor to the global market, with $752.6 million in 2020, and is estimated to reach $8,713.0 million by 2026, registering a CAGR of 50.5% during the forecast period.
Ans. The 5G chipset industry market is anticipated to witness a growth in demand owing to rapid development in automated devices, which depend on wireless internet such as self-driving cars, drones, home automation devices, and other smart devices
Ans. The forecast period for the 5G Chipset Market is 2021 to 2027.
TABLE OF CONTENT
List of Tables & Figures
TABLE 01. GLOBAL 5G CHIPSET MARKET, BY IC TYPE, 2020-2026($MILLION)
TABLE 02. 5G CHIPSET MARKET REVENUE FOR ASIC, BY REGION 2020-2026 ($MILLION)
TABLE 03. 5G CHIPSET MARKET REVENUE FOR RFIC, BY REGION 2020-2026 ($MILLION)
TABLE 04. 5G CHIPSET MARKET REVENUE FOR CELLULAR IC, BY REGION 20202026 ($MILLION)
TABLE 05. 5G CHIPSET MARKET REVENUE FOR MMWAVE IC, BY REGION 20202026 ($MILLION)
TABLE 06. GLOBAL 5G CHIPSET MARKET, BY OPERATIONAL FREQUENCY, 2020-2026($MILLION)
TABLE 07. 5G CHIPSET MARKET REVENUE FOR SUB 6GHZ, BY REGION 2020-2026 ($MILLION)
TABLE 08. 5G CHIPSET MARKET REVENUE FOR BETWEEN 26 & 39 GHZ, BY REGION 20202026 ($MILLION)
TABLE 09. 5G CHIPSET MARKET REVENUE FOR ABOVE 39 GHZ, BY REGION 20202026 ($MILLION)
TABLE 10. GLOBAL 5G CHIPSET MARKET, BY PRODUCT, 2020-2026($MILLION)
TABLE 11. 5G CHIPSET MARKET REVENUE FOR DEVICES, BY REGION 2020-2026 ($MILLION)
TABLE 12. 5G CHIPSET MARKET REVENUE FOR CUSTOMER PREMISES EQUIPMENT, BY REGION 2020-2026 ($MILLION)
TABLE 13. 5G CHIPSET MARKET REVENUE FOR NETWORK INFRASTRUCTURE EQUIPMENT, BY REGION 20202026 ($MILLION)
TABLE 14. GLOBAL 5G CHIPSET MARKET, BY INDUTRY VERTICAL, 20202026 ($MILLION)
TABLE 15. 5G CHIPSET MARKET REVENUE FOR AUTOMOTIVE & TRANSPORTATION, BY REGION, 20202026 ($MILLION)
TABLE 16. 5G CHIPSET MARKET REVENUE FOR ENERGY & UTILITIES, BY REGION 2020-2026 ($MILLION)
TABLE 17. 5G CHIPSET MARKET REVENUE FOR HEALTHCARE, BY REGION, 20202026 ($MILLION)
TABLE 18. 5G CHIPSET MARKET REVENUE FOR RETAIL, BY REGION, 20202026 ($MILLION)
TABLE 19. 5G CHIPSET MARKET REVENUE FOR CONSUMER ELECTRONICS, BY REGION 20202026 ($MILLION)
TABLE 20. 5G CHIPSET MARKET REVENUE FOR INDUSTRIAL AUTOMATION, BY REGION 20202026 ($MILLION)
TABLE 21. 5G CHIPSET MARKET REVENUE FOR OTHERS, BY REGION, 20202026 ($MILLION)
TABLE 22. NORTH AMERICA 5G CHIPSET MARKET, BY IC TYPE, 20202026 ($MILLION)
TABLE 23. NORTH AMERICA 5G CHIPSET MARKET, BY OPERATIONAL FREQUENCY, 20202026 ($MILLION)
TABLE 24. NORTH AMERICA 5G CHIPSET MARKET, BY PRODUCT, 20202026 ($MILLION)
TABLE 25. NORTH AMERICA 5G CHIPSET MARKET, BY INDUSTRY VERTICAL, 20202026 ($MILLION)
TABLE 26. U.S. 5G CHIPSET MARKET, BY IC TYPE, 20202026 ($MILLION)
TABLE 27. U.S. 5G CHIPSET MARKET, BY OPERATIONAL FREQUENCY, 20202026 ($MILLION)
TABLE 28. U. S. 5G CHIPSET MARKET, BY PRODUCT, 20202026 ($MILLION)
TABLE 29. U.S. 5G CHIPSET MARKET, BY INDUSTRY VERTICAL, 20202026 ($MILLION)
TABLE 30. CANADA 5G CHIPSET MARKET, BY IC TYPE, 20202026 ($MILLION)
TABLE 31. CANADA 5G CHIPSET MARKET, BY OPERATIONAL FREQUENCY, 20202026 ($MILLION)
TABLE 32. CANADA 5G CHIPSET MARKET, BY PRODUCT, 20202026 ($MILLION)
TABLE 33. CANADA 5G CHIPSET MARKET, BY INDUSTRY VERTICAL, 20202026 ($MILLION)
TABLE 34. MEXICO 5G CHIPSET MARKET, BY IC TYPE, 20202026 ($MILLION)
TABLE 35. MEXICO 5G CHIPSET MARKET, BY OPERATIONAL FREQUENCY, 20202026 ($MILLION)
TABLE 36. MEXICO 5G CHIPSET MARKET, BY PRODUCT, 20202026 ($MILLION)
TABLE 37. MEXICO 5G CHIPSET MARKET, BY INDUSTRY VERTICAL, 20202026 ($MILLION)
TABLE 38. EUROPE 5G CHIPSET MARKET, BY IC TYPE, 20202026 ($MILLION)
TABLE 39. EUROPE 5G CHIPSET MARKET, BY OPERATIONAL FREQUENCY, 20202026 ($MILLION)
TABLE 40. EUROPE 5G CHIPSET MARKET, BY PRODUCT, 20202026 ($MILLION)
TABLE 41. EUROPE 5G CHIPSET MARKET, BY INDUSTRY VERTICAL, 20202026 ($MILLION)
TABLE 42. UK 5G CHIPSET MARKET, BY IC TYPE, 20202026 ($MILLION)
TABLE 43. UK 5G CHIPSET MARKET, BY OPERATIONAL FREQUENCY, 20202026 ($MILLION)
TABLE 44. UK 5G CHIPSET MARKET, BY PRODUCT, 20202026 ($MILLION)
TABLE 45. UK 5G CHIPSET MARKET, BY INDUSTRY VERTICAL, 20202026 ($MILLION)
TABLE 46. GERMANY 5G CHIPSET MARKET, BY IC TYPE, 20202026 ($MILLION)
TABLE 47. GERMANY 5G CHIPSET MARKET, BY OPERATIONAL FREQUENCY, 20202026 ($MILLION)
TABLE 48. GERMANY 5G CHIPSET MARKET, BY PRODUCT, 20202026 ($MILLION)
TABLE 49. GERMANY 5G CHIPSET MARKET, BY INDUSTRY VERTICAL, 20202026 ($MILLION)
TABLE 50. FRANCE 5G CHIPSET MARKET, BY IC TYPE, 20202026 ($MILLION)
TABLE 51. FRANCE 5G CHIPSET MARKET, BY OPERATIONAL FREQUENCY, 20202026 ($MILLION)
TABLE 52. FRANCE 5G CHIPSET MARKET, BY PRODUCT, 20202026 ($MILLION)
TABLE 53. FRANCE 5G CHIPSET MARKET, BY INDUSTRY VERTICAL, 20202026 ($MILLION)
TABLE 54. RUSSIA 5G CHIPSET MARKET, BY IC TYPE, 20202026 ($MILLION)
TABLE 55. RUSSIA 5G CHIPSET MARKET, BY OPERATIONAL FREQUENCY, 20202026 ($MILLION)
TABLE 56. RUSSIA 5G CHIPSET MARKET, BY PRODUCT, 20202026 ($MILLION)
TABLE 57. RUSSIA 5G CHIPSET MARKET, BY INDUSTRY VERTICAL, 20202026 ($MILLION)
TABLE 58. REST OF EUROPE 5G CHIPSET MARKET, BY IC TYPE, 20202026 ($MILLION)
TABLE 59. REST OF EUROPE 5G CHIPSET MARKET, BY OPERATIONAL FREQUENCY, 20202026 ($MILLION)
TABLE 60. REST OF EUROPE 5G CHIPSET MARKET, BY PRODUCT, 20202026 ($MILLION)
TABLE 61. REST OF EUROPE 5G CHIPSET MARKET, BY INDUSTRY VERTICAL, 20202026 ($MILLION)
TABLE 62. ASIA-PACIFIC 5G CHIPSET MARKET, BY IC TYPE, 20202026 ($MILLION)
TABLE 63. ASIA-PACIFIC 5G CHIPSET MARKET, BY OPERATIONAL FREQUENCY, 20202026 ($MILLION)
TABLE 64. ASIA-PACIFIC 5G CHIPSET MARKET, BY PRODUCT, 20202026 ($MILLION)
TABLE 65. ASIA-PACIFIC 5G CHIPSET MARKET, BY INDUSTRY VERTICAL, 20202026 ($MILLION)
TABLE 66. CHINA 5G CHIPSET MARKET, BY IC TYPE, 20202026 ($MILLION)
TABLE 67. CHINA 5G CHIPSET MARKET, BY OPERATIONAL FREQUENCY, 20202026 ($MILLION)
TABLE 68. CHINA 5G CHIPSET MARKET, BY PRODUCT, 20202026 ($MILLION)
TABLE 69. CHINA 5G CHIPSET MARKET, BY INDUSTRY VERTICAL, 20202026 ($MILLION)
TABLE 70. JAPAN 5G CHIPSET MARKET, BY IC TYPE, 20202026 ($MILLION)
TABLE 71. JAPAN 5G CHIPSET MARKET, BY OPERATIONAL FREQUENCY, 20202026 ($MILLION)
TABLE 72. JAPAN 5G CHIPSET MARKET, BY PRODUCT, 20202026 ($MILLION)
TABLE 73. JAPAN 5G CHIPSET MARKET, BY INDUSTRY VERTICAL, 20202026 ($MILLION)
TABLE 74. INDIA 5G CHIPSET MARKET, BY IC TYPE, 20202026 ($MILLION)
TABLE 75. INDIA 5G CHIPSET MARKET, BY OPERATIONAL FREQUENCY, 20202026 ($MILLION)
TABLE 76. INDIA 5G CHIPSET MARKET, BY PRODUCT, 20202026 ($MILLION)
TABLE 77. INDIA 5G CHIPSET MARKET, BY INDUSTRY VERTICAL, 20202026 ($MILLION)
TABLE 78. SOUTH KOREA 5G CHIPSET MARKET, BY IC TYPE, 20202026 ($MILLION)
TABLE 79. SOUTH KOREA 5G CHIPSET MARKET, BY OPERATIONAL FREQUENCY, 20202026 ($MILLION)
TABLE 80. SOUTH KOREA 5G CHIPSET MARKET, BY PRODUCT, 20202026 ($MILLION)
TABLE 81. SOUTH KOREA 5G CHIPSET MARKET, BY INDUSTRY VERTICAL, 20202026 ($MILLION)
TABLE 82. REST OF ASIA-PACIFIC 5G CHIPSET MARKET, BY IC TYPE, 20202026 ($MILLION)
TABLE 83. REST OF ASIA-PACIFIC 5G CHIPSET MARKET, BY OPERATIONAL FREQUENCY, 20202026 ($MILLION)
TABLE 84. REST OF ASIA-PACIFIC 5G CHIPSET MARKET, BY PRODUCT, 20202026 ($MILLION)
TABLE 85. REST OF ASIA-PACIFIC 5G CHIPSET MARKET, BY INDUSTRY VERTICAL, 20202026 ($MILLION)
TABLE 86. LAMEA 5G CHIPSET MARKET, BY IC TYPE, 20202026 ($MILLION)
TABLE 87. LAMEA 5G CHIPSET MARKET, BY OPERATIONAL FREQUENCY, 20202026 ($MILLION)
TABLE 88. LAMEA 5G CHIPSET MARKET, BY PRODUCT, 20202026 ($MILLION)
TABLE 89. LAMEA 5G CHIPSET MARKET, BY INDUSTRY VERTICAL, 20202026 ($MILLION)
TABLE 90. LATIN AMERICA 5G CHIPSET MARKET, BY IC TYPE, 20202026 ($MILLION)
TABLE 91. LATIN AMERICA 5G CHIPSET MARKET, BY OPERATIONAL FREQUENCY, 20202026 ($MILLION)
TABLE 92. LATIN AMERICA 5G CHIPSET MARKET, BY PRODUCT, 20202026 ($MILLION)
TABLE 93. LATIN AMERICA 5G CHIPSET MARKET, BY INDUSTRY VERTICAL, 20202026 ($MILLION)
TABLE 94. MIDDLE EAST 5G CHIPSET MARKET, BY IC TYPE, 20202026 ($MILLION)
TABLE 95. MIDDLE EAST 5G CHIPSET MARKET, BY OPERATIONAL FREQUENCY, 20202026 ($MILLION)
TABLE 96. MIDDLE EAST 5G CHIPSET MARKET, BY PRODUCT, 20202026 ($MILLION)
TABLE 97. MIDDLE EAST 5G CHIPSET MARKET, BY INDUSTRY VERTICAL, 20202026 ($MILLION)
TABLE 98. AFRICA 5G CHIPSET MARKET, BY IC TYPE, 20202026 ($MILLION)
TABLE 99. AFRICA 5G CHIPSET MARKET, BY OPERATIONAL FREQUENCY, 20202026 ($MILLION)
TABLE 100. AFRICA 5G CHIPSET MARKET, BY PRODUCT, 20202026 ($MILLION)
TABLE 101. AFRICA 5G CHIPSET MARKET, BY INDUSTRY VERTICAL, 20202026 ($MILLION)
TABLE 102. BROADCOM: COMPANY SNAPSHOT
TABLE 103. BROADCOM: OPERATING SEGMENTS
TABLE 104. BROADCOM: PRODUCT PORTFOLIO
TABLE 105. BROADCOM: KEY STRATEGIC MOVES AND DEVELOPMENTS
TABLE 106. HUAWEI TECHNOLOGIES CO., LTD.: COMPANY SNAPSHOT
TABLE 107. HUAWEI TECHNOLOGIES CO., LTD.: OPERATING SEGMENTS
TABLE 108. HUAWEI TECHNOLOGIES CO., LTD.: PRODUCT PORTFOLIO
TABLE 109. HUAWEI TECHNOLOGIES CO., LTD.: KEY STRATEGIC MOVES AND DEVELOPMENTS
TABLE 110. INFINEON TECHNOLOGIES AG: COMPANY SNAPSHOT
TABLE 111. INFINEON TECHNOLOGIES AG: OPERATING SEGMENTS
TABLE 112. INFINEON TECHNOLOGIES AG: PRODUCT PORTFOLIO
TABLE 113. INFINEON TECHNOLOGIES AG: KEY STRATEGIC MOVES AND DEVELOPMENTS
TABLE 114. INTEL CORPORATION: COMPANY SNAPSHOT
TABLE 115. INTEL CORPORATION: OPERATING SEGMENTS
TABLE 116. INTEL CORPORATION: PRODUCT PORTFOLIO
TABLE 117. INTEL CORPORATION: KEY STRATEGIC MOVES AND DEVELOPMENTS
TABLE 118. MEDIATEK INC: COMPANY SNAPSHOT
TABLE 119. MEDIATEK INC: PRODUCT PORTFOLIO
TABLE 120. MEDIATEK INC: KEY STRATEGIC MOVES AND DEVELOPMENTS
TABLE 121. NOKIA CORPORATION: COMPANY SNAPSHOT
TABLE 122. NOKIA CORPORATION: OPERATING SEGMENTS
TABLE 123. NOKIA CORPORATION: PRODUCT PORTFOLIO
TABLE 124. QUALCOMM TECHNOLOGIES, INC.: COMPANY SNAPSHOT
TABLE 125. QUALCOMM TECHNOLOGIES, INC.: PRODUCT CATEGORY
TABLE 126. QUALCOMM TECHNOLOGIES, INC.: PRODUCT PORTFOLIO
TABLE 127. QORVO: COMPANY SNAPSHOT
TABLE 128. QORVO: OPERATING SEGMENTS
TABLE 129. QORVO: PRODUCT PORTFOLIO
TABLE 130. QORVO: KEY STRATEGIC MOVES AND DEVELOPMENTS
TABLE 131. SAMSUNG ELECTRONICS CO. LTD.: COMPANY SNAPSHOT
TABLE 132. SAMSUNG ELECTRONICS CO. LTD.: OPERATING SEGMENTS
TABLE 133. SAMSUNG ELECTRONICS CO. LTD.: PRODUCT PORTFOLIO
TABLE 134. SAMSUNG ELECTRONICS CO. LTD.: KEY STRATEGIC MOVES AND DEVELOPMENTS
TABLE 135. XILINX INC.: COMPANY SNAPSHOT
TABLE 136. XILINX INC.: OPERATING SEGMENTS
TABLE 137. XILINX INC.: PRODUCT PORTFOLIO
TABLE 138. XILINX INC.: KEY STRATEGIC MOVES AND DEVELOPMENTS
LIST OF FIGURES
FIGURE 01. KEY MARKET SEGMENTS
FIGURE 02. EXECUTIVE SUMMARY
FIGURE 03. EXECUTIVE SUMMARY
FIGURE 04. TOP IMPACTING FACTORS
FIGURE 05. TOP INVESTMENT POCKETS
FIGURE 06. TOP WINNING STRATEGIES, BY YEAR, 20152018*
FIGURE 07. TOP WINNING STRATEGIES, BY YEAR, 20152018*
FIGURE 08. TOP WINNING STRATEGIES, BY COMPANY, 20152018*
FIGURE 09. MODERATE-TO-HIGH BARGAINING POWER OF SUPPLIERS
FIGURE 10. MODERATE-TO-HIGH THREAT OF NEW ENTRANTS
FIGURE 11. MODERATE THREAT OF SUBSTITUTES
FIGURE 12. HIGH-TO-MODERATE INTENSITY OF RIVALRY
FIGURE 13. HIGH-TO-MODERATE BARGAINING POWER OF BUYERS
FIGURE 14. KEY PLAYER POSITIONING, 2017
FIGURE 15. GLOBAL 5G CHIPSET MARKET SHARE, BY IC TYPE, 20202026 (%)
FIGURE 16. COMPARATIVE SHARE ANALYSIS OF 5G CHIPSET MARKET FOR ASIC, BY COUNTRY, 2020 & 2026 (%)
FIGURE 17. COMPARATIVE SHARE ANALYSIS OF 5G CHIPSET MARKET FOR RFIC, BY COUNTRY, 2020 & 2026 (%)
FIGURE 18. COMPARATIVE SHARE ANALYSIS OF 5G CHIPSET MARKET FOR CELLULAR IC, BY COUNTRY, 2020 & 2026 (%)
FIGURE 19. COMPARATIVE SHARE ANALYSIS OF 5G CHIPSET MARKET FOR MMWAVE IC, BY COUNTRY, 2020 & 2026 (%)
FIGURE 20. GLOBAL 5G CHIPSET MARKET SHARE, BY OPERATIONAL FREQUENCY, 20202026 (%)
FIGURE 21. COMPARATIVE SHARE ANALYSIS OF 5G CHIPSET MARKET FOR SUB 6GHZ, BY COUNTRY, 2020 & 2026 (%)
FIGURE 22. COMPARATIVE SHARE ANALYSIS OF 5G CHIPSET MARKET FOR BETWEEN 26 & 39 GHZ, BY COUNTRY, 2020 & 2026 (%)
FIGURE 23. COMPARATIVE SHARE ANALYSIS OF 5G CHIPSET MARKET FOR ABOVE 39 GHZ, BY COUNTRY, 2020 & 2026 (%)
FIGURE 24. GLOBAL 5G CHIPSET MARKET SHARE, BY PRODUCT, 20202026 (%)
FIGURE 25. COMPARATIVE SHARE ANALYSIS OF 5G CHIPSET MARKET FOR DEVICES, BY COUNTRY, 2020 & 2026 (%)
FIGURE 26. COMPARATIVE SHARE ANALYSIS OF 5G CHIPSET MARKET FOR CUSTOMER PREMISES EQUIPMENT, BY COUNTRY, 2020 & 2026 (%)
FIGURE 27. COMPARATIVE SHARE ANALYSIS OF 5G CHIPSET MARKET FOR NETWORK INFRASTRUCTURE EQUIPMENT, BY COUNTRY, 2020 & 2026 (%)
FIGURE 28. GLOBAL 5G CHIPSET MARKET SHARE, BY INDUSTRY VERTICAL, 20202026 (%)
FIGURE 29. COMPARATIVE SHARE ANALYSIS OF 5G CHIPSET MARKET FOR AUTOMOTIVE & TRANSPORTATION, BY COUNTRY, 2020 & 2026 (%)
FIGURE 30. COMPARATIVE SHARE ANALYSIS OF 5G CHIPSET MARKET FOR ENERGY & UTILITIES, BY COUNTRY, 2020 & 2026 (%)
FIGURE 31. COMPARATIVE SHARE ANALYSIS OF 5G CHIPSET MARKET FOR HEALTHCARE, BY COUNTRY, 2020 & 2026 (%)
FIGURE 32. COMPARATIVE SHARE ANALYSIS OF 5G CHIPSET MARKET FOR RETAIL, BY COUNTRY, 2020 & 2026 (%)
FIGURE 33. COMPARATIVE SHARE ANALYSIS OF 5G CHIPSET MARKET FOR CONSUMER ELECTRONICS, BY COUNTRY, 2020 & 2026 (%)
FIGURE 34. COMPARATIVE SHARE ANALYSIS OF 5G CHIPSET MARKET FOR INDUSTRIAL AUTOMATION, BY COUNTRY, 2020 & 2026 (%)
FIGURE 35. COMPARATIVE SHARE ANALYSIS OF 5G CHIPSET MARKET FOR OTHERS, BY COUNTRY, 2020 & 2026 (%)
FIGURE 36. 5G CHIPSET MARKET, BY REGION, 2020-2026 (%)
FIGURE 37. COMPARATIVE SHARE ANALYSIS OF 5G CHIPSET MARKET, BY COUNTRY, 20202026 (%)
FIGURE 38. U.S. 5G CHIPSET MARKET, 20202026 ($MILLION)
FIGURE 39. CANADA 5G CHIPSET MARKET, 20202026 ($MILLION)
FIGURE 40. MEXICO 5G CHIPSET MARKET, 20202026 ($MILLION)
FIGURE 41. COMPARATIVE SHARE ANALYSIS OF 5G CHIPSET MARKET, BY COUNTRY, 20202026 (%)
FIGURE 42. UK 5G CHIPSET MARKET, 20202026 ($MILLION)
FIGURE 43. GERMANY 5G CHIPSET MARKET, 20202026 ($MILLION)
FIGURE 44. FRANCE 5G CHIPSET MARKET, 20202026 ($MILLION)
FIGURE 45. RUSSIA 5G CHIPSET MARKET, 20202026 ($MILLION)
FIGURE 46. REST OF EUROPE 5G CHIPSET MARKET, 20202026 ($MILLION)
FIGURE 47. COMPARATIVE SHARE ANALYSIS OF 5G CHIPSET MARKET, BY COUNTRY, 20202026 (%)
FIGURE 48. CHINA 5G CHIPSET MARKET, 20202026 ($MILLION)
FIGURE 49. JAPAN 5G CHIPSET MARKET, 20202026 ($MILLION)
FIGURE 50. INDIA 5G CHIPSET MARKET, 20202026 ($MILLION)
FIGURE 51. SOUTH KOREA 5G CHIPSET MARKET, 20202026 ($MILLION)
FIGURE 52. REST OF ASIA-PACIFIC 5G CHIPSET MARKET, 20202026 ($MILLION)
FIGURE 53. COMPARATIVE SHARE ANALYSIS OF 5G CHIPSET MARKET, BY COUNTRY, 20202026 (%)
FIGURE 54. LATIN AMERICA 5G CHIPSET MARKET, 20202026 ($MILLION)
FIGURE 55. MIDDLE EAST 5G CHIPSET MARKET, 20202026 ($MILLION)
FIGURE 56. AFRICA 5G CHIPSET MARKET, 20202026 ($MILLION)
FIGURE 57. BROADCOM: REVENUE, 20152017 ($MILLION)
FIGURE 58. BROADCOM: REVENUE SHARE BY SEGMENT, 2017 (%)
FIGURE 59. BROADCOM: REVENUE SHARE BY REGION, 2017 (%)
FIGURE 60. HUAWEI TECHNOLOGIES CO., LTD.: NET SALES, 20152017 ($MILLION)
FIGURE 61. HUAWEI TECHNOLOGIES CO., LTD.: REVENUE SHARE BY SEGMENT, 2017 (%)
FIGURE 62. HUAWEI TECHNOLOGIES CO., LTD.: REVENUE SHARE BY REGION, 2017 (%)
FIGURE 63. INFINEON TECHNOLOGIES AG: NET SALES, 20162018 ($MILLION)
FIGURE 64. INFINEON TECHNOLOGIES AG: REVENUE SHARE BY SEGMENT, 2018 (%)
FIGURE 65. INFINEON TECHNOLOGIES AG: REVENUE SHARE BY REGION, 2018 (%)
FIGURE 66. INTEL CORPORATION: NET SALES, 20152017 ($MILLION)
FIGURE 67. INTEL CORPORATION: REVENUE SHARE BY SEGMENT, 2017 (%)
FIGURE 68. INTEL CORPORATION: REVENUE SHARE BY REGION, 2017 (%)
FIGURE 69. MEDIATEK INC: REVENUE, 20152017 ($MILLION)
FIGURE 70. MEDIATEK INC: REVENUE SHARE BY REGION, 2017 (%)
FIGURE 71. NOKIA CORPORATION: REVENUE, 20152017 ($MILLION)
FIGURE 72. NOKIA CORPORATION: REVENUE SHARE BY SEGMENT, 2017 (%)
FIGURE 73. NOKIA CORPORATION: REVENUE SHARE BY REGION, 2017 (%)
FIGURE 74. QUALCOMM TECHNOLOGIES, INC.: REVENUE, 20152017 ($MILLION)
FIGURE 75. QUALCOMM TECHNOLOGIES, INC.: REVENUE SHARE BY SEGMENT, 2017 (%)
FIGURE 76. MICROSOFT CORPORATION: REVENUE SHARE BY REGION, 2017 (%)
FIGURE 77. QORVO: REVENUE, 20152017 ($MILLION)
FIGURE 78. QORVO: REVENUE SHARE BY SEGMENT, 2017 (%)
FIGURE 79. QORVO: REVENUE SHARE BY REGION, 2017 (%)
FIGURE 80. SAMSUNG ELECTRONICS CO. LTD.: NET SALES, 20152017 ($MILLION)
FIGURE 81. SAMSUNG ELECTRONICS CO. LTD.: REVENUE SHARE BY SEGMENT, 2017 (%)
FIGURE 82. SAMSUNG ELECTRONICS CO. LTD.: REVENUE SHARE BY REGION, 2017 (%)
FIGURE 83. XILINX INC.: REVENUE, 20152017 ($MILLION)
FIGURE 84. XILINX INC.: REVENUE SHARE BY SEGMENT, 2017 (%)
FIGURE 85. XILINX INC.: REVENUE SHARE BY REGION, 2017 (%)
$5370
$6450
$8995
HAVE A QUERY?
OUR CUSTOMER

SIMILAR REPORTS