0
U.S. (TOLL FREE)
+1 (315) 215-3225
Automative

0
U.S. (TOLL FREE)
+1 (315) 215-3225
Temperature Sensor Market By Type (Thermocouple, Thermistor, Resistance Temperature Detector (RTD), Infrared Temperature Sensor, Others), By Industry Vertical (Manufacturing, Chemical, Healthcare and Pharmaceutical, Automotive, Oil and Gas): Global Opportunity Analysis and Industry Forecast, 2023-2032
Published Date: April 2023
|
Report Code: ALLI-Manu-0B8
Home | Market Reports | Arts & Entertainment| Comics & Animation| Comics
Temperature Sensor Market
BUY CHAPTERS

Temperature Sensor Market By Type (Thermocouple, Thermistor, Resistance Temperature Detector (RTD), Infrared Temperature Sensor, Others), By Industry Vertical (Manufacturing, Chemical, Healthcare and Pharmaceutical, Automotive, Oil and Gas): Global Opportunity Analysis and Industry Forecast, 2023-2032

Code: ALLI-Manu-0B8
Report
April 2023
Pages:358
Allied Market Research
Buy Now with 15% Discount
DESCRIPTION
TABLE OF CONTENT
TABLES & FIGURES

Temperature Sensor Market Size

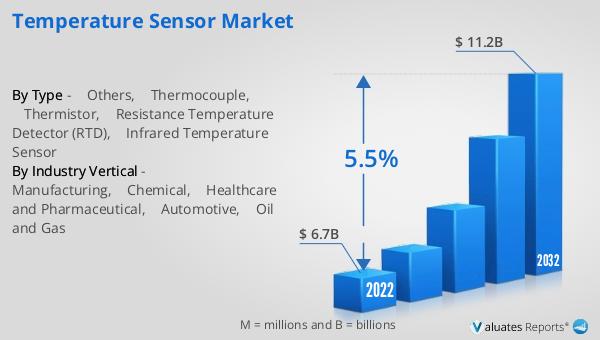
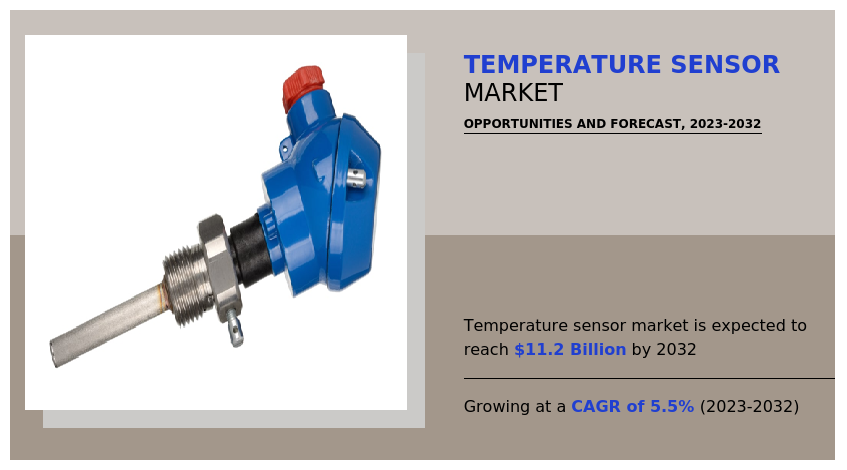
According to a new report published by , titled, “Temperature Sensor Market," The temperature sensor market was valued at $6.7 billion in 2022, and is estimated to reach $11.2 billion by 2032, growing at a CAGR of 5.5% from 2023 to 2032.

Temperature Sensor Market

Temperature Sensor Market

A temperature sensor is a device that is used to measure the temperature of a particular object, environment, or substance. Temperature sensors can be found in a wide range of applications, from industrial and scientific settings to consumer electronics and household appliances.
Key factors propelling the growth of the temperature sensor market include the varied features of temperature sensors which are gaining popularity among consumers. Some of the features such as sensitivity, accuracy, range, and stability. External factors such as electromagnetic interference (EMI) and radio frequency interference (RFI) can affect the performance of a temperature sensor.
The market also offers growth opportunities to the key players in the market including recent advances in manufacturing technology that have largely dissipated the shortcomings of traditional NTC and PTC thermistors, such as aging, compatibility, and unreliability. In addition, the surge in demand for mobile communication devices has increased the demand for NTC thermistors. With several industrial plants adopting intelligent motors, demand for PTC thermistors, which act as overcurrent protection for various motors, is expected to rise during the forecast period.
Emerging technologies for the healthcare industry in major economies and growing applications such as intelligent patient monitoring systems are key factors driving the growth of the thermistor market during the forecast period. Thermistor temperature sensors have been used for decades in the automotive industry to signal gauges and are now used in electrical controls. As system complexity increased, so did the number of temperature sensor types and performance requirements. Regulations, technological advancements, and customer requirements are the main reasons for the increased adoption of thermistor temperature sensors in the industry.
Additionally, the rise of data centers, smart offices, special economic zones (SEZs), warehouses, shopping malls, etc., are increasing the demand for HVAC systems in the region. As thermistor-based sensors evolve as integral units in his HVAC systems, the number of data centers increases, especially in developing countries, increasing demand for the market under study. It is estimated that China's Internet data centers will grow to be 22 times the size of those in the United States, or at least 10 times the size of Japan's current area. This region dominates the global HVAC market, thus providing opportunities for the market under study. In addition, it is estimated that the increase in temperature sensitive manufacturing facilities has driven the adoption of HVAC systems, subsequently increasing the demand for NTC thermistors in the region. In July 2022, WIKA launched a bimetal thermometer, the model TG58SA. This measuring instrument, whose stem has a hemispherical bottom, can be cleaned in a process-safe manner in accordance with 3-A and EHEDG. The thermometer offers a high overtemperature resistance. Its shatterproof window is also UV-resistant.
Technological changes in the automotive industry have led to a surge in global demand for connected and autonomous vehicles, leading suppliers to increasingly develop industry-specific solutions. For example, in February 2020, Texas Instruments expanded its temperature sensor portfolio to include Linear thermistors, which offer up to 50% more accuracy compared to NTC thermistors. It is also one of the smallest linear thermistors available on the market.  In July 2022, STMicroelectronics unveiled its FlightSense Time-of-Flight (ToF) multi-zone sensor. It is delivered together with a suite of valuable software algorithms. The combination provides a turnkey solution for user detection, gesture recognition, and intruder alert, specially designed for the PC market. ST's FlightSense multi-zone sensors continuously scan their field of view to map the scene and gather intelligence without using a camera or recording images.
The global temperature sensors market is segmented into type, industry vertical, and region. Based on type, it is categorized into thermistor, thermocouple, resistance temperature detector, infrared temperature sensor, and others. Based on industry vertical, it is fragmented into healthcare, healthcare & pharmaceutical, chemical, oil & gas, energy & power, and automotive. Based on region, the temperature sensors market trends are analyzed across North America (U.S., Canada, and Mexico), Europe (Germany, France, UK, Italy, and Rest of Europe), Asia-Pacific (China, Japan, India, South Korea, and rest of Asia-Pacific), and LAMEA (Latin America, Middle East, and Africa). 
The key players operating in the market include temperature sensor market players, such as Analog Devices, Inc, TE Connectivity Ltd., Texas Instruments Inc., Siemens AG,    Amphenol Advanced Sensors, STMicroelectronics STMicroelectronics N.V., Honeywell International Inc., Emerson Electric Co., WIKA Instruments India Pvt. Ltd., and Endress +Hauser Group Services AG.
Key Market Insights
By type, the thermocouple segment was the highest revenue contributor to the market and is expected to follow the same trend during the forecast period. However, the same segment is estimated to be the fastest growing segment during the forecast period.
The oil and gas segment generated the largest share in 2022.
Based on region, Asia-Pacific was the highest revenue contributor, accounting for largest revenue in 2022, and is estimated to reach $6,02 billion by 2032, registering a CAGR of 6.38%.
 

Overview

A temperature sensor is an electronic device that is used to measure temperature, either in a specific area or within a particular object. It can be designed to detect changes in a variety of mediums such as air, liquid, or solid materials.
Some of the primary driving factors of the temperature sensor market are the increase in usage of HVAC modules in the automotive sector and industrial end-user applications. Growth in consumer electronics demand is anticipated to drive market growth even further. A rise in the focus on security and surveillance, as well as numerous government initiatives toward safety standards, are also predicted to drive the temperature sensor market.
The increase in acceptance of wireless temperature sensors in numerous industries is mostly due to the use of non-contact measuring capabilities, which allow them to reach places where physical deployment of a device is impractical. Furthermore, the nature of the industry makes the usage of temperature sensors crucial, as it is essential to monitor the temperature changes in these lines and maintain safe working conditions. The super-heated steam and water pipelines are extended, and accidents in these may lead to the damage and loss of other assets, which is one of the driving factors for the demand and regulatory needs.
The global temperature sensors market is segmented into type, industry vertical, and region. On the basis of type, it is categorized into thermistor, thermocouple, resistance temperature detector, infrared temperature sensor, and others. On the basis of industry vertical, it is fragmented into healthcare, healthcare & pharmaceutical, chemical, oil & gas, energy & power, and automotive. On the basis of region, the temperature sensors market trends are analyzed across North America (U.S., Canada, and Mexico), Europe (Germany, France, UK, Italy, and Rest of Europe), Asia-Pacific (China, Japan, India, South Korea, and rest of Asia-Pacific), and LAMEA (Latin America, Middle East, and Africa). 
The key players operating in the market include temperature sensor market players, such as Analog Devices, Inc, TE Connectivity Ltd., Texas Instruments Inc., Siemens AG, Amphenol Advanced Sensors, STMicroelectronics STMicroelectronics N.V., Honeywell International Inc., Emerson Electric Co., WIKA Instruments India Pvt. Ltd., and Endress +Hauser Group Services AG.

Key Benefits For Stakeholders

●This report provides a quantitative analysis of the market segments, current trends, estimations, and dynamics of the temperature sensor market analysis from 2022 to 2032 to identify the prevailing temperature sensor market opportunities.
●The market research is offered along with information related to key drivers, restraints, and opportunities.
●Porter's five forces analysis highlights the potency of buyers and suppliers to enable stakeholders make profit-oriented business decisions and strengthen their supplier-buyer network.
●In-depth analysis of the temperature sensor market segmentation assists to determine the prevailing market opportunities.
●Major countries in each region are mapped according to their revenue contribution to the global market.
●Market player positioning facilitates benchmarking and provides a clear understanding of the present position of the market players.
●The report includes the analysis of the regional as well as global temperature sensor market trends, key players, market segments, application areas, and market growth strategies.
Key Market Segments
○ WIKA Instruments India Pvt. Ltd

Scope of Temperature Sensor Market Report

Report Metric Details
Report Name Temperature Sensor Market
Accounted market size in 2022 $ 6.7 in billion
Forecasted market size in 2032 $ 11.2 billion
CAGR 5.5%
Base Year 2022
Forecasted years 2024 - 2032
By Type ● Others
● Thermocouple
● Thermistor
● Resistance Temperature Detector (RTD)
● Infrared Temperature Sensor
By Industry Vertical ● Manufacturing
● Chemical
● Healthcare and Pharmaceutical
● Automotive
● Oil and Gas
By Region
  • North America (United States, Canada)
  • Europe (Germany, France, UK, Italy, Russia) Rest of Europe
  • Nordic Countries
  • Asia-Pacific (China, Japan, South Korea)
  • Southeast Asia (India, Australia)
  • Rest of Asia
  • Latin America (Mexico, Brazil)
  • Rest of Latin America
  • Middle East & Africa (Turkey, Saudi Arabia, UAE, Rest of MEA)
Forecast units USD million in value
Report coverage Revenue and volume forecast, company share, competitive landscape, growth factors and trends

FAQ for this report

How fast is Temperature Sensor Market growing?

Ans: The Temperature Sensor Market witnessing a CAGR of 5.5% during the forecast period 2024-2032.

What is the Temperature Sensor Market size in 2032?

Ans: The Temperature Sensor Market size in 2032 will be $ 11.2 billion.

What are the Type segmentation covered in the Temperature Sensor Market report?

Ans: The Types covered in the Temperature Sensor Market report are ● Others, ● Thermocouple, ● Thermistor, ● Resistance Temperature Detector (RTD), ● Infrared Temperature Sensor

CHAPTER 1: INTRODUCTION
1.1. Report description
1.2. Key market segments
1.3. Key benefits to the stakeholders
1.4. Research Methodology
1.4.1. Primary research
1.4.2. Secondary research
1.4.3. Analyst tools and models
CHAPTER 2: EXECUTIVE SUMMARY
2.1. CXO Perspective
CHAPTER 3: MARKET OVERVIEW
3.1. Market definition and scope
3.2. Key findings
3.2.1. Top impacting factors
3.2.2. Top investment pockets
3.3. Porter’s five forces analysis
3.3.1. Bargaining power of suppliers
3.3.2. Bargaining power of buyers
3.3.3. Threat of substitutes
3.3.4. Threat of new entrants
3.3.5. Intensity of rivalry
3.4. Market dynamics
3.4.1. Drivers
3.4.1.1. Surge in penetration of temperature sensors in advanced and portable healthcare equipment.
3.4.1.2. Rapid industrial automation.
3.4.2. Restraints
3.4.2.1. Saturation in personal computer sales owing to the increase in popularity of tablets and smartphones, restricting the market growth.
3.4.3. Opportunities
3.4.3.1. Increase in adoption in automotive sector.
3.5. COVID-19 Impact Analysis on the market
CHAPTER 4: TEMPERATURE SENSOR MARKET, BY TYPE
4.1. Overview
4.1.1. Market size and forecast
4.2. Thermocouple
4.2.1. Key market trends, growth factors and opportunities
4.2.2. Market size and forecast, by region
4.2.3. Market share analysis by country
4.3. Thermistor
4.3.1. Key market trends, growth factors and opportunities
4.3.2. Market size and forecast, by region
4.3.3. Market share analysis by country
4.4. Resistance Temperature Detector (RTD)
4.4.1. Key market trends, growth factors and opportunities
4.4.2. Market size and forecast, by region
4.4.3. Market share analysis by country
4.5. Infrared Temperature Sensor
4.5.1. Key market trends, growth factors and opportunities
4.5.2. Market size and forecast, by region
4.5.3. Market share analysis by country
4.6. Others
4.6.1. Key market trends, growth factors and opportunities
4.6.2. Market size and forecast, by region
4.6.3. Market share analysis by country
CHAPTER 5: TEMPERATURE SENSOR MARKET, BY INDUSTRY VERTICAL
5.1. Overview
5.1.1. Market size and forecast
5.2. Manufacturing
5.2.1. Key market trends, growth factors and opportunities
5.2.2. Market size and forecast, by region
5.2.3. Market share analysis by country
5.3. Chemical
5.3.1. Key market trends, growth factors and opportunities
5.3.2. Market size and forecast, by region
5.3.3. Market share analysis by country
5.4. Healthcare and Pharmaceutical
5.4.1. Key market trends, growth factors and opportunities
5.4.2. Market size and forecast, by region
5.4.3. Market share analysis by country
5.5. Automotive
5.5.1. Key market trends, growth factors and opportunities
5.5.2. Market size and forecast, by region
5.5.3. Market share analysis by country
5.6. Oil and Gas
5.6.1. Key market trends, growth factors and opportunities
5.6.2. Market size and forecast, by region
5.6.3. Market share analysis by country
CHAPTER 6: TEMPERATURE SENSOR MARKET, BY REGION
6.1. Overview
6.1.1. Market size and forecast By Region
6.2. North America
6.2.1. Key trends and opportunities
6.2.2. Market size and forecast, by Type
6.2.3. Market size and forecast, by Industry Vertical
6.2.4. Market size and forecast, by country
6.2.4.1. U.S.
6.2.4.1.1. Key market trends, growth factors and opportunities
6.2.4.1.2. Market size and forecast, by Type
6.2.4.1.3. Market size and forecast, by Industry Vertical
6.2.4.2. Canada
6.2.4.2.1. Key market trends, growth factors and opportunities
6.2.4.2.2. Market size and forecast, by Type
6.2.4.2.3. Market size and forecast, by Industry Vertical
6.2.4.3. Mexico
6.2.4.3.1. Key market trends, growth factors and opportunities
6.2.4.3.2. Market size and forecast, by Type
6.2.4.3.3. Market size and forecast, by Industry Vertical
6.3. Europe
6.3.1. Key trends and opportunities
6.3.2. Market size and forecast, by Type
6.3.3. Market size and forecast, by Industry Vertical
6.3.4. Market size and forecast, by country
6.3.4.1. UK
6.3.4.1.1. Key market trends, growth factors and opportunities
6.3.4.1.2. Market size and forecast, by Type
6.3.4.1.3. Market size and forecast, by Industry Vertical
6.3.4.2. Germany
6.3.4.2.1. Key market trends, growth factors and opportunities
6.3.4.2.2. Market size and forecast, by Type
6.3.4.2.3. Market size and forecast, by Industry Vertical
6.3.4.3. France
6.3.4.3.1. Key market trends, growth factors and opportunities
6.3.4.3.2. Market size and forecast, by Type
6.3.4.3.3. Market size and forecast, by Industry Vertical
6.3.4.4. Rest of Europe
6.3.4.4.1. Key market trends, growth factors and opportunities
6.3.4.4.2. Market size and forecast, by Type
6.3.4.4.3. Market size and forecast, by Industry Vertical
6.4. Asia-Pacific
6.4.1. Key trends and opportunities
6.4.2. Market size and forecast, by Type
6.4.3. Market size and forecast, by Industry Vertical
6.4.4. Market size and forecast, by country
6.4.4.1. China
6.4.4.1.1. Key market trends, growth factors and opportunities
6.4.4.1.2. Market size and forecast, by Type
6.4.4.1.3. Market size and forecast, by Industry Vertical
6.4.4.2. Japan
6.4.4.2.1. Key market trends, growth factors and opportunities
6.4.4.2.2. Market size and forecast, by Type
6.4.4.2.3. Market size and forecast, by Industry Vertical
6.4.4.3. India
6.4.4.3.1. Key market trends, growth factors and opportunities
6.4.4.3.2. Market size and forecast, by Type
6.4.4.3.3. Market size and forecast, by Industry Vertical
6.4.4.4. South Korea
6.4.4.4.1. Key market trends, growth factors and opportunities
6.4.4.4.2. Market size and forecast, by Type
6.4.4.4.3. Market size and forecast, by Industry Vertical
6.4.4.5. Rest of Asia-Pacific
6.4.4.5.1. Key market trends, growth factors and opportunities
6.4.4.5.2. Market size and forecast, by Type
6.4.4.5.3. Market size and forecast, by Industry Vertical
6.5. LAMEA
6.5.1. Key trends and opportunities
6.5.2. Market size and forecast, by Type
6.5.3. Market size and forecast, by Industry Vertical
6.5.4. Market size and forecast, by country
6.5.4.1. Latin America
6.5.4.1.1. Key market trends, growth factors and opportunities
6.5.4.1.2. Market size and forecast, by Type
6.5.4.1.3. Market size and forecast, by Industry Vertical
6.5.4.2. Middle East
6.5.4.2.1. Key market trends, growth factors and opportunities
6.5.4.2.2. Market size and forecast, by Type
6.5.4.2.3. Market size and forecast, by Industry Vertical
6.5.4.3. Africa
6.5.4.3.1. Key market trends, growth factors and opportunities
6.5.4.3.2. Market size and forecast, by Type
6.5.4.3.3. Market size and forecast, by Industry Vertical
CHAPTER 7: COMPETITIVE LANDSCAPE
7.1. Introduction
7.2. Top winning strategies
7.3. Product Mapping of Top 10 Player
7.4. Competitive Dashboard
7.5. Competitive Heatmap
7.6. Top player positioning, 2022
CHAPTER 8: COMPANY PROFILES
8.1. Honeywell International Inc.
8.1.1. Company overview
8.1.2. Key Executives
8.1.3. Company snapshot
8.1.4. Operating business segments
8.1.5. Product portfolio
8.1.6. Business performance
8.1.7. Key strategic moves and developments
8.2. TE Connectivity Ltd.
8.2.1. Company overview
8.2.2. Key Executives
8.2.3. Company snapshot
8.2.4. Operating business segments
8.2.5. Product portfolio
8.2.6. Business performance
8.2.7. Key strategic moves and developments
8.3. Texas Instruments Inc.
8.3.1. Company overview
8.3.2. Key Executives
8.3.3. Company snapshot
8.3.4. Operating business segments
8.3.5. Product portfolio
8.3.6. Business performance
8.3.7. Key strategic moves and developments
8.4. EndressHauser Group Services AG
8.4.1. Company overview
8.4.2. Key Executives
8.4.3. Company snapshot
8.4.4. Operating business segments
8.4.5. Product portfolio
8.4.6. Business performance
8.4.7. Key strategic moves and developments
8.5. Siemens AG
8.5.1. Company overview
8.5.2. Key Executives
8.5.3. Company snapshot
8.5.4. Operating business segments
8.5.5. Product portfolio
8.5.6. Business performance
8.5.7. Key strategic moves and developments
8.6. Analog Devices, Inc
8.6.1. Company overview
8.6.2. Key Executives
8.6.3. Company snapshot
8.6.4. Operating business segments
8.6.5. Product portfolio
8.6.6. Business performance
8.7. Emerson
8.7.1. Company overview
8.7.2. Key Executives
8.7.3. Company snapshot
8.7.4. Operating business segments
8.7.5. Product portfolio
8.7.6. Business performance
8.8. Amphenol Advanced Sensors
8.8.1. Company overview
8.8.2. Key Executives
8.8.3. Company snapshot
8.8.4. Operating business segments
8.8.5. Product portfolio
8.9. WIKA Instruments India Pvt. Ltd.
8.9.1. Company overview
8.9.2. Key Executives
8.9.3. Company snapshot
8.9.4. Operating business segments
8.9.5. Product portfolio
8.9.6. Key strategic moves and developments
8.10. STMicroelectronics
8.10.1. Company overview
8.10.2. Key Executives
8.10.3. Company snapshot
8.10.4. Operating business segments
8.10.5. Product portfolio
8.10.6. Business performance
8.10.7. Key strategic moves and development
LIST OF TABLES
TABLE 01. GLOBAL TEMPERATURE SENSOR MARKET, BY TYPE, 2022-2032 ($MILLION)
TABLE 02. TEMPERATURE SENSOR MARKET FOR THERMOCOUPLE, BY REGION, 2022-2032 ($MILLION)
TABLE 03. TEMPERATURE SENSOR MARKET FOR THERMISTOR, BY REGION, 2022-2032 ($MILLION)
TABLE 04. TEMPERATURE SENSOR MARKET FOR RESISTANCE TEMPERATURE DETECTOR (RTD), BY REGION, 2022-2032 ($MILLION)
TABLE 05. TEMPERATURE SENSOR MARKET FOR INFRARED TEMPERATURE SENSOR, BY REGION, 2022-2032 ($MILLION)
TABLE 06. TEMPERATURE SENSOR MARKET FOR OTHERS, BY REGION, 2022-2032 ($MILLION)
TABLE 07. GLOBAL TEMPERATURE SENSOR MARKET, BY INDUSTRY VERTICAL, 2022-2032 ($MILLION)
TABLE 08. TEMPERATURE SENSOR MARKET FOR MANUFACTURING, BY REGION, 2022-2032 ($MILLION)
TABLE 09. TEMPERATURE SENSOR MARKET FOR CHEMICAL, BY REGION, 2022-2032 ($MILLION)
TABLE 10. TEMPERATURE SENSOR MARKET FOR HEALTHCARE AND PHARMACEUTICAL, BY REGION, 2022-2032 ($MILLION)
TABLE 11. TEMPERATURE SENSOR MARKET FOR AUTOMOTIVE, BY REGION, 2022-2032 ($MILLION)
TABLE 12. TEMPERATURE SENSOR MARKET FOR OIL AND GAS, BY REGION, 2022-2032 ($MILLION)
TABLE 13. TEMPERATURE SENSOR MARKET, BY REGION, 2022-2032 ($MILLION)
TABLE 14. NORTH AMERICA TEMPERATURE SENSOR MARKET, BY TYPE, 2022-2032 ($MILLION)
TABLE 15. NORTH AMERICA TEMPERATURE SENSOR MARKET, BY INDUSTRY VERTICAL, 2022-2032 ($MILLION)
TABLE 16. NORTH AMERICA TEMPERATURE SENSOR MARKET, BY COUNTRY, 2022-2032 ($MILLION)
TABLE 17. U.S. TEMPERATURE SENSOR MARKET, BY TYPE, 2022-2032 ($MILLION)
TABLE 18. U.S. TEMPERATURE SENSOR MARKET, BY INDUSTRY VERTICAL, 2022-2032 ($MILLION)
TABLE 19. CANADA TEMPERATURE SENSOR MARKET, BY TYPE, 2022-2032 ($MILLION)
TABLE 20. CANADA TEMPERATURE SENSOR MARKET, BY INDUSTRY VERTICAL, 2022-2032 ($MILLION)
TABLE 21. MEXICO TEMPERATURE SENSOR MARKET, BY TYPE, 2022-2032 ($MILLION)
TABLE 22. MEXICO TEMPERATURE SENSOR MARKET, BY INDUSTRY VERTICAL, 2022-2032 ($MILLION)
TABLE 23. EUROPE TEMPERATURE SENSOR MARKET, BY TYPE, 2022-2032 ($MILLION)
TABLE 24. EUROPE TEMPERATURE SENSOR MARKET, BY INDUSTRY VERTICAL, 2022-2032 ($MILLION)
TABLE 25. EUROPE TEMPERATURE SENSOR MARKET, BY COUNTRY, 2022-2032 ($MILLION)
TABLE 26. UK TEMPERATURE SENSOR MARKET, BY TYPE, 2022-2032 ($MILLION)
TABLE 27. UK TEMPERATURE SENSOR MARKET, BY INDUSTRY VERTICAL, 2022-2032 ($MILLION)
TABLE 28. GERMANY TEMPERATURE SENSOR MARKET, BY TYPE, 2022-2032 ($MILLION)
TABLE 29. GERMANY TEMPERATURE SENSOR MARKET, BY INDUSTRY VERTICAL, 2022-2032 ($MILLION)
TABLE 30. FRANCE TEMPERATURE SENSOR MARKET, BY TYPE, 2022-2032 ($MILLION)
TABLE 31. FRANCE TEMPERATURE SENSOR MARKET, BY INDUSTRY VERTICAL, 2022-2032 ($MILLION)
TABLE 32. REST OF EUROPE TEMPERATURE SENSOR MARKET, BY TYPE, 2022-2032 ($MILLION)
TABLE 33. REST OF EUROPE TEMPERATURE SENSOR MARKET, BY INDUSTRY VERTICAL, 2022-2032 ($MILLION)
TABLE 34. ASIA-PACIFIC TEMPERATURE SENSOR MARKET, BY TYPE, 2022-2032 ($MILLION)
TABLE 35. ASIA-PACIFIC TEMPERATURE SENSOR MARKET, BY INDUSTRY VERTICAL, 2022-2032 ($MILLION)
TABLE 36. ASIA-PACIFIC TEMPERATURE SENSOR MARKET, BY COUNTRY, 2022-2032 ($MILLION)
TABLE 37. CHINA TEMPERATURE SENSOR MARKET, BY TYPE, 2022-2032 ($MILLION)
TABLE 38. CHINA TEMPERATURE SENSOR MARKET, BY INDUSTRY VERTICAL, 2022-2032 ($MILLION)
TABLE 39. JAPAN TEMPERATURE SENSOR MARKET, BY TYPE, 2022-2032 ($MILLION)
TABLE 40. JAPAN TEMPERATURE SENSOR MARKET, BY INDUSTRY VERTICAL, 2022-2032 ($MILLION)
TABLE 41. INDIA TEMPERATURE SENSOR MARKET, BY TYPE, 2022-2032 ($MILLION)
TABLE 42. INDIA TEMPERATURE SENSOR MARKET, BY INDUSTRY VERTICAL, 2022-2032 ($MILLION)
TABLE 43. SOUTH KOREA TEMPERATURE SENSOR MARKET, BY TYPE, 2022-2032 ($MILLION)
TABLE 44. SOUTH KOREA TEMPERATURE SENSOR MARKET, BY INDUSTRY VERTICAL, 2022-2032 ($MILLION)
TABLE 45. REST OF ASIA-PACIFIC TEMPERATURE SENSOR MARKET, BY TYPE, 2022-2032 ($MILLION)
TABLE 46. REST OF ASIA-PACIFIC TEMPERATURE SENSOR MARKET, BY INDUSTRY VERTICAL, 2022-2032 ($MILLION)
TABLE 47. LAMEA TEMPERATURE SENSOR MARKET, BY TYPE, 2022-2032 ($MILLION)
TABLE 48. LAMEA TEMPERATURE SENSOR MARKET, BY INDUSTRY VERTICAL, 2022-2032 ($MILLION)
TABLE 49. LAMEA TEMPERATURE SENSOR MARKET, BY COUNTRY, 2022-2032 ($MILLION)
TABLE 50. LATIN AMERICA TEMPERATURE SENSOR MARKET, BY TYPE, 2022-2032 ($MILLION)
TABLE 51. LATIN AMERICA TEMPERATURE SENSOR MARKET, BY INDUSTRY VERTICAL, 2022-2032 ($MILLION)
TABLE 52. MIDDLE EAST TEMPERATURE SENSOR MARKET, BY TYPE, 2022-2032 ($MILLION)
TABLE 53. MIDDLE EAST TEMPERATURE SENSOR MARKET, BY INDUSTRY VERTICAL, 2022-2032 ($MILLION)
TABLE 54. AFRICA TEMPERATURE SENSOR MARKET, BY TYPE, 2022-2032 ($MILLION)
TABLE 55. AFRICA TEMPERATURE SENSOR MARKET, BY INDUSTRY VERTICAL, 2022-2032 ($MILLION)
TABLE 56. HONEYWELL INTERNATIONAL INC.: KEY EXECUTIVES
TABLE 57. HONEYWELL INTERNATIONAL INC.: COMPANY SNAPSHOT
TABLE 58. HONEYWELL INTERNATIONAL INC.: PRODUCT SEGMENTS
TABLE 59. HONEYWELL INTERNATIONAL INC.: PRODUCT PORTFOLIO
TABLE 60. HONEYWELL INTERNATIONAL INC.: KEY STRATERGIES
TABLE 61. TE CONNECTIVITY LTD.: KEY EXECUTIVES
TABLE 62. TE CONNECTIVITY LTD.: COMPANY SNAPSHOT
TABLE 63. TE CONNECTIVITY LTD.: SERVICE SEGMENTS
TABLE 64. TE CONNECTIVITY LTD.: PRODUCT PORTFOLIO
TABLE 65. TE CONNECTIVITY LTD.: KEY STRATERGIES
TABLE 66. TEXAS INSTRUMENTS INC.: KEY EXECUTIVES
TABLE 67. TEXAS INSTRUMENTS INC.: COMPANY SNAPSHOT
TABLE 68. TEXAS INSTRUMENTS INC.: SERVICE SEGMENTS
TABLE 69. TEXAS INSTRUMENTS INC.: PRODUCT PORTFOLIO
TABLE 70. TEXAS INSTRUMENTS INC.: KEY STRATERGIES
TABLE 71. ENDRESSHAUSER GROUP SERVICES AG: KEY EXECUTIVES
TABLE 72. ENDRESSHAUSER GROUP SERVICES AG: COMPANY SNAPSHOT
TABLE 73. ENDRESSHAUSER GROUP SERVICES AG: SERVICE SEGMENTS
TABLE 74. ENDRESSHAUSER GROUP SERVICES AG: PRODUCT PORTFOLIO
TABLE 75. ENDRESSHAUSER GROUP SERVICES AG: KEY STRATERGIES
TABLE 76. SIEMENS AG: KEY EXECUTIVES
TABLE 77. SIEMENS AG: COMPANY SNAPSHOT
TABLE 78. SIEMENS AG: SERVICE SEGMENTS
TABLE 79. SIEMENS AG: PRODUCT PORTFOLIO
TABLE 80. SIEMENS AG: KEY STRATERGIES
TABLE 81. ANALOG DEVICES, INC: KEY EXECUTIVES
TABLE 82. ANALOG DEVICES, INC: COMPANY SNAPSHOT
TABLE 83. ANALOG DEVICES, INC: SERVICE SEGMENTS
TABLE 84. ANALOG DEVICES, INC: PRODUCT PORTFOLIO
TABLE 85. EMERSON: KEY EXECUTIVES
TABLE 86. EMERSON: COMPANY SNAPSHOT
TABLE 87. EMERSON: SERVICE SEGMENTS
TABLE 88. EMERSON: PRODUCT PORTFOLIO
TABLE 89. AMPHENOL ADVANCED SENSORS: KEY EXECUTIVES
TABLE 90. AMPHENOL ADVANCED SENSORS: COMPANY SNAPSHOT
TABLE 91. AMPHENOL ADVANCED SENSORS: SERVICE SEGMENTS
TABLE 92. AMPHENOL ADVANCED SENSORS: PRODUCT PORTFOLIO
TABLE 93. WIKA INSTRUMENTS INDIA PVT. LTD.: KEY EXECUTIVES
TABLE 94. WIKA INSTRUMENTS INDIA PVT. LTD.: COMPANY SNAPSHOT
TABLE 95. WIKA INSTRUMENTS INDIA PVT. LTD.: PRODUCT SEGMENTS
TABLE 96. WIKA INSTRUMENTS INDIA PVT. LTD.: PRODUCT PORTFOLIO
TABLE 97. WIKA INSTRUMENTS INDIA PVT. LTD.: KEY STRATERGIES
TABLE 98. STMICROELECTRONICS: KEY EXECUTIVES
TABLE 99. STMICROELECTRONICS: COMPANY SNAPSHOT
TABLE 100. STMICROELECTRONICS: SERVICE SEGMENTS
TABLE 101. STMICROELECTRONICS: PRODUCT PORTFOLIO
TABLE 102. STMICROELECTRONICS: KEY STRATERGIES LIST OF FIGURES
FIGURE 01. TEMPERATURE SENSOR MARKET, 2022-2032
FIGURE 02. SEGMENTATION OF TEMPERATURE SENSOR MARKET, 2022-2032
FIGURE 03. TOP INVESTMENT POCKETS IN TEMPERATURE SENSOR MARKET (2023-2032)
FIGURE 04. HIGH BARGAINING POWER OF SUPPLIERS
FIGURE 05. HIGH BARGAINING POWER OF BUYERS
FIGURE 06. MODERATE TO HIGH THREAT OF SUBSTITUTES
FIGURE 07. MODERATE THREAT OF NEW ENTRANTS
FIGURE 08. MODERATE INTENSITY OF RIVALRY
FIGURE 09. DRIVERS, RESTRAINTS AND OPPORTUNITIES: GLOBALTEMPERATURE SENSOR MARKET
FIGURE 10. TEMPERATURE SENSOR MARKET, BY TYPE, 2022(%)
FIGURE 11. COMPARATIVE SHARE ANALYSIS OF TEMPERATURE SENSOR MARKET FOR THERMOCOUPLE, BY COUNTRY 2022 AND 2032(%)
FIGURE 12. COMPARATIVE SHARE ANALYSIS OF TEMPERATURE SENSOR MARKET FOR THERMISTOR, BY COUNTRY 2022 AND 2032(%)
FIGURE 13. COMPARATIVE SHARE ANALYSIS OF TEMPERATURE SENSOR MARKET FOR RESISTANCE TEMPERATURE DETECTOR (RTD), BY COUNTRY 2022 AND 2032(%)
FIGURE 14. COMPARATIVE SHARE ANALYSIS OF TEMPERATURE SENSOR MARKET FOR INFRARED TEMPERATURE SENSOR, BY COUNTRY 2022 AND 2032(%)
FIGURE 15. COMPARATIVE SHARE ANALYSIS OF TEMPERATURE SENSOR MARKET FOR OTHERS, BY COUNTRY 2022 AND 2032(%)
FIGURE 16. TEMPERATURE SENSOR MARKET, BY INDUSTRY VERTICAL, 2022(%)
FIGURE 17. COMPARATIVE SHARE ANALYSIS OF TEMPERATURE SENSOR MARKET FOR MANUFACTURING, BY COUNTRY 2022 AND 2032(%)
FIGURE 18. COMPARATIVE SHARE ANALYSIS OF TEMPERATURE SENSOR MARKET FOR CHEMICAL, BY COUNTRY 2022 AND 2032(%)
FIGURE 19. COMPARATIVE SHARE ANALYSIS OF TEMPERATURE SENSOR MARKET FOR HEALTHCARE AND PHARMACEUTICAL, BY COUNTRY 2022 AND 2032(%)
FIGURE 20. COMPARATIVE SHARE ANALYSIS OF TEMPERATURE SENSOR MARKET FOR AUTOMOTIVE, BY COUNTRY 2022 AND 2032(%)
FIGURE 21. COMPARATIVE SHARE ANALYSIS OF TEMPERATURE SENSOR MARKET FOR OIL AND GAS, BY COUNTRY 2022 AND 2032(%)
FIGURE 22. TEMPERATURE SENSOR MARKET BY REGION, 2022
FIGURE 23. U.S. TEMPERATURE SENSOR MARKET, 2022-2032 ($MILLION)
FIGURE 24. CANADA TEMPERATURE SENSOR MARKET, 2022-2032 ($MILLION)
FIGURE 25. MEXICO TEMPERATURE SENSOR MARKET, 2022-2032 ($MILLION)
FIGURE 26. UK TEMPERATURE SENSOR MARKET, 2022-2032 ($MILLION)
FIGURE 27. GERMANY TEMPERATURE SENSOR MARKET, 2022-2032 ($MILLION)
FIGURE 28. FRANCE TEMPERATURE SENSOR MARKET, 2022-2032 ($MILLION)
FIGURE 29. REST OF EUROPE TEMPERATURE SENSOR MARKET, 2022-2032 ($MILLION)
FIGURE 30. CHINA TEMPERATURE SENSOR MARKET, 2022-2032 ($MILLION)
FIGURE 31. JAPAN TEMPERATURE SENSOR MARKET, 2022-2032 ($MILLION)
FIGURE 32. INDIA TEMPERATURE SENSOR MARKET, 2022-2032 ($MILLION)
FIGURE 33. SOUTH KOREA TEMPERATURE SENSOR MARKET, 2022-2032 ($MILLION)
FIGURE 34. REST OF ASIA-PACIFIC TEMPERATURE SENSOR MARKET, 2022-2032 ($MILLION)
FIGURE 35. LATIN AMERICA TEMPERATURE SENSOR MARKET, 2022-2032 ($MILLION)
FIGURE 36. MIDDLE EAST TEMPERATURE SENSOR MARKET, 2022-2032 ($MILLION)
FIGURE 37. AFRICA TEMPERATURE SENSOR MARKET, 2022-2032 ($MILLION)
FIGURE 38. TOP WINNING STRATEGIES, BY YEAR
FIGURE 39. TOP WINNING STRATEGIES, BY DEVELOPMENT
FIGURE 40. TOP WINNING STRATEGIES, BY COMPANY
FIGURE 41. PRODUCT MAPPING OF TOP 10 PLAYERS
FIGURE 42. COMPETITIVE DASHBOARD
FIGURE 43. COMPETITIVE HEATMAP: TEMPERATURE SENSOR MARKET
FIGURE 44. TOP PLAYER POSITIONING, 2022
FIGURE 45. HONEYWELL INTERNATIONAL INC.: RESEARCH & DEVELOPMENT EXPENDITURE, 2019-2021 ($MILLION)
FIGURE 46. HONEYWELL INTERNATIONAL INC.: NET SALES, 2019-2021 ($MILLION)
FIGURE 47. HONEYWELL INTERNATIONAL INC.: REVENUE SHARE BY SEGMENT, 2021 (%)
FIGURE 48. HONEYWELL INTERNATIONAL INC.: REVENUE SHARE BY REGION, 2021 (%)
FIGURE 49. TE CONNECTIVITY LTD.: NET REVENUE, 2019-2021 ($MILLION)
FIGURE 50. TE CONNECTIVITY LTD.: RESEARCH & DEVELOPMENT EXPENDITURE, 2019-2021
FIGURE 51. TE CONNECTIVITY LTD.: REVENUE SHARE BY SEGMENT, 2021 (%)
FIGURE 52. TE CONNECTIVITY LTD.: REVENUE SHARE BY REGION, 2021 (%)
FIGURE 53. TEXAS INSTRUMENTS INC.: NET REVENUE, 2019-2021 ($MILLION)
FIGURE 54. TEXAS INSTRUMENTS INC.: RESEARCH & DEVELOPMENT EXPENDITURE, 2019-2021
FIGURE 55. TEXAS INSTRUMENTS INC.: REVENUE SHARE BY SEGMENT, 2021 (%)
FIGURE 56. TEXAS INSTRUMENTS INC.: REVENUE SHARE BY REGION, 2021 (%)
FIGURE 57. ENDRESSHAUSER GROUP SERVICES AG: NET SALES, 2020-2022 ($MILLION)
FIGURE 58. ENDRESSHAUSER GROUP SERVICES AG: REVENUE SHARE BY SEGMENT, 2022 (%)
FIGURE 59. ENDRESSHAUSER GROUP SERVICES AG: REVENUE SHARE BY REGION, 2022 (%)
FIGURE 60. SIEMENS AG: NET REVENUE, 2019-2021 ($MILLION)
FIGURE 61. SIEMENS AG: RESEARCH & DEVELOPMENT EXPENDITURE, 2019-2021
FIGURE 62. SIEMENS AG: REVENUE SHARE BY SEGMENT, 2021 (%)
FIGURE 63. SIEMENS AG: REVENUE SHARE BY REGION, 2021 (%)
FIGURE 64. ANALOG DEVICES, INC: NET REVENUE, 2020-2022 ($MILLION)
FIGURE 65. ANALOG DEVICES, INC: RESEARCH & DEVELOPMENT EXPENDITURE, 2020-2022 ($MILLION)
FIGURE 66. ANALOG DEVICES, INC: REVENUE SHARE BY SEGMENT, 2022 (%)
FIGURE 67. ANALOG DEVICES, INC: REVENUE SHARE BY REGION, 2022 (%)
FIGURE 68. EMERSON: NET SALES, 2020-2022 ($MILLION)
FIGURE 69. EMERSON: REVENUE SHARE BY SEGMENT, 2022 (%)
FIGURE 70. EMERSON: REVENUE SHARE BY REGION, 2021 (%)
FIGURE 71. STMICROELECTRONICS: RESEARCH & DEVELOPMENT EXPENDITURE, 2019-2021
FIGURE 72. STMICROELECTRONICS: NET REVENUE, 2019-2021 ($MILLION)
FIGURE 73. STMICROELECTRONICS: REVENUE SHARE BY SEGMENT, 2021 (%)
FIGURE 74. STMICROELECTRONICS: REVENUE SHARE BY REGION, 2021 (%
SELECT A FORMAT
Added to Cart
Electronic (PDF)

$5820

This license allows only one user to access the PDF.
Electronic (PDF)

$6450

This license allows 1 - 5 user to access the PDF, license is suitable for small groups of 5 users working together
Electronic (PDF)

$9600

This license allows users/teams in a same Enterprise to use this report, various departments within an enterpise can use this report
Electronic (PDF)

$3840

This license just provides quantitative data in a excel sheet
Add to Cart
Buy Now (15% Discount)

OUR CUSTOMER

Samsung SD