
Glamping Market Research 2031
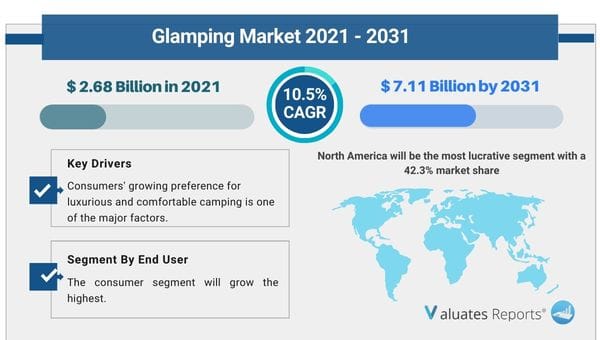
The global Glamping Market Size was valued at $2.68 billion in 2021 and is projected to reach $7.11 billion by 2031, growing at a CAGR of 10.5% from 2022 to 2031. Key drivers of the glamping market include the increasing inclination of consumers towards luxury and comfortable camping.
The rise in music concerts and festivals along with the growing interest of consumers in being close to nature will fuel the growth of the glamping market during the forecast period.
The emergence of retreat tourism, rising income levels, and increasing focus on self-care will drive the growth of the market in the coming years.
Trends Influencing the Global Glamping Market
Luxury and comfort camping
The hospitality industry is going through a transformative phase as more and more travelers are combining the camping experience with luxury lodging services and all other amenities. The growing number of experiential travelers and people especially millennials are open to newer experiences, The rising income levels have encouraged consumers to spend more on having an immersive experience. Travel habits have changed drastically as people are shelling out big bucks to spend time closer to nature. This will foster the growth of the glamping market in the coming years. People are shifting away from material possessions to getting the feeling of awe and inspiration. They are actively seeking out adventurous, local, and emotionally evocative situations. This has led to the entry of several hotels, resorts, and brands introducing their glamping options. Ethical consciousness and a value-driven approach are key to grabbing the attention of consumers.
Benefits of glamping
Glamping offers a variety of new experiences to consumers. The rise in music concerts and festivals has spread the concept. It lets travelers experience clean air, as the camping sites are usually present in lush green environments surrounded by trees and plants. The urge to gain offbeat experiences and escape the busy hustle and bustle of city life is fueling the industry which in turn will drive the growth prospects of the glamping market. The chance to avoid the modern chaos of city life and just be in the lap of nature is an exhilarating feeling. Everyone from families and corporate employees is undertaking these trips.
Covid 19 impact
Yoga, wellness retreats, and holistic well-being are much in demand due to the stressful consequences of the covid19 pandemic. People have realized the importance of self-care as the wellness tourism industry is expanding rapidly. Outdoor trekking, meditation, yoga, daily stretching, and enjoying nature’s wonderful serenity are helping boost mood, reduce stress levels, and improve overall health. This will drive the growth of the glamping market during the forecast period. The beautiful surroundings and picture-perfect countryside aids in overall physical and mental development.
Glamping Market Share Analysis
Based on application, the family travel segment is expected to dominate in the glamping market share due to the rising emphasis on the need for creating family memories and maintaining relationships. The trend of going out with family is increasing.
Based on the age group, the 18-32 segment will be the most lucrative due to the preference for adventure and travel. While the 33-50 segment will grow the fastest owing to the need for a comfortable and luxurious outdoor experience.
Based on the size, the 4-person segment will witness considerable growth in the glamping market share due to the growing popularity of group travel.
Based on end-user, the consumer segment will grow the highest due to the preference for seeking outdoor activities and the need to be close to nature. The shift from traditional camping to glamping is also contributing to the growth.
Based on the distribution channel, the specialty stores segment will grow the most lucrative during the forecast period due to offering discounts and the need for a personal buying experience.
Based on product type, the camping pods and cabin segment will grow the highest due to the rising need for safety, lockable doors, windows, and availability of amenities.
Based on region, North America will be the most lucrative segment with a 42.3% market share due to the need for luxurious and adventurous traveling, the increasing influence of social media influencers, and the demand for nature traveling.
Key Benefits For Stakeholders
Glamping Market Scope
|
Report Metric |
Details |
|
Report Name |
Glamping Market |
|
The Market size value in 2021 |
2.68 Billion USD |
|
The Revenue forecast in 2031 |
7.11 Billion USD |
|
Growth Rate |
CAGR of 10.5% from 2021 to 2030 |
|
Base year considered |
2021 |
|
Forecast period |
2021- 2030 |
|
Forecast units |
Value (USD) |
|
Segments covered |
By Application, By Age Group, By Size, By End User, By Distribution Channel, By Product Type |
|
Report coverage |
Revenue & volume forecast, company share, competitive landscape, growth factors, and trends |
|
Geographic regions covered |
North America, Europe, Asia Pacific, Latin America, Middle East & Africa |
|
Companies covered |
Kampa, exxel outdoors, Bushtec Safari, Sawday’s Canopy and Stars Ltd., Huttopia, Wigwam Holidays Ltd, ArenaCampsites, Others. |
Ans. The global Glamping Market Size was valued at USD 2.68 Billion in 2021 and is projected to reach USD 7.11 Billion by 2031.
Ans. The global Glamping Market Size is expected to grow at a compound annual growth rate of 10.5% from 2021 to 2031.
Ans. The key players are Kampa, exxel outdoors, Bushtec Safari, Sawday’s Canopy and Stars Ltd., Huttopia, Wigwam Holidays Ltd, ArenaCampsites, Others.
CHAPTER 1:INTRODUCTION
1.1.Report description
1.2.Key market segments
1.3.Key benefits to the stakeholders
1.4.Research Methodology
1.4.1.Secondary research
1.4.2.Primary research
1.4.3.Analyst tools and models
CHAPTER 2:EXECUTIVE SUMMARY
2.1.Key findings of the study
2.2.CXO Perspective
CHAPTER 3:MARKET OVERVIEW
3.1.Market definition and scope
3.2.Key findings
3.2.1.Top investment pockets
3.3.Porter’s five forces analysis
3.4.Top player positioning
3.5.Market dynamics
3.5.1.Drivers
3.5.2.Restraints
3.5.3.Opportunities
3.6.COVID-19 Impact Analysis on the market
CHAPTER 4: GLAMPING MARKET, BY PRODUCT TYPE
4.1 Overview
4.1.1 Market size and forecast
4.2 Camping Pods and Cabins
4.2.1 Key market trends, growth factors and opportunities
4.2.2 Market size and forecast, by region
4.2.3 Market analysis by country
4.3 Yurts
4.3.1 Key market trends, growth factors and opportunities
4.3.2 Market size and forecast, by region
4.3.3 Market analysis by country
4.4 Tents
4.4.1 Key market trends, growth factors and opportunities
4.4.2 Market size and forecast, by region
4.4.3 Market analysis by country
4.5 Treehouses
4.5.1 Key market trends, growth factors and opportunities
4.5.2 Market size and forecast, by region
4.5.3 Market analysis by country
4.6 Others
4.6.1 Key market trends, growth factors and opportunities
4.6.2 Market size and forecast, by region
4.6.3 Market analysis by country
CHAPTER 5: GLAMPING MARKET, BY APPLICATION
5.1 Overview
5.1.1 Market size and forecast
5.2 Family Travel
5.2.1 Key market trends, growth factors and opportunities
5.2.2 Market size and forecast, by region
5.2.3 Market analysis by country
5.3 Enterprise Travel
5.3.1 Key market trends, growth factors and opportunities
5.3.2 Market size and forecast, by region
5.3.3 Market analysis by country
CHAPTER 6: GLAMPING MARKET, BY AGE GROUP
6.1 Overview
6.1.1 Market size and forecast
6.2 18-32 years
6.2.1 Key market trends, growth factors and opportunities
6.2.2 Market size and forecast, by region
6.2.3 Market analysis by country
6.3 33-50 years
6.3.1 Key market trends, growth factors and opportunities
6.3.2 Market size and forecast, by region
6.3.3 Market analysis by country
6.4 51-65 years
6.4.1 Key market trends, growth factors and opportunities
6.4.2 Market size and forecast, by region
6.4.3 Market analysis by country
6.5 Above 65 years
6.5.1 Key market trends, growth factors and opportunities
6.5.2 Market size and forecast, by region
6.5.3 Market analysis by country
CHAPTER 7: GLAMPING MARKET, BY SIZE
7.1 Overview
7.1.1 Market size and forecast
7.2 2-Person
7.2.1 Key market trends, growth factors and opportunities
7.2.2 Market size and forecast, by region
7.2.3 Market analysis by country
7.3 4-Person
7.3.1 Key market trends, growth factors and opportunities
7.3.2 Market size and forecast, by region
7.3.3 Market analysis by country
7.4 Others
7.4.1 Key market trends, growth factors and opportunities
7.4.2 Market size and forecast, by region
7.4.3 Market analysis by country
CHAPTER 8: GLAMPING MARKET, BY END USER
8.1 Overview
8.1.1 Market size and forecast
8.2 Consumers
8.2.1 Key market trends, growth factors and opportunities
8.2.2 Market size and forecast, by region
8.2.3 Market analysis by country
8.3 Events
8.3.1 Key market trends, growth factors and opportunities
8.3.2 Market size and forecast, by region
8.3.3 Market analysis by country
CHAPTER 9: GLAMPING MARKET, BY DISTRIBUTION CHANNEL
9.1 Overview
9.1.1 Market size and forecast
9.2 Supermarkets and Hypermarkets
9.2.1 Key market trends, growth factors and opportunities
9.2.2 Market size and forecast, by region
9.2.3 Market analysis by country
9.3 Specialty Stores
9.3.1 Key market trends, growth factors and opportunities
9.3.2 Market size and forecast, by region
9.3.3 Market analysis by country
9.4 E-commerce
9.4.1 Key market trends, growth factors and opportunities
9.4.2 Market size and forecast, by region
9.4.3 Market analysis by country
9.5 Others
9.5.1 Key market trends, growth factors and opportunities
9.5.2 Market size and forecast, by region
9.5.3 Market analysis by country
CHAPTER 10: GLAMPING MARKET, BY REGION
10.1 Overview
10.1.1 Market size and forecast
10.2 North America
10.2.1 Key trends and opportunities
10.2.2 North America Market size and forecast, by Product Type
10.2.3 North America Market size and forecast, by Application
10.2.4 North America Market size and forecast, by Age Group
10.2.5 North America Market size and forecast, by Size
10.2.6 North America Market size and forecast, by End User
10.2.7 North America Market size and forecast, by Distribution Channel
10.2.8 North America Market size and forecast, by country
10.2.8.1 U.S.
10.2.8.1.1 Market size and forecast, by Product Type
10.2.8.1.2 Market size and forecast, by Application
10.2.8.1.3 Market size and forecast, by Age Group
10.2.8.1.4 Market size and forecast, by Size
10.2.8.1.5 Market size and forecast, by End User
10.2.8.1.6 Market size and forecast, by Distribution Channel
10.2.8.2 Canada
10.2.8.2.1 Market size and forecast, by Product Type
10.2.8.2.2 Market size and forecast, by Application
10.2.8.2.3 Market size and forecast, by Age Group
10.2.8.2.4 Market size and forecast, by Size
10.2.8.2.5 Market size and forecast, by End User
10.2.8.2.6 Market size and forecast, by Distribution Channel
10.2.8.3 Mexico
10.2.8.3.1 Market size and forecast, by Product Type
10.2.8.3.2 Market size and forecast, by Application
10.2.8.3.3 Market size and forecast, by Age Group
10.2.8.3.4 Market size and forecast, by Size
10.2.8.3.5 Market size and forecast, by End User
10.2.8.3.6 Market size and forecast, by Distribution Channel
10.3 Europe
10.3.1 Key trends and opportunities
10.3.2 Europe Market size and forecast, by Product Type
10.3.3 Europe Market size and forecast, by Application
10.3.4 Europe Market size and forecast, by Age Group
10.3.5 Europe Market size and forecast, by Size
10.3.6 Europe Market size and forecast, by End User
10.3.7 Europe Market size and forecast, by Distribution Channel
10.3.8 Europe Market size and forecast, by country
10.3.8.1 U.K.
10.3.8.1.1 Market size and forecast, by Product Type
10.3.8.1.2 Market size and forecast, by Application
10.3.8.1.3 Market size and forecast, by Age Group
10.3.8.1.4 Market size and forecast, by Size
10.3.8.1.5 Market size and forecast, by End User
10.3.8.1.6 Market size and forecast, by Distribution Channel
10.3.8.2 Italy
10.3.8.2.1 Market size and forecast, by Product Type
10.3.8.2.2 Market size and forecast, by Application
10.3.8.2.3 Market size and forecast, by Age Group
10.3.8.2.4 Market size and forecast, by Size
10.3.8.2.5 Market size and forecast, by End User
10.3.8.2.6 Market size and forecast, by Distribution Channel
10.3.8.3 Germany
10.3.8.3.1 Market size and forecast, by Product Type
10.3.8.3.2 Market size and forecast, by Application
10.3.8.3.3 Market size and forecast, by Age Group
10.3.8.3.4 Market size and forecast, by Size
10.3.8.3.5 Market size and forecast, by End User
10.3.8.3.6 Market size and forecast, by Distribution Channel
10.3.8.4 France
10.3.8.4.1 Market size and forecast, by Product Type
10.3.8.4.2 Market size and forecast, by Application
10.3.8.4.3 Market size and forecast, by Age Group
10.3.8.4.4 Market size and forecast, by Size
10.3.8.4.5 Market size and forecast, by End User
10.3.8.4.6 Market size and forecast, by Distribution Channel
10.3.8.5 Spain
10.3.8.5.1 Market size and forecast, by Product Type
10.3.8.5.2 Market size and forecast, by Application
10.3.8.5.3 Market size and forecast, by Age Group
10.3.8.5.4 Market size and forecast, by Size
10.3.8.5.5 Market size and forecast, by End User
10.3.8.5.6 Market size and forecast, by Distribution Channel
10.3.8.6 The Netherlands
10.3.8.6.1 Market size and forecast, by Product Type
10.3.8.6.2 Market size and forecast, by Application
10.3.8.6.3 Market size and forecast, by Age Group
10.3.8.6.4 Market size and forecast, by Size
10.3.8.6.5 Market size and forecast, by End User
10.3.8.6.6 Market size and forecast, by Distribution Channel
10.3.8.7 Switzerland
10.3.8.7.1 Market size and forecast, by Product Type
10.3.8.7.2 Market size and forecast, by Application
10.3.8.7.3 Market size and forecast, by Age Group
10.3.8.7.4 Market size and forecast, by Size
10.3.8.7.5 Market size and forecast, by End User
10.3.8.7.6 Market size and forecast, by Distribution Channel
10.3.8.8 Rest of Europe
10.3.8.8.1 Market size and forecast, by Product Type
10.3.8.8.2 Market size and forecast, by Application
10.3.8.8.3 Market size and forecast, by Age Group
10.3.8.8.4 Market size and forecast, by Size
10.3.8.8.5 Market size and forecast, by End User
10.3.8.8.6 Market size and forecast, by Distribution Channel
10.4 Asia-Pacific
10.4.1 Key trends and opportunities
10.4.2 Asia-Pacific Market size and forecast, by Product Type
10.4.3 Asia-Pacific Market size and forecast, by Application
10.4.4 Asia-Pacific Market size and forecast, by Age Group
10.4.5 Asia-Pacific Market size and forecast, by Size
10.4.6 Asia-Pacific Market size and forecast, by End User
10.4.7 Asia-Pacific Market size and forecast, by Distribution Channel
10.4.8 Asia-Pacific Market size and forecast, by country
10.4.8.1 China
10.4.8.1.1 Market size and forecast, by Product Type
10.4.8.1.2 Market size and forecast, by Application
10.4.8.1.3 Market size and forecast, by Age Group
10.4.8.1.4 Market size and forecast, by Size
10.4.8.1.5 Market size and forecast, by End User
10.4.8.1.6 Market size and forecast, by Distribution Channel
10.4.8.2 Japan
10.4.8.2.1 Market size and forecast, by Product Type
10.4.8.2.2 Market size and forecast, by Application
10.4.8.2.3 Market size and forecast, by Age Group
10.4.8.2.4 Market size and forecast, by Size
10.4.8.2.5 Market size and forecast, by End User
10.4.8.2.6 Market size and forecast, by Distribution Channel
10.4.8.3 India
10.4.8.3.1 Market size and forecast, by Product Type
10.4.8.3.2 Market size and forecast, by Application
10.4.8.3.3 Market size and forecast, by Age Group
10.4.8.3.4 Market size and forecast, by Size
10.4.8.3.5 Market size and forecast, by End User
10.4.8.3.6 Market size and forecast, by Distribution Channel
10.4.8.4 South Korea
10.4.8.4.1 Market size and forecast, by Product Type
10.4.8.4.2 Market size and forecast, by Application
10.4.8.4.3 Market size and forecast, by Age Group
10.4.8.4.4 Market size and forecast, by Size
10.4.8.4.5 Market size and forecast, by End User
10.4.8.4.6 Market size and forecast, by Distribution Channel
10.4.8.5 Australia
10.4.8.5.1 Market size and forecast, by Product Type
10.4.8.5.2 Market size and forecast, by Application
10.4.8.5.3 Market size and forecast, by Age Group
10.4.8.5.4 Market size and forecast, by Size
10.4.8.5.5 Market size and forecast, by End User
10.4.8.5.6 Market size and forecast, by Distribution Channel
10.4.8.6 Indonesia
10.4.8.6.1 Market size and forecast, by Product Type
10.4.8.6.2 Market size and forecast, by Application
10.4.8.6.3 Market size and forecast, by Age Group
10.4.8.6.4 Market size and forecast, by Size
10.4.8.6.5 Market size and forecast, by End User
10.4.8.6.6 Market size and forecast, by Distribution Channel
10.4.8.7 Thailand
10.4.8.7.1 Market size and forecast, by Product Type
10.4.8.7.2 Market size and forecast, by Application
10.4.8.7.3 Market size and forecast, by Age Group
10.4.8.7.4 Market size and forecast, by Size
10.4.8.7.5 Market size and forecast, by End User
10.4.8.7.6 Market size and forecast, by Distribution Channel
10.4.8.8 Rest of Asia-Pacific
10.4.8.8.1 Market size and forecast, by Product Type
10.4.8.8.2 Market size and forecast, by Application
10.4.8.8.3 Market size and forecast, by Age Group
10.4.8.8.4 Market size and forecast, by Size
10.4.8.8.5 Market size and forecast, by End User
10.4.8.8.6 Market size and forecast, by Distribution Channel
10.5 LAMEA
10.5.1 Key trends and opportunities
10.5.2 LAMEA Market size and forecast, by Product Type
10.5.3 LAMEA Market size and forecast, by Application
10.5.4 LAMEA Market size and forecast, by Age Group
10.5.5 LAMEA Market size and forecast, by Size
10.5.6 LAMEA Market size and forecast, by End User
10.5.7 LAMEA Market size and forecast, by Distribution Channel
10.5.8 LAMEA Market size and forecast, by country
10.5.8.1 Latin America
10.5.8.1.1 Market size and forecast, by Product Type
10.5.8.1.2 Market size and forecast, by Application
10.5.8.1.3 Market size and forecast, by Age Group
10.5.8.1.4 Market size and forecast, by Size
10.5.8.1.5 Market size and forecast, by End User
10.5.8.1.6 Market size and forecast, by Distribution Channel
10.5.8.2 Middle East
10.5.8.2.1 Market size and forecast, by Product Type
10.5.8.2.2 Market size and forecast, by Application
10.5.8.2.3 Market size and forecast, by Age Group
10.5.8.2.4 Market size and forecast, by Size
10.5.8.2.5 Market size and forecast, by End User
10.5.8.2.6 Market size and forecast, by Distribution Channel
10.5.8.3 Africa
10.5.8.3.1 Market size and forecast, by Product Type
10.5.8.3.2 Market size and forecast, by Application
10.5.8.3.3 Market size and forecast, by Age Group
10.5.8.3.4 Market size and forecast, by Size
10.5.8.3.5 Market size and forecast, by End User
10.5.8.3.6 Market size and forecast, by Distribution Channel
CHAPTER 11: COMPANY LANDSCAPE
11.1. Introduction
11.2. Top winning strategies
11.3. Product Mapping of Top 10 Player
11.4. Competitive Dashboard
11.5. Competitive Heatmap
11.6. Key developments
CHAPTER 12: COMPANY PROFILES
12.1 Hilleberg Ab
12.1.1 Company overview
12.1.2 Company snapshot
12.1.3 Operating business segments
12.1.4 Product portfolio
12.1.5 Business performance
12.1.6 Key strategic moves and developments
12.2 Johnson Outdoors Inc
12.2.1 Company overview
12.2.2 Company snapshot
12.2.3 Operating business segments
12.2.4 Product portfolio
12.2.5 Business performance
12.2.6 Key strategic moves and developments
12.3 The North Face Inc
12.3.1 Company overview
12.3.2 Company snapshot
12.3.3 Operating business segments
12.3.4 Product portfolio
12.3.5 Business performance
12.3.6 Key strategic moves and developments
12.4 AMG GROUP
12.4.1 Company overview
12.4.2 Company snapshot
12.4.3 Operating business segments
12.4.4 Product portfolio
12.4.5 Business performance
12.4.6 Key strategic moves and developments
12.5 Newell Brands Inc
12.5.1 Company overview
12.5.2 Company snapshot
12.5.3 Operating business segments
12.5.4 Product portfolio
12.5.5 Business performance
12.5.6 Key strategic moves and developments
12.6 Oase Outdoors
12.6.1 Company overview
12.6.2 Company snapshot
12.6.3 Operating business segments
12.6.4 Product portfolio
12.6.5 Business performance
12.6.6 Key strategic moves and developments
12.7 The Coleman Company
12.7.1 Company overview
12.7.2 Company snapshot
12.7.3 Operating business segments
12.7.4 Product portfolio
12.7.5 Business performance
12.7.6 Key strategic moves and developments
12.8 Simex Outdoor International
12.8.1 Company overview
12.8.2 Company snapshot
12.8.3 Operating business segments
12.8.4 Product portfolio
12.8.5 Business performance
12.8.6 Key strategic moves and developments
12.9 Kampa
12.9.1 Company overview
12.9.2 Company snapshot
12.9.3 Operating business segments
12.9.4 Product portfolio
12.9.5 Business performance
12.9.6 Key strategic moves and developments
12.10 exxel outdoors
12.10.1 Company overview
12.10.2 Company snapshot
12.10.3 Operating business segments
12.10.4 Product portfolio
12.10.5 Business performance
12.10.6 Key strategic moves and developments
12.11 Bushtec Safari
12.11.1 Company overview
12.11.2 Company snapshot
12.11.3 Operating business segments
12.11.4 Product portfolio
12.11.5 Business performance
12.11.6 Key strategic moves and developments
12.12 Sawday’s Canopy and Stars Ltd.
12.12.1 Company overview
12.12.2 Company snapshot
12.12.3 Operating business segments
12.12.4 Product portfolio
12.12.5 Business performance
12.12.6 Key strategic moves and developments
12.13 Huttopia
12.13.1 Company overview
12.13.2 Company snapshot
12.13.3 Operating business segments
12.13.4 Product portfolio
12.13.5 Business performance
12.13.6 Key strategic moves and developments
12.14 Wigwam Holidays Ltd
12.14.1 Company overview
12.14.2 Company snapshot
12.14.3 Operating business segments
12.14.4 Product portfolio
12.14.5 Business performance
12.14.6 Key strategic moves and developments
12.15 ArenaCampsites
12.15.1 Company overview
12.15.2 Company snapshot
12.15.3 Operating business segments
12.15.4 Product portfolio
12.15.5 Business performance
12.15.6 Key strategic moves and developments
LIST OF TABLES
TABLE 1. GLOBAL GLAMPING MARKET, BY PRODUCT TYPE, 2021-2031 ($MILLION)
TABLE 2. GLAMPING MARKET SIZE, FOR CAMPING PODS AND CABINS, BY REGION, 2021-2031 ($MILLION)
TABLE 3. GLAMPING MARKET FOR CAMPING PODS AND CABINS, BY COUNTRY, 2021-2031 ($MILLION)
TABLE 4. GLAMPING MARKET SIZE, FOR YURTS, BY REGION, 2021-2031 ($MILLION)
TABLE 5. GLAMPING MARKET FOR YURTS, BY COUNTRY, 2021-2031 ($MILLION)
TABLE 6. GLAMPING MARKET SIZE, FOR TENTS, BY REGION, 2021-2031 ($MILLION)
TABLE 7. GLAMPING MARKET FOR TENTS, BY COUNTRY, 2021-2031 ($MILLION)
TABLE 8. GLAMPING MARKET SIZE, FOR TREEHOUSES, BY REGION, 2021-2031 ($MILLION)
TABLE 9. GLAMPING MARKET FOR TREEHOUSES, BY COUNTRY, 2021-2031 ($MILLION)
TABLE 10. GLAMPING MARKET SIZE, FOR OTHERS, BY REGION, 2021-2031 ($MILLION)
TABLE 11. GLAMPING MARKET FOR OTHERS, BY COUNTRY, 2021-2031 ($MILLION)
TABLE 12. GLOBAL GLAMPING MARKET, BY APPLICATION, 2021-2031 ($MILLION)
TABLE 13. GLAMPING MARKET SIZE, FOR FAMILY TRAVEL, BY REGION, 2021-2031 ($MILLION)
TABLE 14. GLAMPING MARKET FOR FAMILY TRAVEL, BY COUNTRY, 2021-2031 ($MILLION)
TABLE 15. GLAMPING MARKET SIZE, FOR ENTERPRISE TRAVEL, BY REGION, 2021-2031 ($MILLION)
TABLE 16. GLAMPING MARKET FOR ENTERPRISE TRAVEL, BY COUNTRY, 2021-2031 ($MILLION)
TABLE 17. GLOBAL GLAMPING MARKET, BY AGE GROUP, 2021-2031 ($MILLION)
TABLE 18. GLAMPING MARKET SIZE, FOR 18-32 YEARS, BY REGION, 2021-2031 ($MILLION)
TABLE 19. GLAMPING MARKET FOR 18-32 YEARS, BY COUNTRY, 2021-2031 ($MILLION)
TABLE 20. GLAMPING MARKET SIZE, FOR 33-50 YEARS, BY REGION, 2021-2031 ($MILLION)
TABLE 21. GLAMPING MARKET FOR 33-50 YEARS, BY COUNTRY, 2021-2031 ($MILLION)
TABLE 22. GLAMPING MARKET SIZE, FOR 51-65 YEARS, BY REGION, 2021-2031 ($MILLION)
TABLE 23. GLAMPING MARKET FOR 51-65 YEARS, BY COUNTRY, 2021-2031 ($MILLION)
TABLE 24. GLAMPING MARKET SIZE, FOR ABOVE 65 YEARS, BY REGION, 2021-2031 ($MILLION)
TABLE 25. GLAMPING MARKET FOR ABOVE 65 YEARS, BY COUNTRY, 2021-2031 ($MILLION)
TABLE 26. GLOBAL GLAMPING MARKET, BY SIZE, 2021-2031 ($MILLION)
TABLE 27. GLAMPING MARKET SIZE, FOR 2-PERSON, BY REGION, 2021-2031 ($MILLION)
TABLE 28. GLAMPING MARKET FOR 2-PERSON, BY COUNTRY, 2021-2031 ($MILLION)
TABLE 29. GLAMPING MARKET SIZE, FOR 4-PERSON, BY REGION, 2021-2031 ($MILLION)
TABLE 30. GLAMPING MARKET FOR 4-PERSON, BY COUNTRY, 2021-2031 ($MILLION)
TABLE 31. GLAMPING MARKET SIZE, FOR OTHERS, BY REGION, 2021-2031 ($MILLION)
TABLE 32. GLAMPING MARKET FOR OTHERS, BY COUNTRY, 2021-2031 ($MILLION)
TABLE 33. GLOBAL GLAMPING MARKET, BY END USER, 2021-2031 ($MILLION)
TABLE 34. GLAMPING MARKET SIZE, FOR CONSUMERS, BY REGION, 2021-2031 ($MILLION)
TABLE 35. GLAMPING MARKET FOR CONSUMERS, BY COUNTRY, 2021-2031 ($MILLION)
TABLE 36. GLAMPING MARKET SIZE, FOR EVENTS, BY REGION, 2021-2031 ($MILLION)
TABLE 37. GLAMPING MARKET FOR EVENTS, BY COUNTRY, 2021-2031 ($MILLION)
TABLE 38. GLOBAL GLAMPING MARKET, BY DISTRIBUTION CHANNEL, 2021-2031 ($MILLION)
TABLE 39. GLAMPING MARKET SIZE, FOR SUPERMARKETS AND HYPERMARKETS, BY REGION, 2021-2031 ($MILLION)
TABLE 40. GLAMPING MARKET FOR SUPERMARKETS AND HYPERMARKETS, BY COUNTRY, 2021-2031 ($MILLION)
TABLE 41. GLAMPING MARKET SIZE, FOR SPECIALTY STORES, BY REGION, 2021-2031 ($MILLION)
TABLE 42. GLAMPING MARKET FOR SPECIALTY STORES, BY COUNTRY, 2021-2031 ($MILLION)
TABLE 43. GLAMPING MARKET SIZE, FOR E-COMMERCE, BY REGION, 2021-2031 ($MILLION)
TABLE 44. GLAMPING MARKET FOR E-COMMERCE, BY COUNTRY, 2021-2031 ($MILLION)
TABLE 45. GLAMPING MARKET SIZE, FOR OTHERS, BY REGION, 2021-2031 ($MILLION)
TABLE 46. GLAMPING MARKET FOR OTHERS, BY COUNTRY, 2021-2031 ($MILLION)
TABLE 47. GLAMPING MARKET, BY REGION, 2021-2031 ($MILLION)
TABLE 48. NORTH AMERICA GLAMPING MARKET, BY PRODUCT TYPE, 2021-2031 ($MILLION)
TABLE 49. NORTH AMERICA GLAMPING MARKET, BY APPLICATION, 2021-2031 ($MILLION)
TABLE 50. NORTH AMERICA GLAMPING MARKET, BY AGE GROUP, 2021-2031 ($MILLION)
TABLE 51. NORTH AMERICA GLAMPING MARKET, BY SIZE, 2021-2031 ($MILLION)
TABLE 52. NORTH AMERICA GLAMPING MARKET, BY END USER, 2021-2031 ($MILLION)
TABLE 53. NORTH AMERICA GLAMPING MARKET, BY DISTRIBUTION CHANNEL, 2021-2031 ($MILLION)
TABLE 54. NORTH AMERICA GLAMPING MARKET, BY COUNTRY, 2021-2031 ($MILLION)
TABLE 55. U.S. GLAMPING MARKET, BY PRODUCT TYPE, 2021-2031 ($MILLION)
TABLE 56. U.S. GLAMPING MARKET, BY APPLICATION, 2021-2031 ($MILLION)
TABLE 57. U.S. GLAMPING MARKET, BY AGE GROUP, 2021-2031 ($MILLION)
TABLE 58. U.S. GLAMPING MARKET, BY SIZE, 2021-2031 ($MILLION)
TABLE 59. U.S. GLAMPING MARKET, BY END USER, 2021-2031 ($MILLION)
TABLE 60. U.S. GLAMPING MARKET, BY DISTRIBUTION CHANNEL, 2021-2031 ($MILLION)
TABLE 61. CANADA GLAMPING MARKET, BY PRODUCT TYPE, 2021-2031 ($MILLION)
TABLE 62. CANADA GLAMPING MARKET, BY APPLICATION, 2021-2031 ($MILLION)
TABLE 63. CANADA GLAMPING MARKET, BY AGE GROUP, 2021-2031 ($MILLION)
TABLE 64. CANADA GLAMPING MARKET, BY SIZE, 2021-2031 ($MILLION)
TABLE 65. CANADA GLAMPING MARKET, BY END USER, 2021-2031 ($MILLION)
TABLE 66. CANADA GLAMPING MARKET, BY DISTRIBUTION CHANNEL, 2021-2031 ($MILLION)
TABLE 67. MEXICO GLAMPING MARKET, BY PRODUCT TYPE, 2021-2031 ($MILLION)
TABLE 68. MEXICO GLAMPING MARKET, BY APPLICATION, 2021-2031 ($MILLION)
TABLE 69. MEXICO GLAMPING MARKET, BY AGE GROUP, 2021-2031 ($MILLION)
TABLE 70. MEXICO GLAMPING MARKET, BY SIZE, 2021-2031 ($MILLION)
TABLE 71. MEXICO GLAMPING MARKET, BY END USER, 2021-2031 ($MILLION)
TABLE 72. MEXICO GLAMPING MARKET, BY DISTRIBUTION CHANNEL, 2021-2031 ($MILLION)
TABLE 73. EUROPE GLAMPING MARKET, BY PRODUCT TYPE, 2021-2031 ($MILLION)
TABLE 74. EUROPE GLAMPING MARKET, BY APPLICATION, 2021-2031 ($MILLION)
TABLE 75. EUROPE GLAMPING MARKET, BY AGE GROUP, 2021-2031 ($MILLION)
TABLE 76. EUROPE GLAMPING MARKET, BY SIZE, 2021-2031 ($MILLION)
TABLE 77. EUROPE GLAMPING MARKET, BY END USER, 2021-2031 ($MILLION)
TABLE 78. EUROPE GLAMPING MARKET, BY DISTRIBUTION CHANNEL, 2021-2031 ($MILLION)
TABLE 79. EUROPE GLAMPING MARKET, BY COUNTRY, 2021-2031 ($MILLION)
TABLE 80. U.K. GLAMPING MARKET, BY PRODUCT TYPE, 2021-2031 ($MILLION)
TABLE 81. U.K. GLAMPING MARKET, BY APPLICATION, 2021-2031 ($MILLION)
TABLE 82. U.K. GLAMPING MARKET, BY AGE GROUP, 2021-2031 ($MILLION)
TABLE 83. U.K. GLAMPING MARKET, BY SIZE, 2021-2031 ($MILLION)
TABLE 84. U.K. GLAMPING MARKET, BY END USER, 2021-2031 ($MILLION)
TABLE 85. U.K. GLAMPING MARKET, BY DISTRIBUTION CHANNEL, 2021-2031 ($MILLION)
TABLE 86. ITALY GLAMPING MARKET, BY PRODUCT TYPE, 2021-2031 ($MILLION)
TABLE 87. ITALY GLAMPING MARKET, BY APPLICATION, 2021-2031 ($MILLION)
TABLE 88. ITALY GLAMPING MARKET, BY AGE GROUP, 2021-2031 ($MILLION)
TABLE 89. ITALY GLAMPING MARKET, BY SIZE, 2021-2031 ($MILLION)
TABLE 90. ITALY GLAMPING MARKET, BY END USER, 2021-2031 ($MILLION)
TABLE 91. ITALY GLAMPING MARKET, BY DISTRIBUTION CHANNEL, 2021-2031 ($MILLION)
TABLE 92. GERMANY GLAMPING MARKET, BY PRODUCT TYPE, 2021-2031 ($MILLION)
TABLE 93. GERMANY GLAMPING MARKET, BY APPLICATION, 2021-2031 ($MILLION)
TABLE 94. GERMANY GLAMPING MARKET, BY AGE GROUP, 2021-2031 ($MILLION)
TABLE 95. GERMANY GLAMPING MARKET, BY SIZE, 2021-2031 ($MILLION)
TABLE 96. GERMANY GLAMPING MARKET, BY END USER, 2021-2031 ($MILLION)
TABLE 97. GERMANY GLAMPING MARKET, BY DISTRIBUTION CHANNEL, 2021-2031 ($MILLION)
TABLE 98. FRANCE GLAMPING MARKET, BY PRODUCT TYPE, 2021-2031 ($MILLION)
TABLE 99. FRANCE GLAMPING MARKET, BY APPLICATION, 2021-2031 ($MILLION)
TABLE 100. FRANCE GLAMPING MARKET, BY AGE GROUP, 2021-2031 ($MILLION)
TABLE 101. FRANCE GLAMPING MARKET, BY SIZE, 2021-2031 ($MILLION)
TABLE 102. FRANCE GLAMPING MARKET, BY END USER, 2021-2031 ($MILLION)
TABLE 103. FRANCE GLAMPING MARKET, BY DISTRIBUTION CHANNEL, 2021-2031 ($MILLION)
TABLE 104. SPAIN GLAMPING MARKET, BY PRODUCT TYPE, 2021-2031 ($MILLION)
TABLE 105. SPAIN GLAMPING MARKET, BY APPLICATION, 2021-2031 ($MILLION)
TABLE 106. SPAIN GLAMPING MARKET, BY AGE GROUP, 2021-2031 ($MILLION)
TABLE 107. SPAIN GLAMPING MARKET, BY SIZE, 2021-2031 ($MILLION)
TABLE 108. SPAIN GLAMPING MARKET, BY END USER, 2021-2031 ($MILLION)
TABLE 109. SPAIN GLAMPING MARKET, BY DISTRIBUTION CHANNEL, 2021-2031 ($MILLION)
TABLE 110. THE NETHERLANDS GLAMPING MARKET, BY PRODUCT TYPE, 2021-2031 ($MILLION)
TABLE 111. THE NETHERLANDS GLAMPING MARKET, BY APPLICATION, 2021-2031 ($MILLION)
TABLE 112. THE NETHERLANDS GLAMPING MARKET, BY AGE GROUP, 2021-2031 ($MILLION)
TABLE 113. THE NETHERLANDS GLAMPING MARKET, BY SIZE, 2021-2031 ($MILLION)
TABLE 114. THE NETHERLANDS GLAMPING MARKET, BY END USER, 2021-2031 ($MILLION)
TABLE 115. THE NETHERLANDS GLAMPING MARKET, BY DISTRIBUTION CHANNEL, 2021-2031 ($MILLION)
TABLE 116. SWITZERLAND GLAMPING MARKET, BY PRODUCT TYPE, 2021-2031 ($MILLION)
TABLE 117. SWITZERLAND GLAMPING MARKET, BY APPLICATION, 2021-2031 ($MILLION)
TABLE 118. SWITZERLAND GLAMPING MARKET, BY AGE GROUP, 2021-2031 ($MILLION)
TABLE 119. SWITZERLAND GLAMPING MARKET, BY SIZE, 2021-2031 ($MILLION)
TABLE 120. SWITZERLAND GLAMPING MARKET, BY END USER, 2021-2031 ($MILLION)
TABLE 121. SWITZERLAND GLAMPING MARKET, BY DISTRIBUTION CHANNEL, 2021-2031 ($MILLION)
TABLE 122. REST OF EUROPE GLAMPING MARKET, BY PRODUCT TYPE, 2021-2031 ($MILLION)
TABLE 123. REST OF EUROPE GLAMPING MARKET, BY APPLICATION, 2021-2031 ($MILLION)
TABLE 124. REST OF EUROPE GLAMPING MARKET, BY AGE GROUP, 2021-2031 ($MILLION)
TABLE 125. REST OF EUROPE GLAMPING MARKET, BY SIZE, 2021-2031 ($MILLION)
TABLE 126. REST OF EUROPE GLAMPING MARKET, BY END USER, 2021-2031 ($MILLION)
TABLE 127. REST OF EUROPE GLAMPING MARKET, BY DISTRIBUTION CHANNEL, 2021-2031 ($MILLION)
TABLE 128. ASIA-PACIFIC GLAMPING MARKET, BY PRODUCT TYPE, 2021-2031 ($MILLION)
TABLE 129. ASIA-PACIFIC GLAMPING MARKET, BY APPLICATION, 2021-2031 ($MILLION)
TABLE 130. ASIA-PACIFIC GLAMPING MARKET, BY AGE GROUP, 2021-2031 ($MILLION)
TABLE 131. ASIA-PACIFIC GLAMPING MARKET, BY SIZE, 2021-2031 ($MILLION)
TABLE 132. ASIA-PACIFIC GLAMPING MARKET, BY END USER, 2021-2031 ($MILLION)
TABLE 133. ASIA-PACIFIC GLAMPING MARKET, BY DISTRIBUTION CHANNEL, 2021-2031 ($MILLION)
TABLE 134. ASIA-PACIFIC GLAMPING MARKET, BY COUNTRY, 2021-2031 ($MILLION)
TABLE 135. CHINA GLAMPING MARKET, BY PRODUCT TYPE, 2021-2031 ($MILLION)
TABLE 136. CHINA GLAMPING MARKET, BY APPLICATION, 2021-2031 ($MILLION)
TABLE 137. CHINA GLAMPING MARKET, BY AGE GROUP, 2021-2031 ($MILLION)
TABLE 138. CHINA GLAMPING MARKET, BY SIZE, 2021-2031 ($MILLION)
TABLE 139. CHINA GLAMPING MARKET, BY END USER, 2021-2031 ($MILLION)
TABLE 140. CHINA GLAMPING MARKET, BY DISTRIBUTION CHANNEL, 2021-2031 ($MILLION)
TABLE 141. JAPAN GLAMPING MARKET, BY PRODUCT TYPE, 2021-2031 ($MILLION)
TABLE 142. JAPAN GLAMPING MARKET, BY APPLICATION, 2021-2031 ($MILLION)
TABLE 143. JAPAN GLAMPING MARKET, BY AGE GROUP, 2021-2031 ($MILLION)
TABLE 144. JAPAN GLAMPING MARKET, BY SIZE, 2021-2031 ($MILLION)
TABLE 145. JAPAN GLAMPING MARKET, BY END USER, 2021-2031 ($MILLION)
TABLE 146. JAPAN GLAMPING MARKET, BY DISTRIBUTION CHANNEL, 2021-2031 ($MILLION)
TABLE 147. INDIA GLAMPING MARKET, BY PRODUCT TYPE, 2021-2031 ($MILLION)
TABLE 148. INDIA GLAMPING MARKET, BY APPLICATION, 2021-2031 ($MILLION)
TABLE 149. INDIA GLAMPING MARKET, BY AGE GROUP, 2021-2031 ($MILLION)
TABLE 150. INDIA GLAMPING MARKET, BY SIZE, 2021-2031 ($MILLION)
TABLE 151. INDIA GLAMPING MARKET, BY END USER, 2021-2031 ($MILLION)
TABLE 152. INDIA GLAMPING MARKET, BY DISTRIBUTION CHANNEL, 2021-2031 ($MILLION)
TABLE 153. SOUTH KOREA GLAMPING MARKET, BY PRODUCT TYPE, 2021-2031 ($MILLION)
TABLE 154. SOUTH KOREA GLAMPING MARKET, BY APPLICATION, 2021-2031 ($MILLION)
TABLE 155. SOUTH KOREA GLAMPING MARKET, BY AGE GROUP, 2021-2031 ($MILLION)
TABLE 156. SOUTH KOREA GLAMPING MARKET, BY SIZE, 2021-2031 ($MILLION)
TABLE 157. SOUTH KOREA GLAMPING MARKET, BY END USER, 2021-2031 ($MILLION)
TABLE 158. SOUTH KOREA GLAMPING MARKET, BY DISTRIBUTION CHANNEL, 2021-2031 ($MILLION)
TABLE 159. AUSTRALIA GLAMPING MARKET, BY PRODUCT TYPE, 2021-2031 ($MILLION)
TABLE 160. AUSTRALIA GLAMPING MARKET, BY APPLICATION, 2021-2031 ($MILLION)
TABLE 161. AUSTRALIA GLAMPING MARKET, BY AGE GROUP, 2021-2031 ($MILLION)
TABLE 162. AUSTRALIA GLAMPING MARKET, BY SIZE, 2021-2031 ($MILLION)
TABLE 163. AUSTRALIA GLAMPING MARKET, BY END USER, 2021-2031 ($MILLION)
TABLE 164. AUSTRALIA GLAMPING MARKET, BY DISTRIBUTION CHANNEL, 2021-2031 ($MILLION)
TABLE 165. INDONESIA GLAMPING MARKET, BY PRODUCT TYPE, 2021-2031 ($MILLION)
TABLE 166. INDONESIA GLAMPING MARKET, BY APPLICATION, 2021-2031 ($MILLION)
TABLE 167. INDONESIA GLAMPING MARKET, BY AGE GROUP, 2021-2031 ($MILLION)
TABLE 168. INDONESIA GLAMPING MARKET, BY SIZE, 2021-2031 ($MILLION)
TABLE 169. INDONESIA GLAMPING MARKET, BY END USER, 2021-2031 ($MILLION)
TABLE 170. INDONESIA GLAMPING MARKET, BY DISTRIBUTION CHANNEL, 2021-2031 ($MILLION)
TABLE 171. THAILAND GLAMPING MARKET, BY PRODUCT TYPE, 2021-2031 ($MILLION)
TABLE 172. THAILAND GLAMPING MARKET, BY APPLICATION, 2021-2031 ($MILLION)
TABLE 173. THAILAND GLAMPING MARKET, BY AGE GROUP, 2021-2031 ($MILLION)
TABLE 174. THAILAND GLAMPING MARKET, BY SIZE, 2021-2031 ($MILLION)
TABLE 175. THAILAND GLAMPING MARKET, BY END USER, 2021-2031 ($MILLION)
TABLE 176. THAILAND GLAMPING MARKET, BY DISTRIBUTION CHANNEL, 2021-2031 ($MILLION)
TABLE 177. REST OF ASIA-PACIFIC GLAMPING MARKET, BY PRODUCT TYPE, 2021-2031 ($MILLION)
TABLE 178. REST OF ASIA-PACIFIC GLAMPING MARKET, BY APPLICATION, 2021-2031 ($MILLION)
TABLE 179. REST OF ASIA-PACIFIC GLAMPING MARKET, BY AGE GROUP, 2021-2031 ($MILLION)
TABLE 180. REST OF ASIA-PACIFIC GLAMPING MARKET, BY SIZE, 2021-2031 ($MILLION)
TABLE 181. REST OF ASIA-PACIFIC GLAMPING MARKET, BY END USER, 2021-2031 ($MILLION)
TABLE 182. REST OF ASIA-PACIFIC GLAMPING MARKET, BY DISTRIBUTION CHANNEL, 2021-2031 ($MILLION)
TABLE 183. LAMEA GLAMPING MARKET, BY PRODUCT TYPE, 2021-2031 ($MILLION)
TABLE 184. LAMEA GLAMPING MARKET, BY APPLICATION, 2021-2031 ($MILLION)
TABLE 185. LAMEA GLAMPING MARKET, BY AGE GROUP, 2021-2031 ($MILLION)
TABLE 186. LAMEA GLAMPING MARKET, BY SIZE, 2021-2031 ($MILLION)
TABLE 187. LAMEA GLAMPING MARKET, BY END USER, 2021-2031 ($MILLION)
TABLE 188. LAMEA GLAMPING MARKET, BY DISTRIBUTION CHANNEL, 2021-2031 ($MILLION)
TABLE 189. LAMEA GLAMPING MARKET, BY COUNTRY, 2021-2031 ($MILLION)
TABLE 190. LATIN AMERICA GLAMPING MARKET, BY PRODUCT TYPE, 2021-2031 ($MILLION)
TABLE 191. LATIN AMERICA GLAMPING MARKET, BY APPLICATION, 2021-2031 ($MILLION)
TABLE 192. LATIN AMERICA GLAMPING MARKET, BY AGE GROUP, 2021-2031 ($MILLION)
TABLE 193. LATIN AMERICA GLAMPING MARKET, BY SIZE, 2021-2031 ($MILLION)
TABLE 194. LATIN AMERICA GLAMPING MARKET, BY END USER, 2021-2031 ($MILLION)
TABLE 195. LATIN AMERICA GLAMPING MARKET, BY DISTRIBUTION CHANNEL, 2021-2031 ($MILLION)
TABLE 196. MIDDLE EAST GLAMPING MARKET, BY PRODUCT TYPE, 2021-2031 ($MILLION)
TABLE 197. MIDDLE EAST GLAMPING MARKET, BY APPLICATION, 2021-2031 ($MILLION)
TABLE 198. MIDDLE EAST GLAMPING MARKET, BY AGE GROUP, 2021-2031 ($MILLION)
TABLE 199. MIDDLE EAST GLAMPING MARKET, BY SIZE, 2021-2031 ($MILLION)
TABLE 200. MIDDLE EAST GLAMPING MARKET, BY END USER, 2021-2031 ($MILLION)
TABLE 201. MIDDLE EAST GLAMPING MARKET, BY DISTRIBUTION CHANNEL, 2021-2031 ($MILLION)
TABLE 202. AFRICA GLAMPING MARKET, BY PRODUCT TYPE, 2021-2031 ($MILLION)
TABLE 203. AFRICA GLAMPING MARKET, BY APPLICATION, 2021-2031 ($MILLION)
TABLE 204. AFRICA GLAMPING MARKET, BY AGE GROUP, 2021-2031 ($MILLION)
TABLE 205. AFRICA GLAMPING MARKET, BY SIZE, 2021-2031 ($MILLION)
TABLE 206. AFRICA GLAMPING MARKET, BY END USER, 2021-2031 ($MILLION)
TABLE 207. AFRICA GLAMPING MARKET, BY DISTRIBUTION CHANNEL, 2021-2031 ($MILLION)
TABLE 208.HILLEBERG AB: COMPANY SNAPSHOT
TABLE 209.HILLEBERG AB: OPERATING SEGMENTS
TABLE 210.HILLEBERG AB: PRODUCT PORTFOLIO
TABLE 211.HILLEBERG AB: NET SALES,
TABLE 212.HILLEBERG AB: KEY STRATERGIES
TABLE 213.JOHNSON OUTDOORS INC: COMPANY SNAPSHOT
TABLE 214.JOHNSON OUTDOORS INC: OPERATING SEGMENTS
TABLE 215.JOHNSON OUTDOORS INC: PRODUCT PORTFOLIO
TABLE 216.JOHNSON OUTDOORS INC: NET SALES,
TABLE 217.JOHNSON OUTDOORS INC: KEY STRATERGIES
TABLE 218.THE NORTH FACE INC: COMPANY SNAPSHOT
TABLE 219.THE NORTH FACE INC: OPERATING SEGMENTS
TABLE 220.THE NORTH FACE INC: PRODUCT PORTFOLIO
TABLE 221.THE NORTH FACE INC: NET SALES,
TABLE 222.THE NORTH FACE INC: KEY STRATERGIES
TABLE 223.AMG GROUP: COMPANY SNAPSHOT
TABLE 224.AMG GROUP: OPERATING SEGMENTS
TABLE 225.AMG GROUP: PRODUCT PORTFOLIO
TABLE 226.AMG GROUP: NET SALES,
TABLE 227.AMG GROUP: KEY STRATERGIES
TABLE 228.NEWELL BRANDS INC: COMPANY SNAPSHOT
TABLE 229.NEWELL BRANDS INC: OPERATING SEGMENTS
TABLE 230.NEWELL BRANDS INC: PRODUCT PORTFOLIO
TABLE 231.NEWELL BRANDS INC: NET SALES,
TABLE 232.NEWELL BRANDS INC: KEY STRATERGIES
TABLE 233.OASE OUTDOORS: COMPANY SNAPSHOT
TABLE 234.OASE OUTDOORS: OPERATING SEGMENTS
TABLE 235.OASE OUTDOORS: PRODUCT PORTFOLIO
TABLE 236.OASE OUTDOORS: NET SALES,
TABLE 237.OASE OUTDOORS: KEY STRATERGIES
TABLE 238.THE COLEMAN COMPANY: COMPANY SNAPSHOT
TABLE 239.THE COLEMAN COMPANY: OPERATING SEGMENTS
TABLE 240.THE COLEMAN COMPANY: PRODUCT PORTFOLIO
TABLE 241.THE COLEMAN COMPANY: NET SALES,
TABLE 242.THE COLEMAN COMPANY: KEY STRATERGIES
TABLE 243.SIMEX OUTDOOR INTERNATIONAL: COMPANY SNAPSHOT
TABLE 244.SIMEX OUTDOOR INTERNATIONAL: OPERATING SEGMENTS
TABLE 245.SIMEX OUTDOOR INTERNATIONAL: PRODUCT PORTFOLIO
TABLE 246.SIMEX OUTDOOR INTERNATIONAL: NET SALES,
TABLE 247.SIMEX OUTDOOR INTERNATIONAL: KEY STRATERGIES
TABLE 248.KAMPA: COMPANY SNAPSHOT
TABLE 249.KAMPA: OPERATING SEGMENTS
TABLE 250.KAMPA: PRODUCT PORTFOLIO
TABLE 251.KAMPA: NET SALES,
TABLE 252.KAMPA: KEY STRATERGIES
TABLE 253.EXXEL OUTDOORS: COMPANY SNAPSHOT
TABLE 254.EXXEL OUTDOORS: OPERATING SEGMENTS
TABLE 255.EXXEL OUTDOORS: PRODUCT PORTFOLIO
TABLE 256.EXXEL OUTDOORS: NET SALES,
TABLE 257.EXXEL OUTDOORS: KEY STRATERGIES
TABLE 258.BUSHTEC SAFARI: COMPANY SNAPSHOT
TABLE 259.BUSHTEC SAFARI: OPERATING SEGMENTS
TABLE 260.BUSHTEC SAFARI: PRODUCT PORTFOLIO
TABLE 261.BUSHTEC SAFARI: NET SALES,
TABLE 262.BUSHTEC SAFARI: KEY STRATERGIES
TABLE 263.SAWDAY’S CANOPY AND STARS LTD.: COMPANY SNAPSHOT
TABLE 264.SAWDAY’S CANOPY AND STARS LTD.: OPERATING SEGMENTS
TABLE 265.SAWDAY’S CANOPY AND STARS LTD.: PRODUCT PORTFOLIO
TABLE 266.SAWDAY’S CANOPY AND STARS LTD.: NET SALES,
TABLE 267.SAWDAY’S CANOPY AND STARS LTD.: KEY STRATERGIES
TABLE 268.HUTTOPIA: COMPANY SNAPSHOT
TABLE 269.HUTTOPIA: OPERATING SEGMENTS
TABLE 270.HUTTOPIA: PRODUCT PORTFOLIO
TABLE 271.HUTTOPIA: NET SALES,
TABLE 272.HUTTOPIA: KEY STRATERGIES
TABLE 273.WIGWAM HOLIDAYS LTD: COMPANY SNAPSHOT
TABLE 274.WIGWAM HOLIDAYS LTD: OPERATING SEGMENTS
TABLE 275.WIGWAM HOLIDAYS LTD: PRODUCT PORTFOLIO
TABLE 276.WIGWAM HOLIDAYS LTD: NET SALES,
TABLE 277.WIGWAM HOLIDAYS LTD: KEY STRATERGIES
TABLE 278.ARENACAMPSITES: COMPANY SNAPSHOT
TABLE 279.ARENACAMPSITES: OPERATING SEGMENTS
TABLE 280.ARENACAMPSITES: PRODUCT PORTFOLIO
TABLE 281.ARENACAMPSITES: NET SALES,
TABLE 282.ARENACAMPSITES: KEY STRATERGIES
LIST OF FIGURES
FIGURE 1.GLAMPING MARKET SEGMENTATION
FIGURE 2.GLAMPING MARKET,2021-2031
FIGURE 3.GLAMPING MARKET,2021-2031
FIGURE 4. TOP INVESTMENT POCKETS, BY REGION
FIGURE 5.PORTER FIVE-1
FIGURE 6.PORTER FIVE-2
FIGURE 7.PORTER FIVE-3
FIGURE 8.PORTER FIVE-4
FIGURE 9.PORTER FIVE-5
FIGURE 10.TOP PLAYER POSITIONING
FIGURE 11.GLAMPING MARKET:DRIVERS, RESTRAINTS AND OPPORTUNITIES
FIGURE 12.GLAMPING MARKET,BY PRODUCT TYPE,2021(%)
FIGURE 13.COMPARATIVE SHARE ANALYSIS OF CAMPING PODS AND CABINS GLAMPING MARKET,2021-2031(%)
FIGURE 14.COMPARATIVE SHARE ANALYSIS OF YURTS GLAMPING MARKET,2021-2031(%)
FIGURE 15.COMPARATIVE SHARE ANALYSIS OF TENTS GLAMPING MARKET,2021-2031(%)
FIGURE 16.COMPARATIVE SHARE ANALYSIS OF TREEHOUSES GLAMPING MARKET,2021-2031(%)
FIGURE 17.COMPARATIVE SHARE ANALYSIS OF OTHERS GLAMPING MARKET,2021-2031(%)
FIGURE 18.GLAMPING MARKET,BY APPLICATION,2021(%)
FIGURE 19.COMPARATIVE SHARE ANALYSIS OF FAMILY TRAVEL GLAMPING MARKET,2021-2031(%)
FIGURE 20.COMPARATIVE SHARE ANALYSIS OF ENTERPRISE TRAVEL GLAMPING MARKET,2021-2031(%)
FIGURE 21.GLAMPING MARKET,BY AGE GROUP,2021(%)
FIGURE 22.COMPARATIVE SHARE ANALYSIS OF 18-32 YEARS GLAMPING MARKET,2021-2031(%)
FIGURE 23.COMPARATIVE SHARE ANALYSIS OF 33-50 YEARS GLAMPING MARKET,2021-2031(%)
FIGURE 24.COMPARATIVE SHARE ANALYSIS OF 51-65 YEARS GLAMPING MARKET,2021-2031(%)
FIGURE 25.COMPARATIVE SHARE ANALYSIS OF ABOVE 65 YEARS GLAMPING MARKET,2021-2031(%)
FIGURE 26.GLAMPING MARKET,BY SIZE,2021(%)
FIGURE 27.COMPARATIVE SHARE ANALYSIS OF 2-PERSON GLAMPING MARKET,2021-2031(%)
FIGURE 28.COMPARATIVE SHARE ANALYSIS OF 4-PERSON GLAMPING MARKET,2021-2031(%)
FIGURE 29.COMPARATIVE SHARE ANALYSIS OF OTHERS GLAMPING MARKET,2021-2031(%)
FIGURE 30.GLAMPING MARKET,BY END USER,2021(%)
FIGURE 31.COMPARATIVE SHARE ANALYSIS OF CONSUMERS GLAMPING MARKET,2021-2031(%)
FIGURE 32.COMPARATIVE SHARE ANALYSIS OF EVENTS GLAMPING MARKET,2021-2031(%)
FIGURE 33.GLAMPING MARKET,BY DISTRIBUTION CHANNEL,2021(%)
FIGURE 34.COMPARATIVE SHARE ANALYSIS OF SUPERMARKETS AND HYPERMARKETS GLAMPING MARKET,2021-2031(%)
FIGURE 35.COMPARATIVE SHARE ANALYSIS OF SPECIALTY STORES GLAMPING MARKET,2021-2031(%)
FIGURE 36.COMPARATIVE SHARE ANALYSIS OF E-COMMERCE GLAMPING MARKET,2021-2031(%)
FIGURE 37.COMPARATIVE SHARE ANALYSIS OF OTHERS GLAMPING MARKET,2021-2031(%)
FIGURE 38.GLAMPING MARKET BY REGION,2021
FIGURE 39.U.S. GLAMPING MARKET,2021-2031($MILLION)
FIGURE 40.CANADA GLAMPING MARKET,2021-2031($MILLION)
FIGURE 41.MEXICO GLAMPING MARKET,2021-2031($MILLION)
FIGURE 42.U.K. GLAMPING MARKET,2021-2031($MILLION)
FIGURE 43.ITALY GLAMPING MARKET,2021-2031($MILLION)
FIGURE 44.GERMANY GLAMPING MARKET,2021-2031($MILLION)
FIGURE 45.FRANCE GLAMPING MARKET,2021-2031($MILLION)
FIGURE 46.SPAIN GLAMPING MARKET,2021-2031($MILLION)
FIGURE 47.THE NETHERLANDS GLAMPING MARKET,2021-2031($MILLION)
FIGURE 48.SWITZERLAND GLAMPING MARKET,2021-2031($MILLION)
FIGURE 49.REST OF EUROPE GLAMPING MARKET,2021-2031($MILLION)
FIGURE 50.CHINA GLAMPING MARKET,2021-2031($MILLION)
FIGURE 51.JAPAN GLAMPING MARKET,2021-2031($MILLION)
FIGURE 52.INDIA GLAMPING MARKET,2021-2031($MILLION)
FIGURE 53.SOUTH KOREA GLAMPING MARKET,2021-2031($MILLION)
FIGURE 54.AUSTRALIA GLAMPING MARKET,2021-2031($MILLION)
FIGURE 55.INDONESIA GLAMPING MARKET,2021-2031($MILLION)
FIGURE 56.THAILAND GLAMPING MARKET,2021-2031($MILLION)
FIGURE 57.REST OF ASIA-PACIFIC GLAMPING MARKET,2021-2031($MILLION)
FIGURE 58.LATIN AMERICA GLAMPING MARKET,2021-2031($MILLION)
FIGURE 59.MIDDLE EAST GLAMPING MARKET,2021-2031($MILLION)
FIGURE 60.AFRICA GLAMPING MARKET,2021-2031($MILLION)
FIGURE 61. TOP WINNING STRATEGIES, BY YEAR
FIGURE 62. TOP WINNING STRATEGIES, BY DEVELOPMENT
FIGURE 63. TOP WINNING STRATEGIES, BY COMPANY
FIGURE 64.PRODUCT MAPPING OF TOP 10 PLAYERS
FIGURE 65.COMPETITIVE DASHBOARD
FIGURE 66.COMPETITIVE HEATMAP OF TOP 10 KEY PLAYERS
FIGURE 67.HILLEBERG AB.: NET SALES ,($MILLION)
FIGURE 68.JOHNSON OUTDOORS INC.: NET SALES ,($MILLION)
FIGURE 69.THE NORTH FACE INC.: NET SALES ,($MILLION)
FIGURE 70.AMG GROUP.: NET SALES ,($MILLION)
FIGURE 71.NEWELL BRANDS INC.: NET SALES ,($MILLION)
FIGURE 72.OASE OUTDOORS.: NET SALES ,($MILLION)
FIGURE 73.THE COLEMAN COMPANY.: NET SALES ,($MILLION)
FIGURE 74.SIMEX OUTDOOR INTERNATIONAL.: NET SALES ,($MILLION)
FIGURE 75.KAMPA.: NET SALES ,($MILLION)
FIGURE 76.EXXEL OUTDOORS.: NET SALES ,($MILLION)
FIGURE 77.BUSHTEC SAFARI.: NET SALES ,($MILLION)
FIGURE 78.SAWDAY’S CANOPY AND STARS LTD..: NET SALES ,($MILLION)
FIGURE 79.HUTTOPIA.: NET SALES ,($MILLION)
FIGURE 80.WIGWAM HOLIDAYS LTD.: NET SALES ,($MILLION)
FIGURE 81.ARENACAMPSITES.: NET SALES ,($MILLION)
$5730
$6450
$9600
HAVE A QUERY?
OUR CUSTOMER

SIMILAR REPORTS