Business Travel Market Analysis
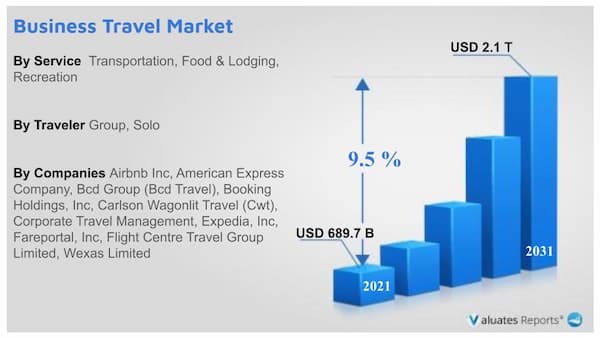
The global business travel market size was valued at $689.7 billion in 2021, and is projected to reach $2.1 trillion by 2031, growing at a CAGR of 9.5% from 2022 to 2031.
The business travel market is segmented into INDUSTRY, SERVICE and TRAVELER.
Business travel is a division of regular tourism in which people travel for a business-oriented purpose. It includes transportation, accommodation, business work, entertainment, and other activities. The global travel & tourism industry is one of the largest industries with a global economic contribution of more than $9000 billion, in 2019.
According to World Travel and Tourism Council (WTTC), the global travel & tourism sector contributed to around $5.8 trillion to the global GDP (Gross Domestic Product) in 2021. The business travel segment witnesses the highest growth rate in this industry, as employees working in multinational organizations are often required to travel across various countries for business purposes. In business tourism, destinations are commercial places, which are well-developed and suited for trade work. Travel & tourism includes leisure tourism, business tourism, medical tourism, and others. The factors that promote the growth of travel & tourism industry include changes in lifestyle, rise in tourism promotion, increase in accessibility of transport facilities, and surge in infrastructures, which in turn are expected to fuel the growth of the business travel market. Factors such as technological advancements have given rise to easy access to hotel & transport booking through online portals, which further boost market growth. Continuous development in the travel & tourism industry and integration of various segments such as hospitality & infrastructure with government initiatives accelerate the growth of global travel & tourism industry, which in turn supplements the growth of the business travel market.
Numerous companies operating in the global business travel market are trying to provide well-managed and cost-effective programs to the customers with the rise in demand for business travel management. The growth of the global business travel market is driven by the expansion of the travel & tourism industry, surge in government initiatives for the development of meetings, incentives, conferences, and events (MICE) segment & small and medium-sized enterprises (SMEs) sector and increase in globalization of businesses. However, surge in adoption of advanced technology such as video conferencing hampers the market growth, as it is cost-effective and less time-consuming as compared to travelling.
Market Dynamics
SMEs (small and medium-sized enterprises) play a crucial role in the development of the economy. These firms offer numerous job opportunities, and therefore they are one of the significant sectors that aid in reducing unemployment, even when large enterprises are downsizing. However, certain challenges such as weak linkage with external market and limited SME financing act as restraints in the growth of the SMEs.
To sustain the economy, governments have started taking numerous initiatives such as Udayami Helpline, Skill India, District-level Incubation and Accelerator Program in India, SME Industrial Clustering in China, and other countries to promote the growth of the SME segment. Moreover, in 2021, there were approximately 400 million SMEs across the globe that constitute 95% of the global business firms. The growth of the SMEs has significantly promoted the growth of the business travel market, as business travelers in this sector frequently travel to seek every small opportunity to expand their market size in this large industry.
Conversely, increase in infrastructural investment and rapid growth in the travel retail market are anticipated to provide lucrative opportunities for the business travel market. The outbreak of COVID-19 emerged as a major threat to the global travel & tourism industry that severely deteriorated the business travel industry. The pandemic led to cancellation of almost all the major business travel activities and MICE events across the globe.
Moreover, the wide spread penetration of online video conferencing platforms such as Zoom and Google Meet, due to travel restrictions is expected to compete with the players operating in the global business travel market in the future. The adoption of video conferencing platforms is serving the needs of many companies for meetings and conferences and is also adopted by them as a cost control measure as companies are avoiding the costly business travel expenses. In this way, COVID-19 has changed the competitive landscape of the global business travel market and is anticipated to have a long-term effect.
There are various technological advancements that emerged in the recent years and are being adopted by the business travel stakeholders. The popular technologies such as virtual reality, augmented reality, artificial intelligence, chat bots, voice search & voice control technology, and internet of things (IoT) are used by the players operating in the business travel market.
Voice search, chat bots are used in the websites to provide customers the convenience and ease of booking hotels and tickets. With the help of virtual reality, customers can take a 360 degree tour of the hotels, restaurants, and landscapes by sitting at the comfort of their home and decide whether to book a hotel or not. Moreover, robotics technology is also being used in hotels and restaurants. Robots can potentially be used in preparation of food and food services. Robots can be used in hotels for cleaning, luggage handling, and greeting guests that may help to attract customers. All these technologies are expected to drive the global business market in the upcoming future.
Public and private travel & tourism investment is necessary to support the ongoing growth of the sector. High investment is required to build structures and facilities to expand capacity and maintain & improve current infrastructure. However, some of the regions such as India, China, Saudi Arabia, and the UAE have witnessed a strong economic growth and notable development in business travel over the years. Thus, these countries focus on infrastructural development of roads, airports, and better hotels to cater to the demands of corporate and government travelers.
For example, Chinese government has increased its rail network to 132,000 km over the past decade. It also developed 5.9 km air route recently and has a total of 8.4 km air route network. The air passenger volume of China has now become the second largest across the globe. China has also invested heavily in developing high-speed rail system since 2008 and now China has around two-thirds of the global high-speed rail network. Therefore, rapid infrastructural development facilitates business and business tourism. These infrastructural developments has made China the leader in the business travel market.
The primary focus of every business is to achieve profit maximization at minimum cost. High investment often generates high revenue. However, economic uncertainty along with recession has degraded the consumption rate of the market, thereby declining the sales significantly. This has changed the pattern of investments for several companies, as they have started adopting cost-cutting strategies. However, business travel is an expensive affair, as it involves transportation such as flights & taxi, food & accommodation of the traveler, and the expense is significantly higher if it is an international trip.
This issue has been overcome with the help of technological advancements. Advancement such as online banking, phone calls, emails, and video conferences have made communication and transactions significantly cost-effective and easy in real time. Moreover, the emergence of real-time communication opportunity is encouraging companies to adopt several communication technologies such as video conferencing through online platforms such as Skype, FaceTime, Google Meet, and Zoom. Low cost and high effectiveness of such technology is acting as a major restraint for the business travel market growth.
Segment Overview
The global business travel market is segmented based on the service, industry, traveler, and region. Based on service, it is segmented into transportation, food & lodging, and recreation. Furthermore, the transportation segment is categorized into air, rail, and car. On the basis of industry, the business travel market is segmented into government and corporate. The business travel market, on the basis of traveler, is categorized into group and solo traveler. By region, the global business travel market is analyzed across North America, Europe, Asia-Pacific, and LAMEA.
According to the business travel market forecast, based on service, the food & lodging segment is expected to be the fastest-growing segment, growing at a CAGR of 9.8% during the forecast period. The food & lodging was also the dominating segment, garnering around 50.4% of the business travel market share in 2021. The growing penetration of hotel booking agents such as Airbnb and Oravel Stays, are fostering the growth of the food & lodging segment.
As per the business travel market analysis, based on the industry, the corporate segment was the dominating segment and is also forecasted to be the fastest-growing segment due to growth of business activities across the globe. The corporate segment accounted for around 65.9% market share in 2021 and is expected to witness growth at the highest CAGR of 9.8% during the forecast period.
Based on traveler, the group was the largest and the fastest-growing segment that garnered 59.9% market share in 2021 and is anticipated to grow at a significant CAGR of 9.9% in the upcoming future. The group segment is prospering as the cost involved in group tourism is lower. Further, the service providers offers discounted rates on accommodation and transportation for group travel.
Regional Analysis
Based on the region, the Asia-Pacific is the largest and the fastest-growing market for business travel due to rapidly growing infrastructure, favorable conditions for setting up businesses, and government policies for attracting foreign investments. Asia-Pacific accounted for 43.7% of the market in 2021 followed by North America and Europe that constituted 26.2% and 24.2% market share respectively in 2021. LAMEA is expected to show considerable growth due to growing business activities, growing government initiatives to attract FDIs (foreign direct investments), and continuous infrastructural development in the region.
Key Market Players
The players operating in the global business travel market have adopted various developmental strategies to expand their market share, explore the business travel market opportunities, and increase profitability in the market. The key players profiled in this report include American Express Company, BCD Group, CWT Global B.V., American Express Global Business Travel, Chase, Navan, Inc., TravelPerk S.L.U, Corporate Travel Management Limited, Flight Centre Travel Group Limited, and Citi Bank N.A.
Some Examples of partnership in the market are:
In August 2022, BCD Group (BCD Travel) extends partnership with FairFly to offer their APA solution to the entire global customer base. Through this, BCD Travel will leverage FairFly's technology and artificial intelligence to power their air price assurance (APA) solution.
In July 2022, BCD Group (BCD Travel) partnered with Airbus, which is an aerospace products manufacturing company in order to service four European home markets namely, France, Germany, Spain and the UK.
In December 2022, CWT Global B.V., expanded global partnership with Paramount Global, which is multinational media and entertainment conglomerate. Through this, it will manage Paramount's expanded travel business.
Some Examples of product launches in the market are:
In July 2022, CWT Global B.V., announced to launch car rental and train booking capabilities to the mobile and web channels on its myCWT platform.
Some Examples of acquisitions in the market are:
In February 2020, BCD Group (BCD Travel) acquired the Ventura Spa to extend its service such as corporate travel, meetings & events and travel consolidation services.
In July 2022, Corporate Travel Management Limited acquired 1000 Mile Travel Group Ltd, in order to expand its interest in the business travel market through independent consultant model.
In August 2020, Flight Centre Travel Group Limited acquired WhereTo, a San Francisco-based enterprise travel platform and technology company. This development done to include artificial intelligence technology so that it helps in recommending employees hotels, flights and ground transportation.
Key benefits for stakeholders
- This report provides a quantitative analysis of the market segments, current trends, estimations, and dynamics of the business travel market analysis from 2021 to 2031 to identify the prevailing business travel market demand.
- The market research is offered along with information related to key drivers, restraints, and opportunities.
- Porter's five forces analysis highlights the potency of buyers and suppliers to enable stakeholders make profit-oriented business decisions and strengthen their supplier-buyer network.
- In-depth analysis of the business travel market segmentation assists to determine the prevailing market opportunities.
- Major countries in each region are mapped according to their revenue contribution to the global market.
- Market player positioning facilitates benchmarking and provides a clear understanding of the present position of the market players.
- The report includes the business travel market statistics of the regional as well as global business travel market trends, key players, market segments, application areas, and market growth strategies.
Business Travel Market Segments
Business Travel Market by Industry
Business Travel Market by Service
- Transportation
- Food & Lodging
- Recreation
Business Travel Market by Traveler
Business Travel Market by Region
- North America
- Europe
- UK
- Germany
- France
- Spain
- Italy
- Rest of Europe
- Asia-Pacific
- China
- Japan
- India
- Rest of Asia-Pacific
- LAMEA
- Brazil
- Turkey
- South Africa
- Saudi Arabia
- Rest of LAMEA
Major Players in the Business Travel Market
- Airbnb Inc
- American Express Company
- Bcd Group (Bcd Travel)
- Booking Holdings, Inc
- Carlson Wagonlit Travel (Cwt)
- Corporate Travel Management
- Expedia, Inc
- Fareportal, Inc
- Flight Centre Travel Group Limited
- Wexas Limited
Scope of the Business Travel Market Report
| Report Metric |
Details |
| Report Name |
Business Travel Market |
| The market size in 2021 |
USD 689.7 Billion |
| The revenue forecast in 2031 |
USD 2,001.1 Billion |
| Growth Rate |
Compound Annual Growth Rate (CAGR) of 9.5% from 2021 to 2031 |
| Market size available for years |
2021-2031 |
| Forecast units |
Value (USD) |
| Segments covered |
By Service, Industry, Traveler, Regions |
| Report coverage |
Revenue & volume forecast, company share, competitive landscape, growth factors, and trends |
| Geographic regions covered |
North America, Europe, Asia Pacific, Latin America, Middle East & Africa |
Chapter 1 : INTRODUCTION
1.1. Report description
1.2. Key market segments
1.3. Key benefits to the stakeholders
1.4. Research Methodology
1.4.1. Primary research
1.4.2. Secondary research
1.4.3. Analyst tools and models
Chapter 2 : EXECUTIVE SUMMARY
2.1. CXO Perspective
Chapter 3 : MARKET OVERVIEW
3.1. Market definition and scope
3.2. Key findings
3.2.1. Top impacting factors
3.2.2. Top investment pockets
3.3. Porter’s five forces analysis
3.3.1. Bargaining power of suppliers
3.3.2. Bargaining power of buyers
3.3.3. Threat of substitutes
3.3.4. Threat of new entrants
3.3.5. Intensity of rivalry
3.4. Market dynamics
3.4.1. Drivers
3.4.1.1. Globalization is positively impacting business travel
3.4.1.2. Rapid growth of SMEs
3.4.1.3. Development of the global tourism industry
3.4.2. Restraints
3.4.2.1. Growing adoption of ICT technology
3.4.3. Opportunities
3.4.3.1. Adoption of different technological advancements
3.4.3.2. Growing infrastructure
3.5. COVID-19 Impact Analysis on the market
3.6. Parent-Peer Market Analysis
3.7. Top Impacting Factors
Chapter 4 : BUSINESS TRAVEL MARKET, BY INDUSTRY
4.1. Overview
4.1.1. Market size and forecast
4.2. Government
4.2.1. Key market trends, growth factors and opportunities
4.2.2. Market size and forecast, by region
4.2.3. Market share analysis by country
4.3. Corporate
4.3.1. Key market trends, growth factors and opportunities
4.3.2. Market size and forecast, by region
4.3.3. Market share analysis by country
Chapter 5 : BUSINESS TRAVEL MARKET, BY SERVICE
5.1. Overview
5.1.1. Market size and forecast
5.2. Transportation
5.2.1. Key market trends, growth factors and opportunities
5.2.2. Market size and forecast, by region
5.2.3. Market share analysis by country
5.2.4. Transportation Business Travel Market by Sub Type
5.2.4.1. Air Market size and forecast, by region
5.2.4.2. Air Market size and forecast, by country
5.2.4.3. Rail Market size and forecast, by region
5.2.4.4. Rail Market size and forecast, by country
5.2.4.5. Car Market size and forecast, by region
5.2.4.6. Car Market size and forecast, by country
5.3. Food and Lodging
5.3.1. Key market trends, growth factors and opportunities
5.3.2. Market size and forecast, by region
5.3.3. Market share analysis by country
5.4. Recreation
5.4.1. Key market trends, growth factors and opportunities
5.4.2. Market size and forecast, by region
5.4.3. Market share analysis by country
Chapter 6 : BUSINESS TRAVEL MARKET, BY TRAVELER
6.1. Overview
6.1.1. Market size and forecast
6.2. Group
6.2.1. Key market trends, growth factors and opportunities
6.2.2. Market size and forecast, by region
6.2.3. Market share analysis by country
6.3. Solo
6.3.1. Key market trends, growth factors and opportunities
6.3.2. Market size and forecast, by region
6.3.3. Market share analysis by country
Chapter 7 : BUSINESS TRAVEL MARKET, BY REGION
7.1. Overview
7.1.1. Market size and forecast By Region
7.2. North America
7.2.1. Key trends and opportunities
7.2.2. Market size and forecast, by INDUSTRY
7.2.3. Market size and forecast, by SERVICE
7.2.3.1. North America Transportation Business Travel Market by Sub Type
7.2.4. Market size and forecast, by TRAVELER
7.2.5. Market size and forecast, by country
7.2.5.1. U.S.
7.2.5.1.1. Key market trends, growth factors and opportunities
7.2.5.1.2. Market size and forecast, by INDUSTRY
7.2.5.1.3. Market size and forecast, by SERVICE
7.2.5.1.3.1. U.S. Transportation Business Travel Market by Sub Type
7.2.5.1.4. Market size and forecast, by TRAVELER
7.2.5.2. Canada
7.2.5.2.1. Key market trends, growth factors and opportunities
7.2.5.2.2. Market size and forecast, by INDUSTRY
7.2.5.2.3. Market size and forecast, by SERVICE
7.2.5.2.3.1. Canada Transportation Business Travel Market by Sub Type
7.2.5.2.4. Market size and forecast, by TRAVELER
7.2.5.3. Mexico
7.2.5.3.1. Key market trends, growth factors and opportunities
7.2.5.3.2. Market size and forecast, by INDUSTRY
7.2.5.3.3. Market size and forecast, by SERVICE
7.2.5.3.3.1. Mexico Transportation Business Travel Market by Sub Type
7.2.5.3.4. Market size and forecast, by TRAVELER
7.3. Europe
7.3.1. Key trends and opportunities
7.3.2. Market size and forecast, by INDUSTRY
7.3.3. Market size and forecast, by SERVICE
7.3.3.1. Europe Transportation Business Travel Market by Sub Type
7.3.4. Market size and forecast, by TRAVELER
7.3.5. Market size and forecast, by country
7.3.5.1. Germany
7.3.5.1.1. Key market trends, growth factors and opportunities
7.3.5.1.2. Market size and forecast, by INDUSTRY
7.3.5.1.3. Market size and forecast, by SERVICE
7.3.5.1.3.1. Germany Transportation Business Travel Market by Sub Type
7.3.5.1.4. Market size and forecast, by TRAVELER
7.3.5.2. France
7.3.5.2.1. Key market trends, growth factors and opportunities
7.3.5.2.2. Market size and forecast, by INDUSTRY
7.3.5.2.3. Market size and forecast, by SERVICE
7.3.5.2.3.1. France Transportation Business Travel Market by Sub Type
7.3.5.2.4. Market size and forecast, by TRAVELER
7.3.5.3. Spain
7.3.5.3.1. Key market trends, growth factors and opportunities
7.3.5.3.2. Market size and forecast, by INDUSTRY
7.3.5.3.3. Market size and forecast, by SERVICE
7.3.5.3.3.1. Spain Transportation Business Travel Market by Sub Type
7.3.5.3.4. Market size and forecast, by TRAVELER
7.3.5.4. Italy
7.3.5.4.1. Key market trends, growth factors and opportunities
7.3.5.4.2. Market size and forecast, by INDUSTRY
7.3.5.4.3. Market size and forecast, by SERVICE
7.3.5.4.3.1. Italy Transportation Business Travel Market by Sub Type
7.3.5.4.4. Market size and forecast, by TRAVELER
7.3.5.5. Sweden
7.3.5.5.1. Key market trends, growth factors and opportunities
7.3.5.5.2. Market size and forecast, by INDUSTRY
7.3.5.5.3. Market size and forecast, by SERVICE
7.3.5.5.3.1. Sweden Transportation Business Travel Market by Sub Type
7.3.5.5.4. Market size and forecast, by TRAVELER
7.3.5.6. Greece
7.3.5.6.1. Key market trends, growth factors and opportunities
7.3.5.6.2. Market size and forecast, by INDUSTRY
7.3.5.6.3. Market size and forecast, by SERVICE
7.3.5.6.3.1. Greece Transportation Business Travel Market by Sub Type
7.3.5.6.4. Market size and forecast, by TRAVELER
7.3.5.7. Rest of Europe
7.3.5.7.1. Key market trends, growth factors and opportunities
7.3.5.7.2. Market size and forecast, by INDUSTRY
7.3.5.7.3. Market size and forecast, by SERVICE
7.3.5.7.3.1. Rest of Europe Transportation Business Travel Market by Sub Type
7.3.5.7.4. Market size and forecast, by TRAVELER
7.4. Asia-Pacific
7.4.1. Key trends and opportunities
7.4.2. Market size and forecast, by INDUSTRY
7.4.3. Market size and forecast, by SERVICE
7.4.3.1. Asia-Pacific Transportation Business Travel Market by Sub Type
7.4.4. Market size and forecast, by TRAVELER
7.4.5. Market size and forecast, by country
7.4.5.1. China
7.4.5.1.1. Key market trends, growth factors and opportunities
7.4.5.1.2. Market size and forecast, by INDUSTRY
7.4.5.1.3. Market size and forecast, by SERVICE
7.4.5.1.3.1. China Transportation Business Travel Market by Sub Type
7.4.5.1.4. Market size and forecast, by TRAVELER
7.4.5.2. Japan
7.4.5.2.1. Key market trends, growth factors and opportunities
7.4.5.2.2. Market size and forecast, by INDUSTRY
7.4.5.2.3. Market size and forecast, by SERVICE
7.4.5.2.3.1. Japan Transportation Business Travel Market by Sub Type
7.4.5.2.4. Market size and forecast, by TRAVELER
7.4.5.3. India
7.4.5.3.1. Key market trends, growth factors and opportunities
7.4.5.3.2. Market size and forecast, by INDUSTRY
7.4.5.3.3. Market size and forecast, by SERVICE
7.4.5.3.3.1. India Transportation Business Travel Market by Sub Type
7.4.5.3.4. Market size and forecast, by TRAVELER
7.4.5.4. Rest of Asia-Pacific
7.4.5.4.1. Key market trends, growth factors and opportunities
7.4.5.4.2. Market size and forecast, by INDUSTRY
7.4.5.4.3. Market size and forecast, by SERVICE
7.4.5.4.3.1. Rest of Asia-Pacific Transportation Business Travel Market by Sub Type
7.4.5.4.4. Market size and forecast, by TRAVELER
7.5. LAMEA
7.5.1. Key trends and opportunities
7.5.2. Market size and forecast, by INDUSTRY
7.5.3. Market size and forecast, by SERVICE
7.5.3.1. LAMEA Transportation Business Travel Market by Sub Type
7.5.4. Market size and forecast, by TRAVELER
7.5.5. Market size and forecast, by country
7.5.5.1. Brazil
7.5.5.1.1. Key market trends, growth factors and opportunities
7.5.5.1.2. Market size and forecast, by INDUSTRY
7.5.5.1.3. Market size and forecast, by SERVICE
7.5.5.1.3.1. Brazil Transportation Business Travel Market by Sub Type
7.5.5.1.4. Market size and forecast, by TRAVELER
7.5.5.2. Turkey
7.5.5.2.1. Key market trends, growth factors and opportunities
7.5.5.2.2. Market size and forecast, by INDUSTRY
7.5.5.2.3. Market size and forecast, by SERVICE
7.5.5.2.3.1. Turkey Transportation Business Travel Market by Sub Type
7.5.5.2.4. Market size and forecast, by TRAVELER
7.5.5.3. South Africa
7.5.5.3.1. Key market trends, growth factors and opportunities
7.5.5.3.2. Market size and forecast, by INDUSTRY
7.5.5.3.3. Market size and forecast, by SERVICE
7.5.5.3.3.1. South Africa Transportation Business Travel Market by Sub Type
7.5.5.3.4. Market size and forecast, by TRAVELER
7.5.5.4. Saudi Arabia
7.5.5.4.1. Key market trends, growth factors and opportunities
7.5.5.4.2. Market size and forecast, by INDUSTRY
7.5.5.4.3. Market size and forecast, by SERVICE
7.5.5.4.3.1. Saudi Arabia Transportation Business Travel Market by Sub Type
7.5.5.4.4. Market size and forecast, by TRAVELER
7.5.5.5. Rest of LAMEA
7.5.5.5.1. Key market trends, growth factors and opportunities
7.5.5.5.2. Market size and forecast, by INDUSTRY
7.5.5.5.3. Market size and forecast, by SERVICE
7.5.5.5.3.1. Rest of LAMEA Transportation Business Travel Market by Sub Type
7.5.5.5.4. Market size and forecast, by TRAVELER
Chapter 8 : COMPETITIVE LANDSCAPE
8.1. Introduction
8.2. Top winning strategies
8.3. Product Mapping of Top 10 Player
8.4. Competitive Dashboard
8.5. Competitive Heatmap
8.6. Top player positioning, 2021
Chapter 9 : COMPANY PROFILES
9.1. BCD Group
9.1.1. Company overview
9.1.2. Key Executives
9.1.3. Company snapshot
9.1.4. Operating business segments
9.1.5. Product portfolio
9.1.6. Key strategic moves and developments
9.2. CWT Global B.V.
9.2.1. Company overview
9.2.2. Key Executives
9.2.3. Company snapshot
9.2.4. Operating business segments
9.2.5. Product portfolio
9.2.6. Key strategic moves and developments
9.3. American Express Global Business Travel
9.3.1. Company overview
9.3.2. Key Executives
9.3.3. Company snapshot
9.3.4. Operating business segments
9.3.5. Product portfolio
9.3.6. Business performance
9.3.7. Key strategic moves and developments
9.4. Chase
9.4.1. Company overview
9.4.2. Key Executives
9.4.3. Company snapshot
9.4.4. Operating business segments
9.4.5. Product portfolio
9.5. Corporate Travel Management Limited
9.5.1. Company overview
9.5.2. Key Executives
9.5.3. Company snapshot
9.5.4. Operating business segments
9.5.5. Product portfolio
9.5.6. Business performance
9.5.7. Key strategic moves and developments
9.6. Flight Centre Travel Group Limited
9.6.1. Company overview
9.6.2. Key Executives
9.6.3. Company snapshot
9.6.4. Operating business segments
9.6.5. Product portfolio
9.6.6. Business performance
9.6.7. Key strategic moves and developments
9.7. Navan, Inc.
9.7.1. Company overview
9.7.2. Key Executives
9.7.3. Company snapshot
9.7.4. Operating business segments
9.7.5. Product portfolio
9.7.6. Key strategic moves and developments
9.8. TravelPerk S.L.U
9.8.1. Company overview
9.8.2. Key Executives
9.8.3. Company snapshot
9.8.4. Operating business segments
9.8.5. Product portfolio
9.9. Citibank, N.A.
9.9.1. Company overview
9.9.2. Key Executives
9.9.3. Company snapshot
9.9.4. Operating business segments
9.9.5. Product portfolio
9.9.6. Key strategic moves and developments
9.10. American Express Company
9.10.1. Company overview
9.10.2. Key Executives
9.10.3. Company snapshot
9.10.4. Operating business segments
9.10.5. Product portfolio
9.10.6. Business performance
9.10.7. Key strategic moves and developments
LIST OF TABLES
TABLE 01. GLOBAL BUSINESS TRAVEL MARKET, BY INDUSTRY, 2021-2031 ($BILLION)
TABLE 02. BUSINESS TRAVEL MARKET FOR GOVERNMENT, BY REGION, 2021-2031 ($BILLION)
TABLE 03. BUSINESS TRAVEL MARKET FOR CORPORATE, BY REGION, 2021-2031 ($BILLION)
TABLE 04. GLOBAL BUSINESS TRAVEL MARKET, BY SERVICE, 2021-2031 ($BILLION)
TABLE 05. BUSINESS TRAVEL MARKET FOR TRANSPORTATION, BY REGION, 2021-2031 ($BILLION)
TABLE 06. GLOBAL TRANSPORTATION BUSINESS TRAVEL MARKET, BY SUB TYPE, 2021-2031 ($BILLION)
TABLE 07. BUSINESS TRAVEL MARKET FOR AIR, BY REGION, 2021-2031 ($BILLION)
TABLE 08. BUSINESS TRAVEL MARKET FOR RAIL, BY REGION, 2021-2031 ($BILLION)
TABLE 09. BUSINESS TRAVEL MARKET FOR CAR, BY REGION, 2021-2031 ($BILLION)
TABLE 10. BUSINESS TRAVEL MARKET FOR FOOD AND LODGING, BY REGION, 2021-2031 ($BILLION)
TABLE 11. BUSINESS TRAVEL MARKET FOR RECREATION, BY REGION, 2021-2031 ($BILLION)
TABLE 12. GLOBAL BUSINESS TRAVEL MARKET, BY TRAVELER, 2021-2031 ($BILLION)
TABLE 13. BUSINESS TRAVEL MARKET FOR GROUP, BY REGION, 2021-2031 ($BILLION)
TABLE 14. BUSINESS TRAVEL MARKET FOR SOLO, BY REGION, 2021-2031 ($BILLION)
TABLE 15. BUSINESS TRAVEL MARKET, BY REGION, 2021-2031 ($BILLION)
TABLE 16. NORTH AMERICA BUSINESS TRAVEL MARKET, BY INDUSTRY, 2021-2031 ($BILLION)
TABLE 17. NORTH AMERICA BUSINESS TRAVEL MARKET, BY SERVICE, 2021-2031 ($BILLION)
TABLE 18. NORTH AMERICA TRANSPORTATION BUSINESS TRAVEL MARKET, BY SUB TYPE, 2021-2031 ($BILLION)
TABLE 19. NORTH AMERICA BUSINESS TRAVEL MARKET, BY TRAVELER, 2021-2031 ($BILLION)
TABLE 20. NORTH AMERICA BUSINESS TRAVEL MARKET, BY COUNTRY, 2021-2031 ($BILLION)
TABLE 21. U.S. BUSINESS TRAVEL MARKET, BY INDUSTRY, 2021-2031 ($BILLION)
TABLE 22. U.S. BUSINESS TRAVEL MARKET, BY SERVICE, 2021-2031 ($BILLION)
TABLE 23. U.S. TRANSPORTATION BUSINESS TRAVEL MARKET, BY SUB TYPE, 2021-2031 ($BILLION)
TABLE 24. U.S. BUSINESS TRAVEL MARKET, BY TRAVELER, 2021-2031 ($BILLION)
TABLE 25. CANADA BUSINESS TRAVEL MARKET, BY INDUSTRY, 2021-2031 ($BILLION)
TABLE 26. CANADA BUSINESS TRAVEL MARKET, BY SERVICE, 2021-2031 ($BILLION)
TABLE 27. CANADA TRANSPORTATION BUSINESS TRAVEL MARKET, BY SUB TYPE, 2021-2031 ($BILLION)
TABLE 28. CANADA BUSINESS TRAVEL MARKET, BY TRAVELER, 2021-2031 ($BILLION)
TABLE 29. MEXICO BUSINESS TRAVEL MARKET, BY INDUSTRY, 2021-2031 ($BILLION)
TABLE 30. MEXICO BUSINESS TRAVEL MARKET, BY SERVICE, 2021-2031 ($BILLION)
TABLE 31. MEXICO TRANSPORTATION BUSINESS TRAVEL MARKET, BY SUB TYPE, 2021-2031 ($BILLION)
TABLE 32. MEXICO BUSINESS TRAVEL MARKET, BY TRAVELER, 2021-2031 ($BILLION)
TABLE 33. EUROPE BUSINESS TRAVEL MARKET, BY INDUSTRY, 2021-2031 ($BILLION)
TABLE 34. EUROPE BUSINESS TRAVEL MARKET, BY SERVICE, 2021-2031 ($BILLION)
TABLE 35. EUROPE TRANSPORTATION BUSINESS TRAVEL MARKET, BY SUB TYPE, 2021-2031 ($BILLION)
TABLE 36. EUROPE BUSINESS TRAVEL MARKET, BY TRAVELER, 2021-2031 ($BILLION)
TABLE 37. EUROPE BUSINESS TRAVEL MARKET, BY COUNTRY, 2021-2031 ($BILLION)
TABLE 38. GERMANY BUSINESS TRAVEL MARKET, BY INDUSTRY, 2021-2031 ($BILLION)
TABLE 39. GERMANY BUSINESS TRAVEL MARKET, BY SERVICE, 2021-2031 ($BILLION)
TABLE 40. GERMANY TRANSPORTATION BUSINESS TRAVEL MARKET, BY SUB TYPE, 2021-2031 ($BILLION)
TABLE 41. GERMANY BUSINESS TRAVEL MARKET, BY TRAVELER, 2021-2031 ($BILLION)
TABLE 42. FRANCE BUSINESS TRAVEL MARKET, BY INDUSTRY, 2021-2031 ($BILLION)
TABLE 43. FRANCE BUSINESS TRAVEL MARKET, BY SERVICE, 2021-2031 ($BILLION)
TABLE 44. FRANCE TRANSPORTATION BUSINESS TRAVEL MARKET, BY SUB TYPE, 2021-2031 ($BILLION)
TABLE 45. FRANCE BUSINESS TRAVEL MARKET, BY TRAVELER, 2021-2031 ($BILLION)
TABLE 46. SPAIN BUSINESS TRAVEL MARKET, BY INDUSTRY, 2021-2031 ($BILLION)
TABLE 47. SPAIN BUSINESS TRAVEL MARKET, BY SERVICE, 2021-2031 ($BILLION)
TABLE 48. SPAIN TRANSPORTATION BUSINESS TRAVEL MARKET, BY SUB TYPE, 2021-2031 ($BILLION)
TABLE 49. SPAIN BUSINESS TRAVEL MARKET, BY TRAVELER, 2021-2031 ($BILLION)
TABLE 50. ITALY BUSINESS TRAVEL MARKET, BY INDUSTRY, 2021-2031 ($BILLION)
TABLE 51. ITALY BUSINESS TRAVEL MARKET, BY SERVICE, 2021-2031 ($BILLION)
TABLE 52. ITALY TRANSPORTATION BUSINESS TRAVEL MARKET, BY SUB TYPE, 2021-2031 ($BILLION)
TABLE 53. ITALY BUSINESS TRAVEL MARKET, BY TRAVELER, 2021-2031 ($BILLION)
TABLE 54. SWEDEN BUSINESS TRAVEL MARKET, BY INDUSTRY, 2021-2031 ($BILLION)
TABLE 55. SWEDEN BUSINESS TRAVEL MARKET, BY SERVICE, 2021-2031 ($BILLION)
TABLE 56. SWEDEN TRANSPORTATION BUSINESS TRAVEL MARKET, BY SUB TYPE, 2021-2031 ($BILLION)
TABLE 57. SWEDEN BUSINESS TRAVEL MARKET, BY TRAVELER, 2021-2031 ($BILLION)
TABLE 58. GREECE BUSINESS TRAVEL MARKET, BY INDUSTRY, 2021-2031 ($BILLION)
TABLE 59. GREECE BUSINESS TRAVEL MARKET, BY SERVICE, 2021-2031 ($BILLION)
TABLE 60. GREECE TRANSPORTATION BUSINESS TRAVEL MARKET, BY SUB TYPE, 2021-2031 ($BILLION)
TABLE 61. GREECE BUSINESS TRAVEL MARKET, BY TRAVELER, 2021-2031 ($BILLION)
TABLE 62. REST OF EUROPE BUSINESS TRAVEL MARKET, BY INDUSTRY, 2021-2031 ($BILLION)
TABLE 63. REST OF EUROPE BUSINESS TRAVEL MARKET, BY SERVICE, 2021-2031 ($BILLION)
TABLE 64. REST OF EUROPE TRANSPORTATION BUSINESS TRAVEL MARKET, BY SUB TYPE, 2021-2031 ($BILLION)
TABLE 65. REST OF EUROPE BUSINESS TRAVEL MARKET, BY TRAVELER, 2021-2031 ($BILLION)
TABLE 66. ASIA-PACIFIC BUSINESS TRAVEL MARKET, BY INDUSTRY, 2021-2031 ($BILLION)
TABLE 67. ASIA-PACIFIC BUSINESS TRAVEL MARKET, BY SERVICE, 2021-2031 ($BILLION)
TABLE 68. ASIA-PACIFIC TRANSPORTATION BUSINESS TRAVEL MARKET, BY SUB TYPE, 2021-2031 ($BILLION)
TABLE 69. ASIA-PACIFIC BUSINESS TRAVEL MARKET, BY TRAVELER, 2021-2031 ($BILLION)
TABLE 70. ASIA-PACIFIC BUSINESS TRAVEL MARKET, BY COUNTRY, 2021-2031 ($BILLION)
TABLE 71. CHINA BUSINESS TRAVEL MARKET, BY INDUSTRY, 2021-2031 ($BILLION)
TABLE 72. CHINA BUSINESS TRAVEL MARKET, BY SERVICE, 2021-2031 ($BILLION)
TABLE 73. CHINA TRANSPORTATION BUSINESS TRAVEL MARKET, BY SUB TYPE, 2021-2031 ($BILLION)
TABLE 74. CHINA BUSINESS TRAVEL MARKET, BY TRAVELER, 2021-2031 ($BILLION)
TABLE 75. JAPAN BUSINESS TRAVEL MARKET, BY INDUSTRY, 2021-2031 ($BILLION)
TABLE 76. JAPAN BUSINESS TRAVEL MARKET, BY SERVICE, 2021-2031 ($BILLION)
TABLE 77. JAPAN TRANSPORTATION BUSINESS TRAVEL MARKET, BY SUB TYPE, 2021-2031 ($BILLION)
TABLE 78. JAPAN BUSINESS TRAVEL MARKET, BY TRAVELER, 2021-2031 ($BILLION)
TABLE 79. INDIA BUSINESS TRAVEL MARKET, BY INDUSTRY, 2021-2031 ($BILLION)
TABLE 80. INDIA BUSINESS TRAVEL MARKET, BY SERVICE, 2021-2031 ($BILLION)
TABLE 81. INDIA TRANSPORTATION BUSINESS TRAVEL MARKET, BY SUB TYPE, 2021-2031 ($BILLION)
TABLE 82. INDIA BUSINESS TRAVEL MARKET, BY TRAVELER, 2021-2031 ($BILLION)
TABLE 83. REST OF ASIA-PACIFIC BUSINESS TRAVEL MARKET, BY INDUSTRY, 2021-2031 ($BILLION)
TABLE 84. REST OF ASIA-PACIFIC BUSINESS TRAVEL MARKET, BY SERVICE, 2021-2031 ($BILLION)
TABLE 85. REST OF ASIA-PACIFIC TRANSPORTATION BUSINESS TRAVEL MARKET, BY SUB TYPE, 2021-2031 ($BILLION)
TABLE 86. REST OF ASIA-PACIFIC BUSINESS TRAVEL MARKET, BY TRAVELER, 2021-2031 ($BILLION)
TABLE 87. LAMEA BUSINESS TRAVEL MARKET, BY INDUSTRY, 2021-2031 ($BILLION)
TABLE 88. LAMEA BUSINESS TRAVEL MARKET, BY SERVICE, 2021-2031 ($BILLION)
TABLE 89. LAMEA TRANSPORTATION BUSINESS TRAVEL MARKET, BY SUB TYPE, 2021-2031 ($BILLION)
TABLE 90. LAMEA BUSINESS TRAVEL MARKET, BY TRAVELER, 2021-2031 ($BILLION)
TABLE 91. LAMEA BUSINESS TRAVEL MARKET, BY COUNTRY, 2021-2031 ($BILLION)
TABLE 92. BRAZIL BUSINESS TRAVEL MARKET, BY INDUSTRY, 2021-2031 ($BILLION)
TABLE 93. BRAZIL BUSINESS TRAVEL MARKET, BY SERVICE, 2021-2031 ($BILLION)
TABLE 94. BRAZIL TRANSPORTATION BUSINESS TRAVEL MARKET, BY SUB TYPE, 2021-2031 ($BILLION)
TABLE 95. BRAZIL BUSINESS TRAVEL MARKET, BY TRAVELER, 2021-2031 ($BILLION)
TABLE 96. TURKEY BUSINESS TRAVEL MARKET, BY INDUSTRY, 2021-2031 ($BILLION)
TABLE 97. TURKEY BUSINESS TRAVEL MARKET, BY SERVICE, 2021-2031 ($BILLION)
TABLE 98. TURKEY TRANSPORTATION BUSINESS TRAVEL MARKET, BY SUB TYPE, 2021-2031 ($BILLION)
TABLE 99. TURKEY BUSINESS TRAVEL MARKET, BY TRAVELER, 2021-2031 ($BILLION)
TABLE 100. SOUTH AFRICA BUSINESS TRAVEL MARKET, BY INDUSTRY, 2021-2031 ($BILLION)
TABLE 101. SOUTH AFRICA BUSINESS TRAVEL MARKET, BY SERVICE, 2021-2031 ($BILLION)
TABLE 102. SOUTH AFRICA TRANSPORTATION BUSINESS TRAVEL MARKET, BY SUB TYPE, 2021-2031 ($BILLION)
TABLE 103. SOUTH AFRICA BUSINESS TRAVEL MARKET, BY TRAVELER, 2021-2031 ($BILLION)
TABLE 104. SAUDI ARABIA BUSINESS TRAVEL MARKET, BY INDUSTRY, 2021-2031 ($BILLION)
TABLE 105. SAUDI ARABIA BUSINESS TRAVEL MARKET, BY SERVICE, 2021-2031 ($BILLION)
TABLE 106. SAUDI ARABIA TRANSPORTATION BUSINESS TRAVEL MARKET, BY SUB TYPE, 2021-2031 ($BILLION)
TABLE 107. SAUDI ARABIA BUSINESS TRAVEL MARKET, BY TRAVELER, 2021-2031 ($BILLION)
TABLE 108. REST OF LAMEA BUSINESS TRAVEL MARKET, BY INDUSTRY, 2021-2031 ($BILLION)
TABLE 109. REST OF LAMEA BUSINESS TRAVEL MARKET, BY SERVICE, 2021-2031 ($BILLION)
TABLE 110. REST OF LAMEA TRANSPORTATION BUSINESS TRAVEL MARKET, BY SUB TYPE, 2021-2031 ($BILLION)
TABLE 111. REST OF LAMEA BUSINESS TRAVEL MARKET, BY TRAVELER, 2021-2031 ($BILLION)
TABLE 112. BCD GROUP: KEY EXECUTIVES
TABLE 113. BCD GROUP: COMPANY SNAPSHOT
TABLE 114. BCD GROUP: SERVICE SEGMENTS
TABLE 115. BCD GROUP: PRODUCT PORTFOLIO
TABLE 116. BCD GROUP: KEY STRATERGIES
TABLE 117. CWT GLOBAL B.V.: KEY EXECUTIVES
TABLE 118. CWT GLOBAL B.V.: COMPANY SNAPSHOT
TABLE 119. CWT GLOBAL B.V.: SERVICE SEGMENTS
TABLE 120. CWT GLOBAL B.V.: PRODUCT PORTFOLIO
TABLE 121. CWT GLOBAL B.V.: KEY STRATERGIES
TABLE 122. AMERICAN EXPRESS GLOBAL BUSINESS TRAVEL: KEY EXECUTIVES
TABLE 123. AMERICAN EXPRESS GLOBAL BUSINESS TRAVEL: COMPANY SNAPSHOT
TABLE 124. AMERICAN EXPRESS GLOBAL BUSINESS TRAVEL: SERVICE SEGMENTS
TABLE 125. AMERICAN EXPRESS GLOBAL BUSINESS TRAVEL: PRODUCT PORTFOLIO
TABLE 126. AMERICAN EXPRESS GLOBAL BUSINESS TRAVEL: KEY STRATERGIES
TABLE 127. CHASE: KEY EXECUTIVES
TABLE 128. CHASE: COMPANY SNAPSHOT
TABLE 129. CHASE: SERVICE SEGMENTS
TABLE 130. CHASE: PRODUCT PORTFOLIO
TABLE 131. CORPORATE TRAVEL MANAGEMENT LIMITED: KEY EXECUTIVES
TABLE 132. CORPORATE TRAVEL MANAGEMENT LIMITED: COMPANY SNAPSHOT
TABLE 133. CORPORATE TRAVEL MANAGEMENT LIMITED: SERVICE SEGMENTS
TABLE 134. CORPORATE TRAVEL MANAGEMENT LIMITED: PRODUCT PORTFOLIO
TABLE 135. CORPORATE TRAVEL MANAGEMENT LIMITED: KEY STRATERGIES
TABLE 136. FLIGHT CENTRE TRAVEL GROUP LIMITED: KEY EXECUTIVES
TABLE 137. FLIGHT CENTRE TRAVEL GROUP LIMITED: COMPANY SNAPSHOT
TABLE 138. FLIGHT CENTRE TRAVEL GROUP LIMITED: SERVICE SEGMENTS
TABLE 139. FLIGHT CENTRE TRAVEL GROUP LIMITED: PRODUCT PORTFOLIO
TABLE 140. FLIGHT CENTRE TRAVEL GROUP LIMITED: KEY STRATERGIES
TABLE 141. NAVAN, INC.: KEY EXECUTIVES
TABLE 142. NAVAN, INC.: COMPANY SNAPSHOT
TABLE 143. NAVAN, INC.: SERVICE SEGMENTS
TABLE 144. NAVAN, INC.: PRODUCT PORTFOLIO
TABLE 145. NAVAN, INC.: KEY STRATERGIES
TABLE 146. TRAVELPERK S.L.U: KEY EXECUTIVES
TABLE 147. TRAVELPERK S.L.U: COMPANY SNAPSHOT
TABLE 148. TRAVELPERK S.L.U: SERVICE SEGMENTS
TABLE 149. TRAVELPERK S.L.U: PRODUCT PORTFOLIO
TABLE 150. CITIBANK, N.A.: KEY EXECUTIVES
TABLE 151. CITIBANK, N.A.: COMPANY SNAPSHOT
TABLE 152. CITIBANK, N.A.: SERVICE SEGMENTS
TABLE 153. CITIBANK, N.A.: PRODUCT PORTFOLIO
TABLE 154. CITIBANK, N.A.: KEY STRATERGIES
TABLE 155. AMERICAN EXPRESS COMPANY: KEY EXECUTIVES
TABLE 156. AMERICAN EXPRESS COMPANY: COMPANY SNAPSHOT
TABLE 157. AMERICAN EXPRESS COMPANY: SERVICE SEGMENTS
TABLE 158. AMERICAN EXPRESS COMPANY: PRODUCT PORTFOLIO
TABLE 159. AMERICAN EXPRESS COMPANY: KEY STRATERGIES
LIST OF FIGURES
FIGURE 01. BUSINESS TRAVEL MARKET, 2021-2031
FIGURE 02. SEGMENTATION OF BUSINESS TRAVEL MARKET, 2021-2031
FIGURE 03. TOP INVESTMENT POCKETS IN BUSINESS TRAVEL MARKET (2022-2031)
FIGURE 04. MODERATE BARGAINING POWER OF SUPPLIERS
FIGURE 05. MODERATE BARGAINING POWER OF BUYERS
FIGURE 06. MODERATE THREAT OF SUBSTITUTES
FIGURE 07. MODERATE THREAT OF NEW ENTRANTS
FIGURE 08. HIGH INTENSITY OF RIVALRY
FIGURE 09. DRIVERS, RESTRAINTS AND OPPORTUNITIES: GLOBALBUSINESS TRAVEL MARKET
FIGURE 10. BUSINESS TRAVEL MARKET, BY INDUSTRY, 2021(%)
FIGURE 11. COMPARATIVE SHARE ANALYSIS OF BUSINESS TRAVEL MARKET FOR GOVERNMENT, BY COUNTRY 2021 AND 2031(%)
FIGURE 12. COMPARATIVE SHARE ANALYSIS OF BUSINESS TRAVEL MARKET FOR CORPORATE, BY COUNTRY 2021 AND 2031(%)
FIGURE 13. BUSINESS TRAVEL MARKET, BY SERVICE, 2021(%)
FIGURE 14. COMPARATIVE SHARE ANALYSIS OF BUSINESS TRAVEL MARKET FOR TRANSPORTATION, BY COUNTRY 2021 AND 2031(%)
FIGURE 15. COMPARATIVE SHARE ANALYSIS OF BUSINESS TRAVEL MARKET FOR FOOD AND LODGING, BY COUNTRY 2021 AND 2031(%)
FIGURE 16. COMPARATIVE SHARE ANALYSIS OF BUSINESS TRAVEL MARKET FOR RECREATION, BY COUNTRY 2021 AND 2031(%)
FIGURE 17. BUSINESS TRAVEL MARKET, BY TRAVELER, 2021(%)
FIGURE 18. COMPARATIVE SHARE ANALYSIS OF BUSINESS TRAVEL MARKET FOR GROUP, BY COUNTRY 2021 AND 2031(%)
FIGURE 19. COMPARATIVE SHARE ANALYSIS OF BUSINESS TRAVEL MARKET FOR SOLO, BY COUNTRY 2021 AND 2031(%)
FIGURE 20. BUSINESS TRAVEL MARKET BY REGION, 2021
FIGURE 21. U.S. BUSINESS TRAVEL MARKET, 2021-2031 ($BILLION)
FIGURE 22. CANADA BUSINESS TRAVEL MARKET, 2021-2031 ($BILLION)
FIGURE 23. MEXICO BUSINESS TRAVEL MARKET, 2021-2031 ($BILLION)
FIGURE 24. GERMANY BUSINESS TRAVEL MARKET, 2021-2031 ($BILLION)
FIGURE 25. FRANCE BUSINESS TRAVEL MARKET, 2021-2031 ($BILLION)
FIGURE 26. SPAIN BUSINESS TRAVEL MARKET, 2021-2031 ($BILLION)
FIGURE 27. ITALY BUSINESS TRAVEL MARKET, 2021-2031 ($BILLION)
FIGURE 28. SWEDEN BUSINESS TRAVEL MARKET, 2021-2031 ($BILLION)
FIGURE 29. GREECE BUSINESS TRAVEL MARKET, 2021-2031 ($BILLION)
FIGURE 30. REST OF EUROPE BUSINESS TRAVEL MARKET, 2021-2031 ($BILLION)
FIGURE 31. CHINA BUSINESS TRAVEL MARKET, 2021-2031 ($BILLION)
FIGURE 32. JAPAN BUSINESS TRAVEL MARKET, 2021-2031 ($BILLION)
FIGURE 33. INDIA BUSINESS TRAVEL MARKET, 2021-2031 ($BILLION)
FIGURE 34. REST OF ASIA-PACIFIC BUSINESS TRAVEL MARKET, 2021-2031 ($BILLION)
FIGURE 35. BRAZIL BUSINESS TRAVEL MARKET, 2021-2031 ($BILLION)
FIGURE 36. TURKEY BUSINESS TRAVEL MARKET, 2021-2031 ($BILLION)
FIGURE 37. SOUTH AFRICA BUSINESS TRAVEL MARKET, 2021-2031 ($BILLION)
FIGURE 38. SAUDI ARABIA BUSINESS TRAVEL MARKET, 2021-2031 ($BILLION)
FIGURE 39. REST OF LAMEA BUSINESS TRAVEL MARKET, 2021-2031 ($BILLION)
FIGURE 40. TOP WINNING STRATEGIES, BY YEAR
FIGURE 41. TOP WINNING STRATEGIES, BY DEVELOPMENT
FIGURE 42. TOP WINNING STRATEGIES, BY COMPANY
FIGURE 43. PRODUCT MAPPING OF TOP 10 PLAYERS
FIGURE 44. COMPETITIVE DASHBOARD
FIGURE 45. COMPETITIVE HEATMAP: BUSINESS TRAVEL MARKET
FIGURE 46. TOP PLAYER POSITIONING, 2021
FIGURE 47. AMERICAN EXPRESS GLOBAL BUSINESS TRAVEL: NET REVENUE, 2019-2021 ($MILLION)
FIGURE 48. AMERICAN EXPRESS GLOBAL BUSINESS TRAVEL: RESEARCH & DEVELOPMENT EXPENDITURE, 2019-2021 ($MILLION)
FIGURE 49. CORPORATE TRAVEL MANAGEMENT LIMITED: NET REVENUE, 2020-2022 ($MILLION)
FIGURE 50. CORPORATE TRAVEL MANAGEMENT LIMITED: REVENUE SHARE BY SEGMENT, 2022 (%)
FIGURE 51. FLIGHT CENTRE TRAVEL GROUP LIMITED: NET REVENUE, 2020-2022 ($MILLION)
FIGURE 52. FLIGHT CENTRE TRAVEL GROUP LIMITED: REVENUE SHARE BY SEGMENT, 2022 (%)
FIGURE 53. FLIGHT CENTRE TRAVEL GROUP LIMITED: REVENUE SHARE BY REGION, 2022 (%)
FIGURE 54. AMERICAN EXPRESS COMPANY: NET REVENUE, 2019-2021 ($MILLION)
FIGURE 55. AMERICAN EXPRESS COMPANY: REVENUE SHARE BY SEGMENT, 2021 (%)
FIGURE 56. AMERICAN EXPRESS COMPANY: REVENUE SHARE BY REGION, 2021 (%)

