

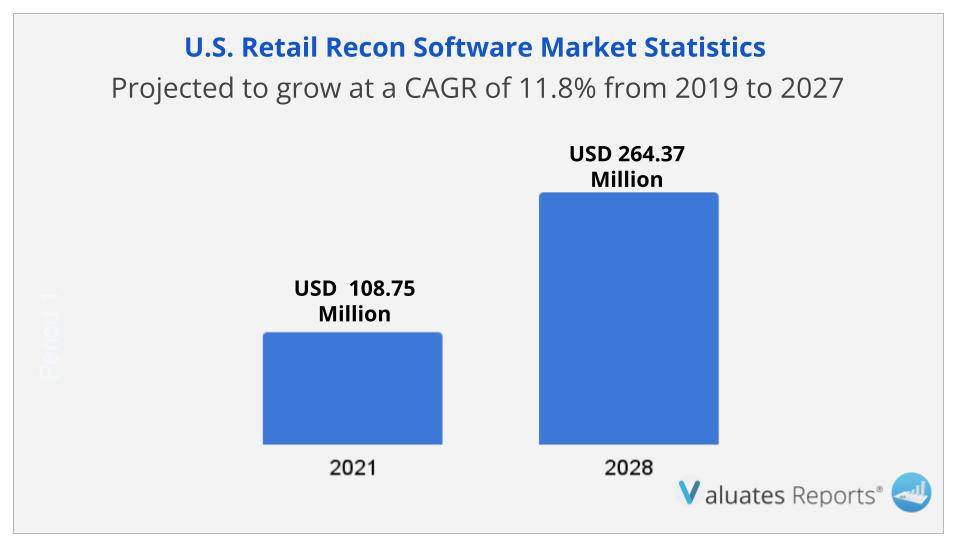
The U.S. retail recon software market size was valued at $108.75 million in 2019, and is projected to reach $264.37million by 2027, growing at a CAGR of 11.8% from 2020 to 2027.
Reconciliation software consists of a process of verifying and comparing internal records of transaction history with external resources such as bank records. This process ensures that the money leaving an account matches the amount spent at the end of each recording period. The key objective of reconciliation software is to enhance the productivity of the retailers and to produce better outcomes.
A surge in online transactions in the retail industry and rise in need for reconciliation management system drive the growth of the market. In addition, substantial saving for retailers with high volume bank reconciliation needs fuels the growth of the market. However, various security issues in reconciliation software hampers the growth of the market. Furthermore, higher adoption of recon software among the small & medium retailers (SMRs) and surge in usage of machine learning and artificial intelligence in recon software are expected to provide lucrative opportunities for the growth of the market.
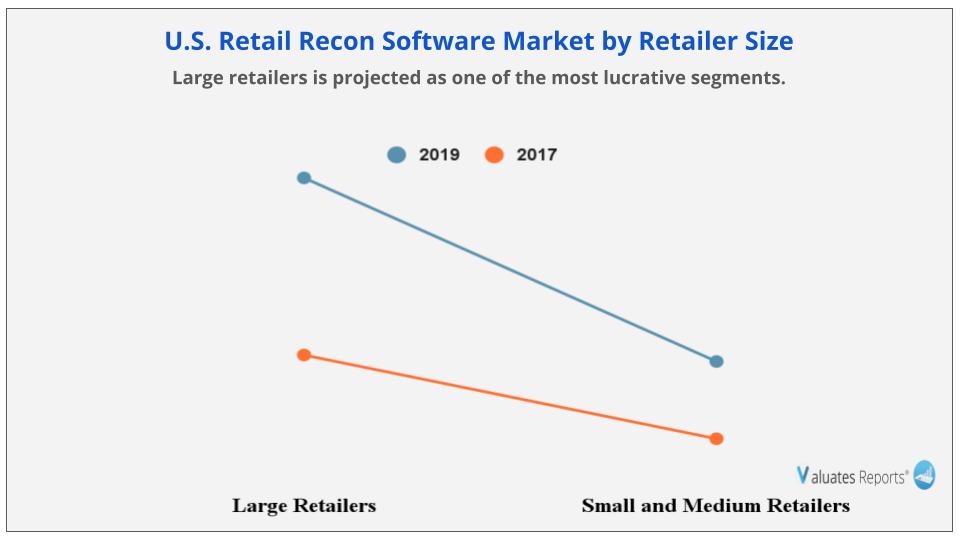
The large retailer segment is expected to garner a significant share during the forecast period. Increase in need to manage huge number of customers along with rise in awareness of security events drives the growth of the recon software among large retailer. However, the SMRs segment is expected to grow at the highest rate during the forecast period, owing to rapid adoption of cloud-based recon software by various SMRs to enhance their operational efficiency and reduce the operating cost.Thisdrives the growth of the market in this segment.
The report focuses on the growth prospects, restraints, and trends of the U.S. retail recon software market. The study provides Porter’s five forces analysis to understand the impact of various factors such as bargaining power of suppliers, competitive intensity of competitors, threat of new entrants, threat of substitutes, and bargaining power of buyers on the U.S. retail recon software market.
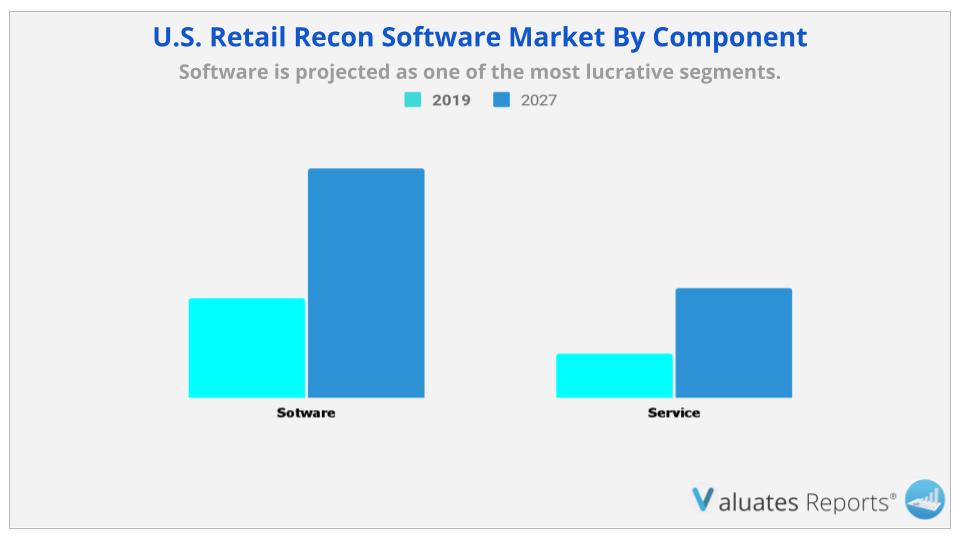
The U.S. retail recon software market is segmented into component, software type, deployment mode, retailer size, and reconciliation type. In terms of component, it is bifurcated into software and services. As per software type, it is divided into transaction matching, consolidation, reporting & analytics, variance analysis, task management and others. By deployment model, it is classified into on-premise and cloud. In terms of retailer size, it is categorized into large retailers and small & medium retailers. As per reconciliation type, it is divided into account reconciliation, bank reconciliation, payment reconciliation, and others.
The key players profiled in the U.S. retail recon software market analysis are AutoRek, Baldwin Hackett & Meeks, Inc., Blackline, Inc., Broadridge Financial Solutions, Inc., Cashbook, Fiserv, Inc., Oracle Corporation, ReconArt, Inc., SAP SE, and SigmaIQ. These players have adopted various strategies to increase their market penetration and strengthen their position in the industry.
Rise in digitization in the retail industry has led to an increase in the demand for reconciliation software. In addition, retail industry has emerged as one of the most agile sectors in the U.S. owing to the surge in urbanization, favorable government policies, and rise in online transactions. Moreover, the U.S. is considered as one of the fastest growing countries in the e-commerce industry. This is a major factor that drives the growth of the market. For instance, according to a survey 2019, the U.S. consumers have spent $589.92 billion on various e-commerce sites. Thus, rise in sales on e-commerce sites have led to an increase in online payments and electronic billings, hence to maintain record of online data, retailers are adopting recon software, which boosts the growth of the market. In addition, different small & medium size retailers are increasing their popularity and market share by providing online products. This surges the need for reconciliation software.
An increase in the adoption of digital and real-time payment systems by the retailers fosters the growth of the recon software market. Rise in online payment has led to huge number of transactions, which need to be managed efficiently by the retailers to increase their market share. Thus, reconciliation software provides an efficient way to manage large number of customer and their transaction volume, which is the major factor that drives the growth of the market. Moreover, increase in need by the retailer to manage various types of bills such as online bill, account bill, and electronic bills fosters the growth of the market. In addition, retailers, with high business volume are adopting reconciliation software to identify internal administrative issues and to reduce employee fraud. This is boosting the growth of the market.
|
Report Metric |
Details |
|
Report Name |
U.S. Retail Recon Software Market |
|
The Market size value in 2019 |
$108.75 Million |
|
The Revenue forecast in 2027 |
$264.37 Million |
|
Growth Rate |
CAGR of 11.8% from 2019 to 2027 |
|
Base year considered |
2019 |
|
Forecast period |
2019 to 2027 |
|
Forecast units |
Value (USD) |
|
Segments covered |
By Component, By Software Type, By Deployment Model, By Retailer Size and By Reconciliation Type |
|
Companies covered |
AUTOREK, BALDWIN HACKETT & MEEKS, INC., BLACKLINE INC., BROADRIDGE FINANCIAL SOLUTIONS, INC., CASHBOOK, FISERV, INC., ORACLE CORPORATION, SAP SE, RECONART, INC., SIGMAIQ |
Ans. The U.S. retail recon software market size was valued at $108.75 million in 2019, and is projected to reach $264.37million by 2027, growing at a CAGR of 11.8% from 2020 to 2027.
2. Who are the key players of the U.S. Retail Recon Software Market ?
Ans. The key players of the U.S. Retail Recon Software Market are AUTOREK, BALDWIN HACKETT & MEEKS, INC., BLACKLINE INC., BROADRIDGE FINANCIAL SOLUTIONS, INC., CASHBOOK, FISERV, INC., ORACLE CORPORATION, SAP SE, RECONART, INC., SIGMAIQ.
3. What is the Growth rate of U.S. Retail Recon Software Market ?
Ans. The U.S. retail recon software market size was valued at $108.75 million in 2019, and is projected to reach $264.37million by 2027, growing at a CAGR of 11.8% from 2020 to 2027.
TABLE OF CONTENT
CHAPTER 1:INTRODUCTION
1.1.Report description
1.2.Key benefits for stakeholders
1.3.Key market segments
1.4.Research methodology
1.4.1.Secondary research
1.4.2.Primary research
1.4.3.Analyst tools & models
CHAPTER 2:EXECUTIVE SUMMARY
2.1.Key findings
2.1.1.Top impacting factors
2.2.CXO perspective
CHAPTER 3:MARKET OVERVIEW
3.1.Market definition and scope
3.2.Key forces shaping U.S. retail recon software market
3.3.Market dynamics
3.3.1.Case Studies
3.3.1.1.Case Study 1
3.3.1.2.Case Study 2
3.3.2.Drivers
3.3.2.1.Growth in online transaction
3.3.2.2.Rise in need for reconciliation management
3.3.2.3.Substantial savings for retailers with high volume bank reconciliation needs
3.3.3.Restraints
3.3.3.1.Different security issues faced by retailers
3.3.4.Opportunities
3.3.4.1.Growth in usage of machine learning and artificial intelligence in recon software
3.3.4.2.Higher adoption among small and medium retailer (SMRs)
3.3.5.Machine Learning and Artificial Intelligence in Reconciliation Software
CHAPTER 4:U.S. RETAIL RECON SOFTWARE MARKET, BY COMPONENT
4.1.Overview
4.2.Software
4.2.1.Key market trends, growth factors, and opportunities
4.2.2.Market size and forecast
4.3.Services
4.3.1.Key market trends, growth factors, and opportunities
4.3.2.Market size and forecast
CHAPTER 5:U.S. RETAIL RECON SOFTWARE MARKET, BY DEPLOYMENT MODE
5.1.Overview
5.2.On-premise
5.2.1.Key market trends, growth factors, and opportunities
5.2.2.Market size and forecast
5.3.Cloud-based
5.3.1.Key market trends, growth factors, and opportunities
5.3.2.Market size and forecast
CHAPTER 6:U.S. RETAIL RECON SOFTWARE MARKET, BY RETAILER SIZE
6.1.Overview
6.2.Large Retailers
6.2.1.Key market trends, growth factors, and opportunities
6.2.2.Market size and forecast
6.3.Small & Medium Retailer (SMRs)
6.3.1.Key market trends, growth factors, and opportunities
6.3.2.Market size and forecast
CHAPTER 7:U.S. RETAIL RECON SOFTWARE MARKET, BY RECONCILIATION TYPE
7.1.Overview
7.2.Account Reconciliation
7.2.1.Key market trends, growth factors, and opportunities
7.2.2.Market size and forecast
7.3.Bank Reconciliation
7.3.1.Key market trends, growth factors, and opportunities
7.3.2.Market size and forecast
7.4.Payment Reconciliation
7.4.1.Key market trends, growth factors, and opportunities
7.4.2.Market size and forecast
7.4.3.Payment reconciliation market size and forecast, by component
7.4.4.Payment reconciliation market size and forecast, by deployment mode
7.4.5.Payment reconciliation market size and forecast, by retailer size
7.5.Others
7.5.1.Key market trends, growth factors, and opportunities
7.5.2.Market size and forecast
CHAPTER 8:U.S. RETAIL RECON SOFTWARE MARKET, BY SOFTWARE TYPE
8.1.Overview
8.2.Transaction Matching
8.2.1.Key market trends, growth factors, and opportunities
8.2.2.Market size and forecast
8.3.Consolidation
8.3.1.Key market trends, growth factors, and opportunities
8.3.2.Market size and forecast
8.4.Reporting & Analytics
8.4.1.Key market trends, growth factors, and opportunities
8.4.2.Market size and forecast
8.5.Task Management
8.5.1.Key market trends, growth factors, and opportunities
8.5.2.Market size and forecast
8.6.Variance Analysis
8.6.1.Key market trends, growth factors, and opportunities
8.6.2.Market size and forecast
8.7.Others
8.7.1.Key market trends, growth factors, and opportunities
8.7.2.Market size and forecast
CHAPTER 9:COMPETITIVE LANDSCAPE
9.1.Top winning strategies
CHAPTER 10:COMPANY PROFILE
10.1.AUTOREK
10.1.1.Company overview
10.1.2.Key executives
10.1.3.Company snapshot
10.1.4.Product portfolio
10.1.5.Key strategic moves and developments
10.2.BALDWIN HACKETT & MEEKS, INC.
10.2.1.Company overview
10.2.2.Key executives
10.2.3.Company snapshot
10.2.4.Product portfolio
10.2.5.Key strategic moves and developments
10.3.BLACKLINE INC.
10.3.1.Company overview
10.3.2.Key executives
10.3.3.Company snapshot
10.3.4.Product portfolio
10.3.5.R&D expenditure
10.3.6.Business performance
10.3.7.Key strategic moves and developments
10.4.BROADRIDGE FINANCIAL SOLUTIONS, INC.
10.4.1.Company overview
10.4.2.Key Executives
10.4.3.Company snapshot
10.4.4.Operating business segments
10.4.5.Product portfolio
10.4.6.Business performance
10.4.7.Key strategic moves and developments
10.5.CASHBOOK
10.5.1.Company overview
10.5.2.Key executives
10.5.3.Company snapshot
10.5.4.Product portfolio
10.5.5.Key strategic moves and developments
10.6.FISERV, INC.
10.6.1.Company overview
10.6.2.Key executives
10.6.3.Company snapshot
10.6.4.Operating business segments
10.6.5.Product portfolio
10.6.6.Business performance
10.7.ORACLE CORPORATION
10.7.1.Company overview
10.7.2.Key Executives
10.7.3.Company snapshot
10.7.4.Operating business segments
10.7.5.Product portfolio
10.7.6.R&D Expenditure
10.7.7.Business performance
10.7.8.Key strategic moves and developments
10.8.SAP SE
10.8.1.Company overview
10.8.2.Key Executives
10.8.3.Company snapshot
10.8.4.Operating business segments
10.8.5.Product portfolio
10.8.6.R&D Expenditure
10.8.7.Business performance
10.8.8.Key strategic moves and developments
10.9.RECONART, INC.
10.9.1.Company overview
10.9.2.Key executives
10.9.3.Company snapshot
10.9.4.Product portfolio
10.9.5.Key strategic moves and developments
10.10.SIGMAIQ
10.10.1.Company overview
10.10.2.Key executives
10.10.3.Company snapshot
10.10.4.Product portfolio
LIST OF TABLES & FIGURES
TABLE 01.U.S. RETAIL RECON SOFTWARE MARKET REVENUE, BY COMPONENT, 2019–2027 ($MILLION)
TABLE 02.U.S. RETAIL RECON SOFTWARE MARKET REVENUE FOR SOFTWARE, 2019–2027 ($MILLION)
TABLE 03.U.S. RETAIL RECON SOFTWARE MARKET REVENUE FOR SERVICE, 2019–2027 ($MILLION)
TABLE 04.U.S. RETAIL RECON SOFTWARE MARKET SOFTWARE REVENUE, BY DEPLOYMENT MODE, 2019–2027 ($MILLION)
TABLE 05.U.S. RETAIL RECON SOFTWARE MARKET REVENUE FOR ON-PREMISE, 2019–2027 ($MILLION)
TABLE 06.U.S. RETAIL RECON SOFTWARE MARKET REVENUE FOR CLOUD, 2019–2027 ($MILLION)
TABLE 07.U.S. RETAIL RECON SOFTWARE MARKET REVENUE, BY RETAILER SIZE, 2019–2027 ($MILLION)
TABLE 08.U.S. RETAIL RECON SOFTWARE MARKET REVENUE FOR LARGE RETAILERS, 2019–2027 ($MILLION)
TABLE 09.U.S. RETAIL RECON SOFTWARE MARKET REVENUE FOR SMRS, 2019–2027 ($MILLION)
TABLE 10.U.S. RETAIL RECON SOFTWARE MARKET REVENUE, RECONCILIATION TYPE, 2019–2027 ($MILLION)
TABLE 11.U.S. RETAIL RECON SOFTWARE MARKET REVENUE FOR ACCOUNT RECONCILIATION, 2019–2027 ($MILLION)
TABLE 12.U.S. RETAIL RECON SOFTWARE MARKET REVENUE FOR BANK RECONCILIATION, 2019–2027 ($MILLION)
TABLE 13.U.S. RETAIL RECON SOFTWARE MARKET REVENUE FOR PAYMENT RECONCILIATION, 2019–2027 ($MILLION)
TABLE 14.U.S. RETAIL RECON SOFTWARE MARKET REVENUE FOR PAYMENT RECONCILIATION, BY COMPONENT, 2019–2027 ($MILLION)
TABLE 15.U.S. RETAIL RECON SOFTWARE MARKET REVENUE FOR PAYMENT RECONCILIATION, BY DEPLOYMENT MODE, 2019–2027 ($MILLION)
TABLE 16.U.S. RETAIL RECON SOFTWARE MARKET REVENUE FOR PAYMENT RECONCILIATION, BY RETAILER SIZE, 2019–2027 ($MILLION)
TABLE 17.U.S. RETAIL RECON SOFTWARE MARKET REVENUE FOR OTHERS, 2019–2027 ($MILLION)
TABLE 18.U.S. RETAIL RECON SOFTWARE MARKET REVENUE, BY SOFTWARE TYPE, 2019–2027 ($MILLION)
TABLE 19.U.S. RETAIL RECON SOFTWARE MARKET REVENUE FOR TRANSACTION MATCHING, 2019–2027 ($MILLION)
TABLE 20.U.S. RETAIL RECON SOFTWARE MARKET REVENUE FOR CONSOLIDATION, 2019–2027 ($MILLION)
TABLE 21.U.S. RETAIL RECON SOFTWARE MARKET REVENUE FOR REPORTING & ANALYTICS, 2019–2027 ($MILLION)
TABLE 22.U.S. RETAIL RECON SOFTWARE MARKET REVENUE FOR TASK MANAGEMENT, 2019–2027 ($MILLION)
TABLE 23.U.S. RETAIL RECON SOFTWARE MARKET REVENUE FOR VARIANCE ANALYSIS, 2019–2027 ($MILLION)
TABLE 24.U.S. RETAIL RECON SOFTWARE MARKET REVENUE FOR OTHERS, 2019–2027 ($MILLION)
TABLE 25.AUTOREK: KEY EXECUTIVES
TABLE 26.AUTOREK: COMPANY SNAPSHOT
TABLE 27.AUTOREK: PRODUCT PORTFOLIO
TABLE 28.BALDWIN HACKETT & MEEKS, INC.: KEY EXECUTIVES
TABLE 29.BALDWIN HACKETT & MEEKS, INC.: COMPANY SNAPSHOT
TABLE 30.BALDWIN HACKETT & MEEKS, INC.: PRODUCT PORTFOLIO
TABLE 31.BLACKLINE INC.: KEY EXECUTIVES
TABLE 32.BLACKLINE INC.: COMPANY SNAPSHOT
TABLE 33.BLACKLINE INC.: PRODUCT PORTFOLIO
TABLE 34.BROADRIDGE FINANCIAL SOLUTIONS, INC.: KEY EXECUTIVES
TABLE 35.BROADRIDGE FINANCIAL SOLUTIONS, INC.: COMPANY SNAPSHOT
TABLE 36.BROADRIDGE FINANCIAL SOLUTIONS, INC.: OPERATING SEGMENTS
TABLE 37.BROADRIDGE FINANCIAL SOLUTIONS, INC.: PRODUCT PORTFOLIO
TABLE 38.CASHBOOK: KEY EXECUTIVES
TABLE 39.CASHBOOK: COMPANY SNAPSHOT
TABLE 40.CASHBOOK: PRODUCT PORTFOLIO
TABLE 41.FISERV, INC.: KEY EXECUTIVES
TABLE 42.FISERV, INC.: COMPANY SNAPSHOT
TABLE 43.FISERV, INC.: OPERATING SEGMENTS
TABLE 44.FISERV, INC.: PRODUCT PORTFOLIO
TABLE 45.ORACLE CORPORATION: KEY EXECUTIVES
TABLE 46.ORACLE CORPORATION: COMPANY SNAPSHOT
TABLE 47.ORACLE CORPORATION: OPERATING SEGMENTS
TABLE 48.ORACLE CORPORATION: PRODUCT PORTFOLIO
TABLE 49.SAP SE: KEY EXECUTIVES
TABLE 50.SAP SE: COMPANY SNAPSHOT
TABLE 51.SAP SE: OPERATING SEGMENTS
TABLE 52.SAP SE: PRODUCT PORTFOLIO
TABLE 53.RECONART, INC.: KEY EXECUTIVES
TABLE 54.RECONART, INC.: COMPANY SNAPSHOT
TABLE 55.RECONART, INC.: PRODUCT PORTFOLIO
TABLE 56.RECONART, INC.: KEY STRATEGIC MOVES AND DEVELOPMENTS
TABLE 57.SIGMAIQ: KEY EXECUTIVES
TABLE 58.SIGMAIQ: COMPANY SNAPSHOT
TABLE 59.SIGMAIQ: PRODUCT PORTFOLIO
LIST OF FIGURES
FIGURE 01.KEY MARKET SEGMENTS
FIGURE 02.U.S. RETAIL RECON SOFTWARE MARKET, 2019-2027
FIGURE 03.U.S. RETAIL RECON SOFTWARE MARKET: TOP IMPACTING FACTOR
FIGURE 04.LOW-TO-MODERATE BARGAINING POWER OF SUPPLIERS
FIGURE 05.LOW-TO-MODERATE BARGAINING POWER OF BUYERS
FIGURE 06.LOW-TO-MODERATE THREAT OF SUBSTITUTES
FIGURE 07.MODERATE-TO-HIGH THREAT OF NEW ENTRANTS
FIGURE 08.LOW-TO-MODERATE COMPETITIVE RIVALRYS
FIGURE 09.U.S. RETAIL RECON SOFTWARE MARKET, BY COMPONENT, 2019–2027
FIGURE 10.U.S. RETAIL RECON SOFTWARE MARKET REVENUE, BY DEPLOYMENT MODE, 2019–2027 ($MILLION)
FIGURE 11.U.S. RETAIL RECON SOFTWARE MARKET REVENUE, BY RETAILER SIZE, 2019–2027 ($MILLION)
FIGURE 12.U.S. RETAIL RECON SOFTWARE MARKET, BY RECONCILIATION TYPE, 2019–2027
FIGURE 13.U.S. RETAIL RECON SOFTWARE MARKET, BY SOFTWARE TYPE, 2019–2027 ($MILLION)
FIGURE 14.TOP WINNING STRATEGIES, BY YEAR, 2018–2020
FIGURE 15.TOP WINNING STRATEGIES, BY DEVELOPMENT, 2017–2019
FIGURE 16.TOP WINNING STRATEGIES, BY COMPANY, 2017–2019
FIGURE 17.R&D EXPENDITURE, 2017–2019 ($MILLION)
FIGURE 18.BLACKLINE INC.: REVENUE, 2017–2019 ($MILLION)
FIGURE 19.BLACKLINE INC.: REVENUE SHARE BY REGION, 2019 (%)
FIGURE 20.BROADRIDGE FINANCIAL SOLUTIONS, INC.: REVENUE, 2017–2019 ($MILLION)
FIGURE 21.BROADRIDGE FINANCIAL SOLUTIONS, INC.: REVENUE SHARE BY SEGMENT, 2019 (%)
FIGURE 22.BROADRIDGE FINANCIAL SOLUTIONS, INC.: REVENUE SHARE BY REGION, 2019 (%)
FIGURE 23.FISERV, INC.: REVENUE, 2017–2019 ($MILLION)
FIGURE 24.FISERV, INC.: REVENUE SHARE BY SEGMENT, 2019 (%)
FIGURE 25.FISERV, INC.: REVENUE SHARE BY REGION, 2019 (%)
FIGURE 26.R&D EXPENDITURE, 2017–2019 ($MILLION)
FIGURE 27.ORACLE CORPORATION: REVENUE, 2017–2019 ($MILLION)
FIGURE 28.ORACLE CORPORATION: REVENUE SHARE, BY SEGMENT, 2019 (%)
FIGURE 29.ORACLE CORPORATION: REVENUE SHARE BY REGION, 2019 (%)
FIGURE 30.R&D EXPENDITURE, 2017–2019 ($MILLION)
FIGURE 31.SAP SE: REVENUE, 2017–2019 ($MILLION)
FIGURE 32.SAP SE: REVENUE SHARE, BY SEGMENT, 2019 (%)
FIGURE 33.SAP SE: REVENUE SHARE BY REGION, 2019 (%)
$2850
$5774
HAVE A QUERY?
OUR CUSTOMER

SIMILAR REPORTS