
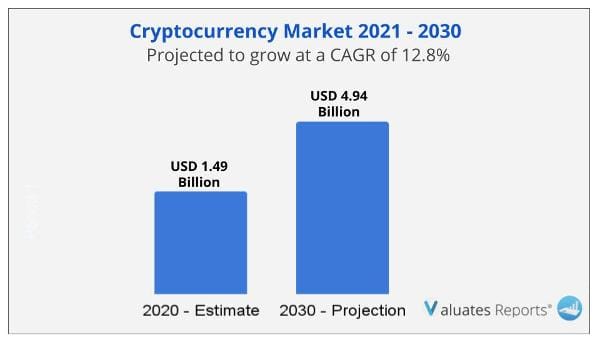
The global cryptocurrency market size was valued at $1.49 billion in 2020 and is projected to reach $4.94 billion by 2030, growing at a CAGR of 12.8% from 2021 to 2030. The cryptocurrency sector is booming thanks to the rising need for operational efficiency and transparency in financial payment systems, as well as increased demand for remittances in underdeveloped countries and data security. A surge in demand for cryptocurrencies among banks and financial institutions is predicted to create the excellent potential for market expansion during the forecast period.
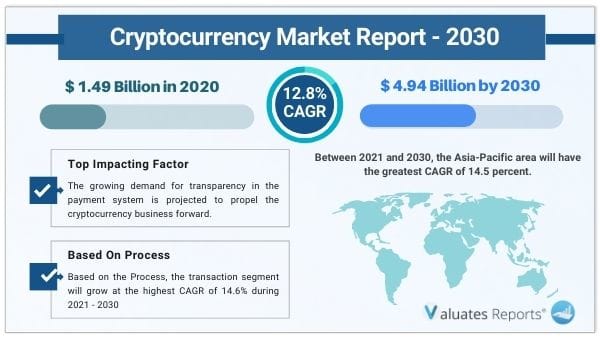
The growing demand for transparency in the payment system is projected to propel the cryptocurrency business forward. The cryptocurrency market is expected to grow fast in the coming years due to improved data transparency and independence across payments in banks, financial services, insurance, and other business sectors. The capacity to transmit and receive payments in a transparent manner, as well as the secure preservation of client information for future use, are all advantages of using cryptocurrency in the banking industry.
In addition, new blockchain distributed technology protocols are expected to eliminate the need for certain organizational solutions and allow multiple stakeholders to share payment in a transparent manner across the business. These strategies improve supply chain transparency, which helps to prevent environmental and other crimes. This raises the chances of cryptocurrency adoption in the future.
The cryptocurrency market's growth is likely to be aided by the untapped potential of emerging economies. By making finance and financial services more accessible, developing nations give significant opportunities for bitcoin to extend its operations. Bitcoin, the most well-known of these cryptocurrencies, has already helped many individuals and businesses develop and succeed financially. The economy is adjusting to these demands, and cryptocurrencies have a lot of potential to meet them. Changing demographics, increased consumption, and a willingness to adopt new technologies such as the Internet of Things, Blockchain, and others make cryptocurrencies attractive in emerging markets.
Cryptocurrencies are being adopted by a growing number of companies across a wide range of industries, from big tech to airlines, allowing customers to use them as an official means of payment for their goods and services. This is expected to boost the bitcoin market even further.
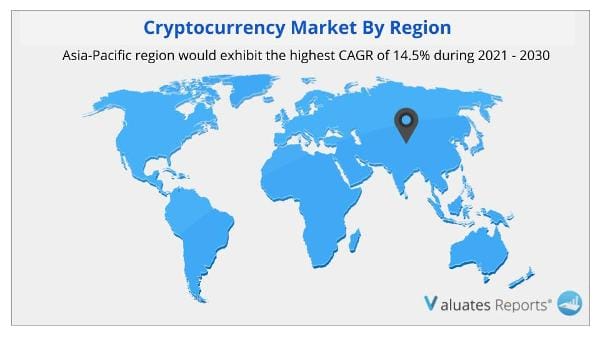
Between 2021 and 2030, the Asia-Pacific area will have the greatest CAGR of 14.5 percent. In 2020, Asia-Pacific dominated the cryptocurrency industry, and this trend is expected to continue throughout the forecast period. The cryptocurrency industry is maturing and getting more competitive as the number of Bitcoin exchanges in Asia grows. As the government pushes for the deployment of the technology that underpins bitcoin to boost financial sector transparency and combat fraud, Chinese institutions are employing blockchain experts. As a result of these factors, the region's bitcoin market is expanding.
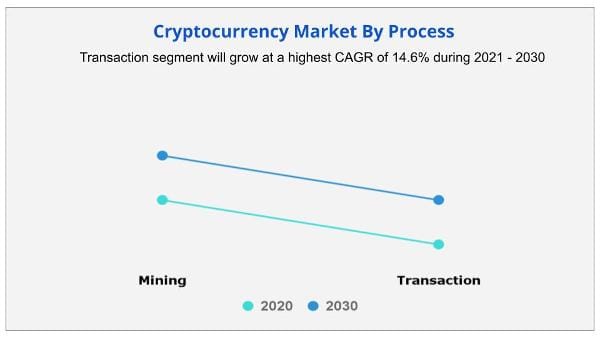
Based on the Process, the transaction segment will grow at the highest CAGR of 14.6% during 2021 - 2030.
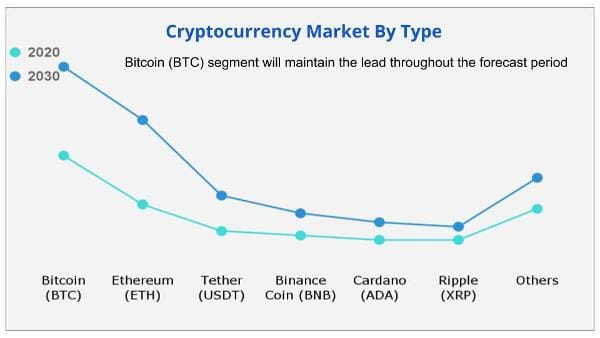
Depending on the type, Bitcoin is expected to gain a significant share during the projection period since it is the most widely recognized digital money in the world and operates without the need for approval from any external source of authority. The ripple (XRP) category, on the other hand, is expected to grow the most rapidly over the forecast period, as it can be used for a range of purposes such as accounting, investment, smart contract implementation, and decentralized programming.
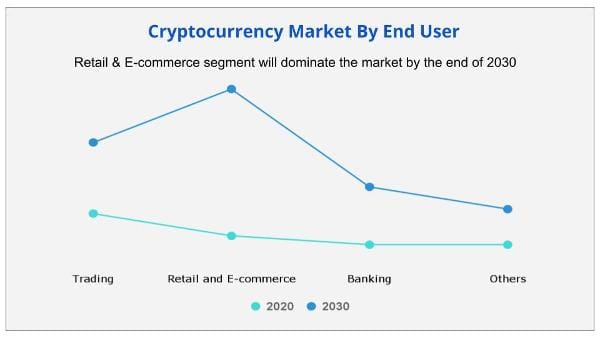
Based on End User, Retail & E-commerce segment will dominate the market by the end of 2030.
| Report Metric | Details |
| Report Name | Cryptocurrency Market |
| The market size in 2020 | USD 1.49 Billion |
| The revenue forecast in 2030 | USD 4.94 Billion |
| Growth Rate | Compound Annual Growth Rate (CAGR) of 12.8% from 2021 to 2030 |
| Market size available for years | 2021-2030 |
| Forecast units | Value (USD) |
| Segments covered | Type, End-User, Offerings, and Region |
| Report coverage | Revenue & volume forecast, company share, competitive landscape, growth factors, and trends |
| Geographic regions covered | North America, Europe, Asia Pacific, Latin America, Middle East & Africa |
Ans. The global cryptocurrency market size was valued at $1.49 billion in 2020, and is projected to reach $4.94 billion by 2030.
Ans. The global cryptocurrency market is expected to grow at a compound annual growth rate of 12.8% from 2020 to 2027.
Ans. Advanced Micro Devices Inc., BitFury Group Limited, BTL Group Ltd., Coincheck Inc., Intel Corporation, Ledger SAS, NVIDIA Corporation, Ripple, Xilinx Inc., and Xapo Holdings Limited.
Ans. Increase in need for operational efficiency and transparency in financial payment systems, rise in demand for remittances in developing countries, increase in data security, and improved market cap are the major factors that drive the growth of the global cryptocurrency market.
Ans. Hardware segment accounted for the highest market share throughout the forecast period.
Ans. Transaction segment will grow at a highest CAGR of 14.6% during 2021 - 2030.
Ans. Bitcoin (BTC) segment will maintain the lead throughout the forecast period.
Ans. Asia-Pacific region would exhibit the highest CAGR of 14.5% during 2021 - 2030.
Ans. Retail & E-commerce segment will dominate the market by the end of 2030.
CHAPTER 1:INTRODUCTION
1.1.Report description
1.2.Key benefits for stakeholders
1.3.Key market segments
1.4.Research methodology
1.4.1.Secondary research
1.4.2.Primary research
1.4.3.Analyst tools & models
CHAPTER 2:EXECUTIVE SUMMARY
2.1.Key findings
2.1.1.Top impacting factors
2.1.2.Top investment pockets
2.2.CXO perspective
CHAPTER 3:MARKET OVERVIEW
3.1.Market definition and scope
3.2.Key forces shaping global cryptocurrency market
3.3.Case studies
3.3.1.Bank of Montreal adopted blockchain distributed ledger technology for improving its transactions-making capability by using cryptocurrency
3.3.2.El Corte Ingles adopted cryptocurrency platform of Bitcor to increase productivity, lower risk costs, and accelerate growth in the payment industry
3.4.Market Capitalization
3.5.Market dynamics
3.5.1.Drivers
3.5.1.1.Rise in need for transparency in the payment system
3.5.1.2.Increase in flow of remittances from foreign countries
3.5.2.Restraint
3.5.2.1.Lack of awareness about cryptocurrency among people
3.5.3.Opportunity
3.5.3.1.Untapped potential on emerging economies
3.6.COVID-19 impact analysis on cryptocurrency market
3.6.1.Impact on market size
3.6.2.Consumer trends, preferences, and budget impact
3.6.3.Economic impact
3.6.4.Strategies to tackle negative impact
3.6.5.Opportunity window
CHAPTER 4:CRYPTOCURRENCY MARKET, BY OFFERING
4.1.Overview
4.2.Hardware
4.2.1.Key market trends, growth factors, and opportunities
4.2.2.Market size and forecast, by region
4.2.3.Market analysis, by country
4.2.4.Cryptocurrency for hardware, by type
4.2.4.1.ASIC
4.2.4.1.1.Market size and forecast, by region
4.2.4.1.2.Market analysis, by country
4.2.4.1.3.Cryptocurrency Market, by ASIC type
4.2.4.1.3.1.Semi-Custom ASIC
4.2.4.1.4.Market size and forecast, by region
4.2.4.1.4.1.Programmable ASIC
4.2.4.1.5.Market size and forecast, by region
4.2.4.1.5.1.Full Custom ASIC
4.2.4.1.6.Market size and forecast, by region
4.2.4.2.GPU
4.2.4.2.1.Market size and forecast, by region
4.2.4.3.FPGA
4.2.4.3.1.Market size and forecast, by region
4.2.4.4.Others
4.2.4.4.1.Market size and forecast, by region
4.3.Software
4.3.1.Key market trends, growth factors, and opportunities
4.3.2.Market size and forecast, by region
4.3.3.Market analysis, by country
4.3.4.Software solution, by type
4.3.4.1.Mining platform
4.3.4.1.1.Market size and forecast, by region
4.3.4.2.Exchange
4.3.4.2.1.Market size and forecast, by region
4.3.4.3.Coin Wallet
4.3.4.3.1.Market size and forecast, by region
CHAPTER 5:CRYPTOCURRENCY MARKET, BY PROCESS
5.1.Overview
5.2.Mining
5.2.1.Key market trends, growth factors, and opportunities
5.2.2.Market size and forecast, by region
5.2.3.Market analysis, by country
5.3.Transaction
5.3.1.Key market trends, growth factors, and opportunities
5.3.2.Market size and forecast, by region
5.3.3.Market analysis, by country
CHAPTER 6:CRYPTOCURRENCY MARKET, BY TYPE
6.1.Overview
6.2.Bitcoin (BTC)
6.2.1.Key market trends, growth factors, and opportunities
6.2.2.Market size and forecast, by region
6.2.3.Market analysis, by country
6.3.Ethereum (ETH)
6.3.1.Key market trends, growth factors, and opportunities
6.3.2.Market size and forecast, by region
6.3.3.Market analysis, by country
6.4.Tether (USDT)
6.4.1.Key market trends, growth factors, and opportunities
6.4.2.Market size and forecast, by region
6.4.3.Market analysis, by country
6.5.Binance Coin (BNB)
6.5.1.Key market trends, growth factors, and opportunities
6.5.2.Market size and forecast, by region
6.5.3.Market analysis, by country
6.6.Cardano (ADA)
6.6.1.Key market trends, growth factors, and opportunities
6.6.2.Market size and forecast, by region
6.6.3.Market analysis, by country
6.7.Ripple (XRP)
6.7.1.Key market trends, growth factors, and opportunities
6.7.2.Market size and forecast, by region
6.7.3.Market analysis, by country
6.8.Others
6.8.1.Key market trends, growth factors, and opportunities
6.8.2.Market size and forecast, by region
6.8.3.Market analysis, by country
CHAPTER 7:CRYPTOCURRENCY MARKET, BY END USE INDUSTRY
7.1.Overview
7.2.Trading
7.2.1.Key market trends, growth factors, and opportunities
7.2.2.Market size and forecast, by region
7.2.3.Market analysis, by country
7.3.Retail and E-commerce
7.3.1.Key market trends, growth factors, and opportunities
7.3.2.Market size and forecast, by region
7.3.3.Market analysis, by country
7.4.Banking
7.4.1.Key market trends, growth factors, and opportunities
7.4.2.Market size and forecast, by region
7.4.3.Market analysis, by country
7.5.Others
7.5.1.Key market trends, growth factors, and opportunities
7.5.2.Market size and forecast, by region
7.5.3.Market analysis, by country
CHAPTER 8:CRYPTOCURRENCY MARKET, BY REGION
8.1.Overview
8.1.1.Market size and forecast
8.2.North America
8.2.1.Key market trends, growth factors, and opportunities
8.2.2.Market size and forecast, by offering
8.2.3.Market size and forecast, by process
8.2.4.Market size and forecast, by type
8.2.5.Market size and forecast, by end use industry
8.2.6.Market size and forecast, cryptocurrency market, by hardware type
8.2.7.Market size and forecast, by ASIC type
8.2.8.Market size and forecast, cryptocurrency market, by software type
8.2.9.Market analysis, by country
8.2.9.1.U.S.
8.2.9.1.1.Market size and forecast, by offering
8.2.9.1.2.Market size and forecast, by process
8.2.9.1.3.Market size and forecast, by type
8.2.9.1.4.Market size and forecast, by end use industry
8.2.9.1.5.Market size and forecast, cryptocurrency market, by hardware type
8.2.9.1.6.Market size and forecast, by ASIC type
8.2.9.1.7.Market size and forecast, cryptocurrency market, by software type
8.2.9.2.Canada
8.2.9.2.1.Market size and forecast, by offering
8.2.9.2.2.Market size and forecast, by process
8.2.9.2.3.Market size and forecast, by type
8.2.9.2.4.Market size and forecast, by end use industry
8.2.9.2.5.Market size and forecast, cryptocurrency market, by hardware type
8.2.9.2.6.Market size and forecast, by ASIC type
8.2.9.2.7.Market size and forecast, cryptocurrency market, by software type
8.3.Europe
8.3.1.Key market trends, growth factors, and opportunities
8.3.2.Market size and forecast, by offering
8.3.3.Market size and forecast, by process
8.3.4.Market size and forecast, by type
8.3.5.Market size and forecast, by end use industry
8.3.6.Market size and forecast, cryptocurrency market, by hardware type
8.3.7.Market size and forecast, by ASIC type
8.3.8.Market size and forecast, cryptocurrency market, by software type
8.3.9.Market analysis, by country
8.3.9.1.UK
8.3.9.1.1.Market size and forecast, by offering
8.3.9.1.2.Market size and forecast, by process
8.3.9.1.3.Market size and forecast, by type
8.3.9.1.4.Market size and forecast, by end use industry
8.3.9.1.5.Market size and forecast, cryptocurrency market, by hardware type
8.3.9.1.6.Market size and forecast, by ASIC type
8.3.9.1.7.Market size and forecast, cryptocurrency market, by software type
8.3.9.2.Germany
8.3.9.2.1.Market size and forecast, by offering
8.3.9.2.2.Market size and forecast, by process
8.3.9.2.3.Market size and forecast, by type
8.3.9.2.4.Market size and forecast, by end use industry
8.3.9.2.5.Market size and forecast, cryptocurrency market, by hardware type
8.3.9.2.6.Market size and forecast, by ASIC type
8.3.9.2.7.Market size and forecast, cryptocurrency market, by software type
8.3.9.3.France
8.3.9.3.1.Market size and forecast, by offering
8.3.9.3.2.Market size and forecast, by process
8.3.9.3.3.Market size and forecast, by type
8.3.9.3.4.Market size and forecast, by end use industry
8.3.9.3.5.Market size and forecast, cryptocurrency market, by hardware type
8.3.9.3.6.Market size and forecast, by ASIC type
8.3.9.3.7.Market size and forecast, cryptocurrency market, by software type
8.3.9.4.Italy
8.3.9.4.1.Market size and forecast, by offering
8.3.9.4.2.Market size and forecast, by process
8.3.9.4.3.Market size and forecast, by type
8.3.9.4.4.Market size and forecast, by end use industry
8.3.9.4.5.Market size and forecast, cryptocurrency market, by hardware type
8.3.9.4.6.Market size and forecast, by ASIC type
8.3.9.4.7.Market size and forecast, cryptocurrency market, by software type
8.3.9.5.Spain
8.3.9.5.1.Market size and forecast, by offering
8.3.9.5.2.Market size and forecast, by process
8.3.9.5.3.Market size and forecast, by type
8.3.9.5.4.Market size and forecast, by end use industry
8.3.9.5.5.Market size and forecast, cryptocurrency market, by hardware type
8.3.9.5.6.Market size and forecast, by ASIC type
8.3.9.5.7.Market size and forecast, cryptocurrency market, by software type
8.3.9.6.Netherlands
8.3.9.6.1.Market size and forecast, by offering
8.3.9.6.2.Market size and forecast, by process
8.3.9.6.3.Market size and forecast, by type
8.3.9.6.4.Market size and forecast, by end use industry
8.3.9.6.5.Market size and forecast, cryptocurrency market, by hardware type
8.3.9.6.6.Market size and forecast, by ASIC type
8.3.9.6.7.Market size and forecast, cryptocurrency market, by software type
8.3.9.7.Rest of Europe
8.3.9.7.1.Market size and forecast, by offering
8.3.9.7.2.Market size and forecast, by process
8.3.9.7.3.Market size and forecast, by type
8.3.9.7.4.Market size and forecast, by end use industry
8.3.9.7.5.Market size and forecast, cryptocurrency market, by hardware type
8.3.9.7.6.Market size and forecast, by ASIC type
8.3.9.7.7.Market size and forecast, cryptocurrency market, by software type
8.4.Asia-Pacific
8.4.1.Key market trends, growth factors, and opportunities
8.4.2.Market size and forecast, by offering
8.4.3.Market size and forecast, by process
8.4.4.Market size and forecast, by type
8.4.5.Market size and forecast, by end use industry
8.4.6.Market size and forecast, cryptocurrency market, by hardware type
8.4.7.Market size and forecast, by ASIC type
8.4.8.Market size and forecast, cryptocurrency market, by software type
8.4.9.Market analysis, by country
8.4.9.1.China
8.4.9.1.1.Market size and forecast, by offering
8.4.9.1.2.Market size and forecast, by process
8.4.9.1.3.Market size and forecast, by type
8.4.9.1.4.Market size and forecast, by end use industry
8.4.9.1.5.Market size and forecast, cryptocurrency market, by hardware type
8.4.9.1.6.Market size and forecast, by ASIC type
8.4.9.1.7.Market size and forecast, cryptocurrency market, by software type
8.4.9.2.Japan
8.4.9.2.1.Market size and forecast, by offering
8.4.9.2.2.Market size and forecast, by process
8.4.9.2.3.Market size and forecast, by type
8.4.9.2.4.Market size and forecast, by end use industry
8.4.9.2.5.Market size and forecast, cryptocurrency market, by hardware type
8.4.9.2.6.Market size and forecast, by ASIC type
8.4.9.2.7.Market size and forecast, cryptocurrency market, by software type
8.4.9.3.India
8.4.9.3.1.Market size and forecast, by offering
8.4.9.3.2.Market size and forecast, by process
8.4.9.3.3.Market size and forecast, by type
8.4.9.3.4.Market size and forecast, by end use industry
8.4.9.3.5.Market size and forecast, cryptocurrency market, by hardware type
8.4.9.3.6.Market size and forecast, by ASIC type
8.4.9.3.7.Market size and forecast, cryptocurrency market, by software type
8.4.9.4.Australia
8.4.9.4.1.Market size and forecast, by offering
8.4.9.4.2.Market size and forecast, by process
8.4.9.4.3.Market size and forecast, by type
8.4.9.4.4.Market size and forecast, by end use industry
8.4.9.4.5.Market size and forecast, cryptocurrency market, by hardware type
8.4.9.4.6.Market size and forecast, by ASIC type
8.4.9.4.7.Market size and forecast, cryptocurrency market, by software type
8.4.9.5.South Korea
8.4.9.5.1.Market size and forecast, by offering
8.4.9.5.2.Market size and forecast, by process
8.4.9.5.3.Market size and forecast, by type
8.4.9.5.4.Market size and forecast, by end use industry
8.4.9.5.5.Market size and forecast, cryptocurrency market, by hardware type
8.4.9.5.6.Market size and forecast, by ASIC type
8.4.9.5.7.Market size and forecast, cryptocurrency market, by software type
8.4.9.6.Rest of Asia-Pacific
8.4.9.6.1.Market size and forecast, by offering
8.4.9.6.2.Market size and forecast, by process
8.4.9.6.3.Market size and forecast, by type
8.4.9.6.4.Market size and forecast, by end use industry
8.4.9.6.5.Market size and forecast, cryptocurrency market, by hardware type
8.4.9.6.6.Market size and forecast, by ASIC type
8.4.9.6.7.Market size and forecast, cryptocurrency market, by software type
8.5.LAMEA
8.5.1.Key market trends, growth factors, and opportunities
8.5.2.Market size and forecast, by offering
8.5.3.Market size and forecast, by process
8.5.4.Market size and forecast, by type
8.5.5.Market size and forecast, by end use industry
8.5.6.Market size and forecast, cryptocurrency market, by hardware type
8.5.7.Market size and forecast, by ASIC type
8.5.8.Market size and forecast, cryptocurrency market, by software type
8.5.9.Market analysis, by country
8.5.9.1.Latin America
8.5.9.1.1.Market size and forecast, by offering
8.5.9.1.2.Market size and forecast, by process
8.5.9.1.3.Market size and forecast, by type
8.5.9.1.4.Market size and forecast, by end use industry
8.5.9.1.5.Market size and forecast, cryptocurrency market, by hardware type
8.5.9.1.6.Market size and forecast, by ASIC type
8.5.9.1.7.Market size and forecast, cryptocurrency market, by software type
8.5.9.2.Middle East
8.5.9.2.1.Market size and forecast, by offering
8.5.9.2.2.Market size and forecast, by process
8.5.9.2.3.Market size and forecast, by type
8.5.9.2.4.Market size and forecast, by end use industry
8.5.9.2.5.Market size and forecast, cryptocurrency market, by hardware type
8.5.9.2.6.Market size and forecast, by ASIC type
8.5.9.2.7.Market size and forecast, cryptocurrency market, by software type
8.5.9.3.Africa
8.5.9.3.1.Market size and forecast, by offering
8.5.9.3.2.Market size and forecast, by process
8.5.9.3.2.1.Market size and forecast, by type
8.5.9.3.3.Market size and forecast, by end use industry
8.5.9.3.4.Market size and forecast, cryptocurrency market, by hardware type
8.5.9.3.5.Market size and forecast, by ASIC type
8.5.9.3.6.Market size and forecast, cryptocurrency market, by software type
CHAPTER 9:COMPETITIVE LANDSCAPE
9.1.Key players positioning analysis, 2020
9.2.Top winning strategies
9.3.Competitive dashboard
CHAPTER 10:COMPANY PROFILES
10.1.ADVANCED MICRO DEVICES, INC.
10.1.1.Company overview
10.1.2.Key executives
10.1.3.Company snapshot
10.1.4.Operating business segments
10.1.5.Product portfolio
10.1.6.R&D expenditure
10.1.7.Business performance
10.2.BITFURY GROUP LIMITED
10.2.1.Company overview
10.2.2.Key Executives
10.2.3.Company snapshot
10.2.4.Product portfolio
10.2.5.Key strategic moves and developments
10.3.BITMAIN TECHNOLOGIES HOLDING COMPANY
10.3.1.Company overview
10.3.2.Key Executives
10.3.3.Company snapshot
10.3.4.Product portfolio
10.3.5.Key strategic moves and developments
10.4.COINCHECK, INC.
10.4.1.Company overview
10.4.2.Key Executives
10.4.3.Company snapshot
10.4.4.Product portfolio
10.5.INTEL CORPORATION
10.5.1.Company overview
10.5.2.Key executives
10.5.3.Company snapshot
10.5.4.Operating business segments
10.5.5.Product portfolio
10.5.6.R&D Expenditure
10.5.7.Business performance
10.5.8.Key strategic moves and developments
10.6.LEDGER SAS
10.6.1.Company overview
10.6.2.Key Executives
10.6.3.Company snapshot
10.6.4.Product portfolio
10.7.NVIDIA CORPORATION
10.7.1.Company overview
10.7.2.Key Executives
10.7.3.Company snapshot
10.7.4.Operating business segments
10.7.5.Product portfolio
10.7.6.Business performance
10.8.RIPPLE
10.8.1.Company overview
10.8.2.Key Executives
10.8.3.Company snapshot
10.8.4.Product portfolio
10.8.5.Key strategic moves and developments
10.9.XILINX
10.9.1.Company overview
10.9.2.Key executives
10.9.3.Company snapshot
10.9.4.Product portfolio
10.9.5.R&D expenditure
10.9.6.Business performance
10.10.XAPO HOLDINGS LIMITED
10.10.1.Company overview
10.10.2.Key Executives
10.10.3.Company snapshot
10.10.4.Product portfolio
LIST OF TABLES
TABLE 01.CRYPTOCURRENCY MARKET, BY OFFERING, 2020–2030 ($MILLION)
TABLE 02.CRYPTOCURRENCY MARKET REVENUE FOR HARDWARE, BY REGION, 2020–2030 ($MILLION)
TABLE 03.CRYPTOCURRENCY MARKET REVENUE FOR HARDWARE, BY TYPE, 2020–2030 ($MILLION)
TABLE 04.CRYPTOCURRENCY MARKET REVENUE FOR ASIC, BY REGION, 2020–2030 ($MILLION)
TABLE 05.CRYPTOCURRENCY MARKET, BY ASIC TYPE, 2020–2030 ($MILLION)
TABLE 06.ASIC MARKET REVENUE FOR SEMI-CUSTOM ASIC, BY REGION, 2020–2030 ($MILLION)
TABLE 07.ASIC MARKET REVENUE FOR PROGRAMMABLE ASIC, BY REGION, 2020–2030 ($MILLION)
TABLE 08.ASIC MARKET REVENUE FOR FULL CUSTOM ASIC, BY REGION, 2020–2030 ($MILLION)
TABLE 09.CRYPTOCURRENCY MARKET REVENUE FOR GPU, BY REGION, 2020–2030 ($MILLION)
TABLE 10.CRYPTOCURRENCY MARKET REVENUE FOR FPGA, BY REGION, 2020–2030 ($MILLION)
TABLE 11.CRYPTOCURRENCY MARKET REVENUE FOR OTHERS, BY REGION, 2020–2030 ($MILLION)
TABLE 12.CRYPTOCURRENCY MARKET REVENUE FOR SOFTWARE, BY REGION, 2020–2030 ($MILLION)
TABLE 13.CRYPTOCURRENCY MARKET REVENUE FOR SOFTWARE SOLUTION, BY TYPE, 2020–2030 ($MILLION)
TABLE 14.CRYPTOCURRENCY MARKET REVENUE FOR MINING PLATFORM, BY REGION, 2020–2030 ($MILLION)
TABLE 15.CRYPTOCURRENCY MARKET REVENUE FOR EXCHANGE, BY REGION, 2020–2030 ($MILLION)
TABLE 16.CRYPTOCURRENCY MARKET REVENUE FOR COIN WALLET, BY REGION, 2020–2030 ($MILLION)
TABLE 17.CRYPTOCURRENCY MARKET, BY PROCESS, 2020–2030 ($MILLION)
TABLE 18.CRYPTOCURRENCY MARKET REVENUE FOR MINING, BY REGION, 2020–2030 ($MILLION)
TABLE 19.CRYPTOCURRENCY MARKET REVENUE FOR TRANSACTION, BY REGION, 2020–2030 ($MILLION)
TABLE 20.CRYPTOCURRENCY MARKET, BY TYPE, 2020–2030 ($MILLION)
TABLE 21.CRYPTOCURRENCY MARKET REVENUE FOR BITCOIN (BTC), BY REGION, 2020–2030 ($MILLION)
TABLE 22.CRYPTOCURRENCY MARKET REVENUE FOR ETHEREUM (ETH), BY REGION, 2020–2030 ($MILLION)
TABLE 23.CRYPTOCURRENCY MARKET REVENUE FOR TETHER (USDT), BY REGION, 2020–2030 ($MILLION)
TABLE 24.CRYPTOCURRENCY MARKET REVENUE FOR BINANCE COIN (BNB), BY REGION, 2020–2030 ($MILLION)
TABLE 25.CRYPTOCURRENCY MARKET REVENUE FOR CARDANO (ADA), BY REGION, 2020–2030 ($MILLION)
TABLE 26.CRYPTOCURRENCY MARKET REVENUE FOR RIPPLE (XRP), BY REGION, 2020–2030 ($MILLION)
TABLE 27.CRYPTOCURRENCY MARKET REVENUE FOR OTHERS, BY REGION, 2020–2030 ($MILLION)
TABLE 28.CRYPTOCURRENCY MARKET, BY END USE INDUSTRY, 2020–2030 ($MILLION)
TABLE 29.CRYPTOCURRENCY MARKET REVENUE FOR TRADING, BY REGION, 2020–2030 ($MILLION)
TABLE 30.CRYPTOCURRENCY MARKET REVENUE FOR RETAIL & E-COMMERCE, BY REGION, 2020–2030 ($MILLION)
TABLE 31.CRYPTOCURRENCY MARKET REVENUE FOR BANKING, BY REGION, 2020–2030 ($MILLION)
TABLE 32.CRYPTOCURRENCY MARKET REVENUE FOR OTHERS, BY REGION, 2020–2030 ($MILLION)
TABLE 33.CRYPTOCURRENCY MARKET, BY REGION, 2020–2030 ($MILLION)
TABLE 34.NORTH AMERICA CRYPTOCURRENCY MARKET REVENUE, BY OFFERING, 2020–2030 ($MILLION)
TABLE 35.NORTH AMERICA CRYPTOCURRENCY MARKET REVENUE, BY PROCESS, 2020–2030 ($MILLION)
TABLE 36.NORTH AMERICA CRYPTOCURRENCY MARKET REVENUE, BY TYPE, 2020–2030 ($MILLION)
TABLE 37.NORTH AMERICA CRYPTOCURRENCY MARKET REVENUE, BY END USE INDUSTRY, 2020–2030 ($MILLION)
TABLE 38.NORTH AMERICA CRYPTOCURRENCY MARKET, BY HARDWARE TYPE, 2020–2030 ($MILLION)
TABLE 39.NORTH AMERICA CRYPTOCURRENCY HARDWARE MARKET, BY ASIC TYPE, 2020–2030 ($MILLION)
TABLE 40.NORTH AMERICA CRYPTOCURRENCY MARKET, BY SOFTWARE TYPE, 2020–2030 ($MILLION)
TABLE 41.NORTH AMERICA CRYPTOCURRENCY MARKET REVENUE, BY COUNTRY, 2020–2030 ($MILLION)
TABLE 42.U.S. CRYPTOCURRENCY MARKET REVENUE, BY OFFERING, 2020–2030 ($MILLION)
TABLE 43.U.S. CRYPTOCURRENCY MARKET REVENUE, BY PROCESS, 2020–2030 ($MILLION)
TABLE 44.U.S. CRYPTOCURRENCY MARKET REVENUE, BY TYPE, 2020–2030 ($MILLION)
TABLE 45.U.S. CRYPTOCURRENCY MARKET REVENUE, BY END USE INDUSTRY, 2020–2030 ($MILLION)
TABLE 46.U.S. CRYPTOCURRENCY MARKET, BY HARDWARE TYPE, 2020–2030 ($MILLION)
TABLE 47.U.S. CRYPTOCURRENCY HARDWARE MARKET, BY ASIC TYPE, 2020–2030 ($MILLION)
TABLE 48.U.S. CRYPTOCURRENCY MARKET, BY SOFTWARE TYPE, 2020–2030 ($MILLION)
TABLE 49.CANADA CRYPTOCURRENCY MARKET REVENUE, BY OFFERING, 2020–2030 ($MILLION)
TABLE 50.CANADA CRYPTOCURRENCY MARKET REVENUE, BY PROCESS, 2020–2030 ($MILLION)
TABLE 51.CANADA CRYPTOCURRENCY MARKET REVENUE, BY TYPE, 2020–2030 ($MILLION)
TABLE 52.CANADA CRYPTOCURRENCY MARKET REVENUE, BY END USE INDUSTRY, 2020–2030 ($MILLION)
TABLE 53.CANADA CRYPTOCURRENCY MARKET, BY HARDWARE TYPE, 2020–2030 ($MILLION)
TABLE 54.CANADA CRYPTOCURRENCY HARDWARE MARKET, BY ASIC TYPE, 2020–2030 ($MILLION)
TABLE 55.CANADA CRYPTOCURRENCY MARKET, BY SOFTWARE TYPE, 2020–2030 ($MILLION)
TABLE 56.EUROPE CRYPTOCURRENCY MARKET REVENUE, BY OFFERING, 2020–2030 ($MILLION)
TABLE 57.EUROPE CRYPTOCURRENCY MARKET REVENUE, BY PROCESS, 2020–2030 ($MILLION)
TABLE 58.EUROPE CRYPTOCURRENCY MARKET REVENUE, BY TYPE, 2020–2030 ($MILLION)
TABLE 59.EUROPE CRYPTOCURRENCY MARKET REVENUE, BY END USE INDUSTRY, 2020–2030 ($MILLION)
TABLE 60.EUROPE CRYPTOCURRENCY MARKET, BY HARDWARE TYPE, 2020–2030 ($MILLION)
TABLE 61.EUROPE CRYPTOCURRENCY HARDWARE MARKET, BY ASIC TYPE, 2020–2030 ($MILLION)
TABLE 62.EUROPE CRYPTOCURRENCY MARKET, BY SOFTWARE TYPE, 2020–2030 ($MILLION)
TABLE 63.EUROPE CRYPTOCURRENCY MARKET REVENUE, BY COUNTRY, 2020–2030 ($MILLION)
TABLE 64.UK CRYPTOCURRENCY MARKET REVENUE, BY OFFERING, 2020–2030 ($MILLION)
TABLE 65.UK CRYPTOCURRENCY MARKET REVENUE, BY PROCESS, 2020–2030 ($MILLION)
TABLE 66.UK CRYPTOCURRENCY MARKET REVENUE, BY TYPE, 2020–2030 ($MILLION)
TABLE 67.UK CRYPTOCURRENCY MARKET REVENUE, BY END USE INDUSTRY, 2020–2030 ($MILLION)
TABLE 68.UK CRYPTOCURRENCY MARKET, BY HARDWARE TYPE, 2020–2030 ($MILLION)
TABLE 69.UK CRYPTOCURRENCY HARDWARE MARKET, BY ASIC TYPE, 2020–2030 ($MILLION)
TABLE 70.UK CRYPTOCURRENCY MARKET, BY SOFTWARE TYPE, 2020–2030 ($MILLION)
TABLE 71.GERMANY CRYPTOCURRENCY MARKET REVENUE, BY OFFERING, 2020–2030 ($MILLION)
TABLE 72.GERMANY CRYPTOCURRENCY MARKET REVENUE, BY PROCESS, 2020–2030 ($MILLION)
TABLE 73.GERMANY CRYPTOCURRENCY MARKET REVENUE, BY TYPE, 2020–2030 ($MILLION)
TABLE 74.GERMANY CRYPTOCURRENCY MARKET REVENUE, BY END USE INDUSTRY, 2020–2030 ($MILLION)
TABLE 75.GERMANY CRYPTOCURRENCY MARKET, BY HARDWARE TYPE, 2020–2030 ($MILLION)
TABLE 76.GERMANY CRYPTOCURRENCY HARDWARE MARKET, BY ASIC TYPE, 2020–2030 ($MILLION)
TABLE 77.GERMANY CRYPTOCURRENCY MARKET, BY SOFTWARE TYPE, 2020–2030 ($MILLION)
TABLE 78.FRANCE CRYPTOCURRENCY MARKET REVENUE, BY OFFERING, 2020–2030 ($MILLION)
TABLE 79.FRANCE CRYPTOCURRENCY MARKET REVENUE, BY PROCESS, 2020–2030 ($MILLION)
TABLE 80.FRANCE CRYPTOCURRENCY MARKET REVENUE, BY TYPE, 2020–2030 ($MILLION)
TABLE 81.FRANCE CRYPTOCURRENCY MARKET REVENUE, BY END USE INDUSTRY, 2020–2030 ($MILLION)
TABLE 82.FRANCE CRYPTOCURRENCY MARKET, BY HARDWARE TYPE, 2020–2030 ($MILLION)
TABLE 83.FRANCE CRYPTOCURRENCY HARDWARE MARKET, BY ASIC TYPE, 2020–2030 ($MILLION)
TABLE 84.FRANCE CRYPTOCURRENCY MARKET, BY SOFTWARE TYPE, 2020–2030 ($MILLION)
TABLE 85.ITALY CRYPTOCURRENCY MARKET REVENUE, BY OFFERING, 2020–2030 ($MILLION)
TABLE 86.ITALY CRYPTOCURRENCY MARKET REVENUE, BY PROCESS, 2020–2030 ($MILLION)
TABLE 87.ITALY CRYPTOCURRENCY MARKET REVENUE, BY TYPE, 2020–2030 ($MILLION)
TABLE 88.ITALY CRYPTOCURRENCY MARKET REVENUE, BY END USE INDUSTRY, 2020–2030 ($MILLION)
TABLE 89.ITALY CRYPTOCURRENCY MARKET, BY HARDWARE TYPE, 2020–2030 ($MILLION)
TABLE 90.ITALY CRYPTOCURRENCY HARDWARE MARKET, BY ASIC TYPE, 2020–2030 ($MILLION)
TABLE 91.ITALY CRYPTOCURRENCY MARKET, BY SOFTWARE TYPE, 2020–2030 ($MILLION)
TABLE 92.SPAIN CRYPTOCURRENCY MARKET REVENUE, BY OFFERING, 2020–2030 ($MILLION)
TABLE 93.SPAIN CRYPTOCURRENCY MARKET REVENUE, BY PROCESS, 2020–2030 ($MILLION)
TABLE 94.SPAIN CRYPTOCURRENCY MARKET REVENUE, BY TYPE, 2020–2030 ($MILLION)
TABLE 95.SPAIN CRYPTOCURRENCY MARKET REVENUE, BY END USE INDUSTRY, 2020–2030 ($MILLION)
TABLE 96.SPAIN CRYPTOCURRENCY MARKET, BY HARDWARE TYPE, 2020–2030 ($MILLION)
TABLE 97.SPAIN CRYPTOCURRENCY HARDWARE MARKET, BY ASIC TYPE, 2020–2030 ($MILLION)
TABLE 98.SPAIN CRYPTOCURRENCY MARKET, BY SOFTWARE TYPE, 2020–2030 ($MILLION)
TABLE 99.THE NETHERLANDS CRYPTOCURRENCY MARKET REVENUE, BY OFFERING, 2020–2030 ($MILLION)
TABLE 100.THE NETHERLANDS CRYPTOCURRENCY MARKET REVENUE, BY PROCESS, 2020–2030 ($MILLION)
TABLE 101.THE NETHERLANDS CRYPTOCURRENCY MARKET REVENUE, BY TYPE, 2020–2030 ($MILLION)
TABLE 102.THE NETHERLANDS CRYPTOCURRENCY MARKET REVENUE, BY END USE INDUSTRY, 2020–2030 ($MILLION)
TABLE 103.THE NETHERLANDS CRYPTOCURRENCY MARKET, BY HARDWARE TYPE, 2020–2030 ($MILLION)
TABLE 104.THE NETHERLANDS CRYPTOCURRENCY HARDWARE MARKET, BY ASIC TYPE, 2020–2030 ($MILLION)
TABLE 105.THE NETHERLANDS CRYPTOCURRENCY MARKET, BY SOFTWARE TYPE, 2020–2030 ($MILLION)
TABLE 106.REST OF EUROPE CRYPTOCURRENCY MARKET REVENUE, BY OFFERING, 2020–2030 ($MILLION)
TABLE 107.REST OF EUROPE CRYPTOCURRENCY MARKET REVENUE, BY PROCESS, 2020–2030 ($MILLION)
TABLE 108.REST OF EUROPE CRYPTOCURRENCY MARKET REVENUE, BY TYPE, 2020–2030 ($MILLION)
TABLE 109.REST OF EUROPE CRYPTOCURRENCY MARKET REVENUE, BY END USE INDUSTRY, 2020–2030 ($MILLION)
TABLE 110.REST OF EUROPE CRYPTOCURRENCY MARKET, BY HARDWARE TYPE, 2020–2030 ($MILLION)
TABLE 111.REST OF EUROPE CRYPTOCURRENCY HARDWARE MARKET, BY ASIC TYPE, 2020–2030 ($MILLION)
TABLE 112.REST OF EUROPE CRYPTOCURRENCY MARKET, BY SOFTWARE TYPE, 2020–2030 ($MILLION)
TABLE 113.ASIA-PACIFIC CRYPTOCURRENCY MARKET REVENUE, BY OFFERING, 2020–2030 ($MILLION)
TABLE 114.ASIA-PACIFIC CRYPTOCURRENCY MARKET REVENUE, BY PROCESS, 2020–2030 ($MILLION)
TABLE 115.ASIA-PACIFIC CRYPTOCURRENCY MARKET REVENUE, BY TYPE, 2020–2030 ($MILLION)
TABLE 116.ASIA-PACIFIC CRYPTOCURRENCY MARKET REVENUE, BY END USE INDUSTRY, 2020–2030 ($MILLION)
TABLE 117.ASIA-PACIFIC CRYPTOCURRENCY MARKET, BY HARDWARE TYPE, 2020–2030 ($MILLION)
TABLE 118.ASIA-PACIFIC CRYPTOCURRENCY HARDWARE MARKET, BY ASIC TYPE, 2020–2030 ($MILLION)
TABLE 119.ASIA-PACIFIC CRYPTOCURRENCY MARKET, BY SOFTWARE TYPE, 2020–2030 ($MILLION)
TABLE 120.ASIA-PACIFIC CRYPTOCURRENCY MARKET REVENUE, BY COUNTRY, 2020–2030 ($MILLION)
TABLE 121.CHINA CRYPTOCURRENCY MARKET REVENUE, BY OFFERING, 2020–2030 ($MILLION)
TABLE 122.CHINA CRYPTOCURRENCY MARKET REVENUE, BY PROCESS, 2020–2030 ($MILLION)
TABLE 123.CHINA CRYPTOCURRENCY MARKET REVENUE, BY TYPE, 2020–2030 ($MILLION)
TABLE 124.CHINA CRYPTOCURRENCY MARKET REVENUE, BY END USE INDUSTRY, 2020–2030 ($MILLION)
TABLE 125.CHINA CRYPTOCURRENCY MARKET, BY HARDWARE TYPE, 2020–2030 ($MILLION)
TABLE 126.CHINA CRYPTOCURRENCY HARDWARE MARKET, BY ASIC TYPE, 2020–2030 ($MILLION)
TABLE 127.CHINA CRYPTOCURRENCY MARKET, BY SOFTWARE TYPE, 2020–2030 ($MILLION)
TABLE 128.JAPAN CRYPTOCURRENCY MARKET REVENUE, BY OFFERING, 2020–2030 ($MILLION)
TABLE 129.JAPAN CRYPTOCURRENCY MARKET REVENUE, BY PROCESS, 2020–2030 ($MILLION)
TABLE 130.JAPAN CRYPTOCURRENCY MARKET REVENUE, BY TYPE, 2020–2030 ($MILLION)
TABLE 131.JAPAN CRYPTOCURRENCY MARKET REVENUE, BY END USE INDUSTRY, 2020–2030 ($MILLION)
TABLE 132.JAPAN CRYPTOCURRENCY MARKET, BY HARDWARE TYPE, 2020–2030 ($MILLION)
TABLE 133.JAPAN CRYPTOCURRENCY HARDWARE MARKET, BY ASIC TYPE, 2020–2030 ($MILLION)
TABLE 134.JAPAN CRYPTOCURRENCY MARKET, BY SOFTWARE TYPE, 2020–2030 ($MILLION)
TABLE 135.INDIA CRYPTOCURRENCY MARKET REVENUE, BY OFFERING, 2020–2030 ($MILLION)
TABLE 136.INDIA CRYPTOCURRENCY MARKET REVENUE, BY PROCESS, 2020–2030 ($MILLION)
TABLE 137.INDIA CRYPTOCURRENCY MARKET REVENUE, BY TYPE, 2020–2030 ($MILLION)
TABLE 138.INDIA CRYPTOCURRENCY MARKET REVENUE, BY END USE INDUSTRY, 2020–2030 ($MILLION)
TABLE 139.INDIA CRYPTOCURRENCY MARKET, BY HARDWARE TYPE, 2020–2030 ($MILLION)
TABLE 140.INDIA CRYPTOCURRENCY HARDWARE MARKET, BY ASIC TYPE, 2020–2030 ($MILLION)
TABLE 141.INDIA CRYPTOCURRENCY MARKET, BY SOFTWARE TYPE, 2020–2030 ($MILLION)
TABLE 142.AUSTRALIA CRYPTOCURRENCY MARKET REVENUE, BY OFFERING, 2020–2030 ($MILLION)
TABLE 143.AUSTRALIA CRYPTOCURRENCY MARKET REVENUE, BY PROCESS, 2020–2030 ($MILLION)
TABLE 144.AUSTRALIA CRYPTOCURRENCY MARKET REVENUE, BY TYPE, 2020–2030 ($MILLION)
TABLE 145.AUSTRALIA CRYPTOCURRENCY MARKET REVENUE, BY END USE INDUSTRY, 2020–2030 ($MILLION)
TABLE 146.AUSTRALIA CRYPTOCURRENCY MARKET, BY HARDWARE TYPE, 2020–2030 ($MILLION)
TABLE 147.AUSTRALIA CRYPTOCURRENCY HARDWARE MARKET, BY ASIC TYPE, 2020–2030 ($MILLION)
TABLE 148.AUSTRALIA CRYPTOCURRENCY MARKET, BY SOFTWARE TYPE, 2020–2030 ($MILLION)
TABLE 149.SOUTH KOREA CRYPTOCURRENCY MARKET REVENUE, BY OFFERING, 2020–2030 ($MILLION)
TABLE 150.SOUTH KOREA CRYPTOCURRENCY MARKET REVENUE, BY PROCESS, 2020–2030 ($MILLION)
TABLE 151.SOUTH KOREA CRYPTOCURRENCY MARKET REVENUE, BY TYPE, 2020–2030 ($MILLION)
TABLE 152.SOUTH KOREA CRYPTOCURRENCY MARKET REVENUE, BY END USE INDUSTRY, 2020–2030 ($MILLION)
TABLE 153.SOUTH KOREA CRYPTOCURRENCY MARKET, BY HARDWARE TYPE, 2020–2030 ($MILLION)
TABLE 154.SOUTH KOREA CRYPTOCURRENCY HARDWARE MARKET, BY ASIC TYPE, 2020–2030 ($MILLION)
TABLE 155.SOUTH KOREA CRYPTOCURRENCY MARKET, BY SOFTWARE TYPE, 2020–2030 ($MILLION)
TABLE 156.REST OF ASIA-PACIFIC CRYPTOCURRENCY MARKET REVENUE, BY OFFERING, 2020–2030 ($MILLION)
TABLE 157.REST OF ASIA-PACIFIC CRYPTOCURRENCY MARKET REVENUE, BY PROCESS, 2020–2030 ($MILLION)
TABLE 158.REST OF ASIA-PACIFIC CRYPTOCURRENCY MARKET REVENUE, BY TYPE, 2020–2030 ($MILLION)
TABLE 159.REST OF ASIA-PACIFIC CRYPTOCURRENCY MARKET REVENUE, BY END USE INDUSTRY, 2020–2030 ($MILLION)
TABLE 160.REST OF ASIA-PACIFIC CRYPTOCURRENCY MARKET, BY HARDWARE TYPE, 2020–2030 ($MILLION)
TABLE 161.REST OF ASIA-PACIFIC CRYPTOCURRENCY HARDWARE MARKET, BY ASIC TYPE, 2020–2030 ($MILLION)
TABLE 162.REST OF ASIA-PACIFIC CRYPTOCURRENCY MARKET, BY SOFTWARE TYPE, 2020–2030 ($MILLION)
TABLE 163.LAMEA CRYPTOCURRENCY MARKET REVENUE, BY OFFERING, 2020–2030 ($MILLION)
TABLE 164.LAMEA CRYPTOCURRENCY MARKET REVENUE, BY PROCESS, 2020–2030 ($MILLION)
TABLE 165.LAMEA CRYPTOCURRENCY MARKET REVENUE, BY TYPE, 2020–2030 ($MILLION)
TABLE 166.LAMEA CRYPTOCURRENCY MARKET REVENUE, BY END USE INDUSTRY, 2020–2030 ($MILLION)
TABLE 167.LAMEA CRYPTOCURRENCY MARKET, BY HARDWARE TYPE, 2020–2030 ($MILLION)
TABLE 168.LAMEA CRYPTOCURRENCY HARDWARE MARKET, BY ASIC TYPE, 2020–2030 ($MILLION)
TABLE 169.LAMEA CRYPTOCURRENCY MARKET, BY SOFTWARE TYPE, 2020–2030 ($MILLION)
TABLE 170.LAMEA CRYPTOCURRENCY MARKET REVENUE, BY COUNTRY, 2020–2030 ($MILLION)
TABLE 171.LATIN AMERICA CRYPTOCURRENCY MARKET REVENUE, BY OFFERING, 2020–2030 ($MILLION)
TABLE 172.LATIN AMERICA CRYPTOCURRENCY MARKET REVENUE, BY PROCESS, 2020–2030 ($MILLION)
TABLE 173.LATIN AMERICA CRYPTOCURRENCY MARKET REVENUE, BY TYPE, 2020–2030 ($MILLION)
TABLE 174.LATIN AMERICA CRYPTOCURRENCY MARKET REVENUE, BY END USE INDUSTRY, 2020–2030 ($MILLION)
TABLE 175.LATIN AMERICA CRYPTOCURRENCY MARKET, BY HARDWARE TYPE, 2020–2030 ($MILLION)
TABLE 176.LATIN AMERICA CRYPTOCURRENCY HARDWARE MARKET, BY ASIC TYPE, 2020–2030 ($MILLION)
TABLE 177.LATIN AMERICA CRYPTOCURRENCY MARKET, BY SOFTWARE TYPE, 2020–2030 ($MILLION)
TABLE 178.MIDDLE EAST CRYPTOCURRENCY MARKET REVENUE, BY OFFERING, 2020–2030 ($MILLION)
TABLE 179.MIDDLE EAST CRYPTOCURRENCY MARKET REVENUE, BY PROCESS, 2020–2030 ($MILLION)
TABLE 180.MIDDLE EAST CRYPTOCURRENCY MARKET REVENUE, BY TYPE, 2020–2030 ($MILLION)
TABLE 181.MIDDLE EAST CRYPTOCURRENCY MARKET REVENUE, BY END USE INDUSTRY, 2020–2030 ($MILLION)
TABLE 182.MIDDLE EAST CRYPTOCURRENCY MARKET, BY HARDWARE TYPE, 2020–2030 ($MILLION)
TABLE 183.MIDDLE EAST CRYPTOCURRENCY HARDWARE MARKET, BY ASIC TYPE, 2020–2030 ($MILLION)
TABLE 184.MIDDLE EAST CRYPTOCURRENCY MARKET, BY SOFTWARE TYPE, 2020–2030 ($MILLION)
TABLE 185.AFRICA CRYPTOCURRENCY MARKET REVENUE, BY OFFERING, 2020–2030 ($MILLION)
TABLE 186.AFRICA CRYPTOCURRENCY MARKET REVENUE, BY PROCESS, 2020–2030 ($MILLION)
TABLE 187.AFRICA CRYPTOCURRENCY MARKET REVENUE, BY TYPE, 2020–2030 ($MILLION)
TABLE 188.AFRICA CRYPTOCURRENCY MARKET REVENUE, BY END USE INDUSTRY, 2020–2030 ($MILLION)
TABLE 189.AFRICA CRYPTOCURRENCY MARKET, BY HARDWARE TYPE, 2020–2030 ($MILLION)
TABLE 190.AFRICA CRYPTOCURRENCY HARDWARE MARKET, BY ASIC TYPE, 2020–2030 ($MILLION)
TABLE 191.AFRICA CRYPTOCURRENCY MARKET, BY SOFTWARE TYPE, 2020–2030 ($MILLION)
TABLE 192.ADVANCED MICRO DEVICES, INC.: KEY EXECUTIVES
TABLE 193.ADVANCED MICRO DEVICES, INC.: COMPANY SNAPSHOT
TABLE 194.ADVANCED MICRO DEVICES, INC.: OPERATING SEGMENTS
TABLE 195.ADVANCED MICRO DEVICES, INC.: PRODUCT PORTFOLIO
TABLE 196.BITFURY GROUP LIMITED: KEY EXECUTIVES
TABLE 197.BITFURY GROUP LIMITED: COMPANY SNAPSHOT
TABLE 198.BITFURY GROUP LIMITED: PRODUCT PORTFOLIO
TABLE 199.BITMAIN TECHNOLOGIES HOLDING COMPANY :KEY EXECUTIVES
TABLE 200.BITMAIN TECHNOLOGIES HOLDING COMPANY: COMPANY SNAPSHOT
TABLE 201.BITMAIN TECHNOLOGIES HOLDING COMPANY: PRODUCT PORTFOLIO
TABLE 202.COINCHECK, INC.: KEY EXECUTIVES
TABLE 203.COINCHECK, INC.: COMPANY SNAPSHOT
TABLE 204.COINCHECK, INC.: PRODUCT PORTFOLIO
TABLE 205.INTEL CORPORATION: KEY EXECUTIVES
TABLE 206.INTEL CORPORATION: COMPANY SNAPSHOT
TABLE 207.INTEL CORPORATION: OPERATING SEGMENTS
TABLE 208.INTEL CORPORATION: PRODUCT PORTFOLIO
TABLE 209.LEDGER SAS: KEY EXECUTIVES
TABLE 210.LEDGER SAS: COMPANY SNAPSHOT
TABLE 211.LEDGER SAS: PRODUCT PORTFOLIO
TABLE 212.NVIDIA CORPORATION: KEY EXECUTIVES
TABLE 213.NVIDIA CORPORATION: COMPANY SNAPSHOT
TABLE 214.NVIDIA CORPORATION: OPERATING SEGMENTS
TABLE 215.NVIDIA CORPORATION: PRODUCT PORTFOLIO
TABLE 216.RIPPLE: KEY EXECUTIVES
TABLE 217.RIPPLE: COMPANY SNAPSHOT
TABLE 218.RIPPLE: PRODUCT PORTFOLIO
TABLE 219.XILINX: KEY EXECUTIVES
TABLE 220.XILINX: COMPANY SNAPSHOT
TABLE 221.XILINX: PRODUCT PORTFOLIO
TABLE 222.XAPO HOLDINGS LIMITED, INC.:KEY EXECUTIVES
TABLE 223.XAPO HOLDINGS LIMITED: COMPANY SNAPSHOT
TABLE 224.XAPO HOLDINGS LIMITED.: PRODUCT PORTFOLIO
LIST OF FIGURES
FIGURE 01.KEY MARKET SEGMENTS
FIGURE 02.CRYPTOCURRENCY MARKET SNAPSHOT, BY SEGMENTATION, 2020–2030
FIGURE 03.CRYPTOCURRENCY MARKET SNAPSHOT, BY REGION, 2020–2030
FIGURE 04.CRYPTOCURRENCY MARKET: TOP IMPACTING FACTOR
FIGURE 05.TOP INVESTMENT POCKETS
FIGURE 06.MODERATE BARGAINING POWER OF SUPPLIERS
FIGURE 07.MODERATE POWER OF BUYERS
FIGURE 08.MODERATE THREAT OF SUBSTITUTES
FIGURE 09.HIGH THREAT OF NEW ENTRANTS
FIGURE 10.HIGH COMPETITIVE RIVALRY
FIGURE 11.TOTAL MARKET CAPITALIZATION DOMINANCE 2020 (%)
FIGURE 12.CRYPTOCURRENCY MARKET, BY OFFERING, 2020–2030
FIGURE 13.COMPARATIVE COUNTRY ANALYSIS OF CRYPTOCURRENCY MARKET FOR HARDWARE, 2020 & 2030 (%)
FIGURE 14.CRYPTOCURRENCY FOR HARDWARE, BY TYPE, 2020–2030
FIGURE 15.COMPARATIVE SHARE ANALYSIS OF CRYPTOCURRENCY MARKET REVENUE FOR ASIC, BY COUNTRY, 2020 & 2030(%)
FIGURE 16.CRYPTOCURRENCY MARKET, BY ASIC TYPE, 2020–2030
FIGURE 17.COMPARATIVE COUNTRY ANALYSIS OF CRYPTOCURRENCY MARKET FOR SOFTWARE, 2020 & 2030 (%)
FIGURE 18.CRYPTOCURRENCY FOR SOFTWARE SOLUTION, BY TYPE, 2020–2030
FIGURE 19.CRYPTOCURRENCY MARKET, BY PROCESS, 2020–2030
FIGURE 20.COMPARATIVE COUNTRY ANALYSIS OF CRYPTOCURRENCYMARKET FOR MINING, 2020 & 2030 (%)
FIGURE 21.COMPARATIVE COUNTRY ANALYSIS OF CRYPTOCURRENCY MARKET FOR TRANSACTION, 2020 & 2030 (%)
FIGURE 22.CRYPTOCURRENCY MARKET, BY TYPE, 2020–2030
FIGURE 23.COMPARATIVE COUNTRY ANALYSIS OF CRYPTOCURRENCYMARKET FOR BITCOIN (BTC), 2020 & 2030 (%)
FIGURE 24.COMPARATIVE COUNTRY ANALYSIS OF CRYPTOCURRENCYMARKET FOR ETHEREUM (ETH), 2020 & 2030 (%)
FIGURE 25.COMPARATIVE COUNTRY ANALYSIS OF CRYPTOCURRENCY MARKET FOR TETHER (USDT), 2020 & 2030 (%)
FIGURE 26.COMPARATIVE COUNTRY ANALYSIS OF CRYPTOCURRENCY MARKET FOR BINANCE COIN (BNB), 2020 & 2030 (%)
FIGURE 27.COMPARATIVE COUNTRY ANALYSIS OF CRYPTOCURRENCYMARKET FOR CARDANO (ADA), 2020 & 2030 (%)
FIGURE 28.COMPARATIVE COUNTRY ANALYSIS OF CRYPTOCURRENCYMARKET FOR RIPPLE (XRP), 2020 & 2030 (%)
FIGURE 29.COMPARATIVE COUNTRY ANALYSIS OF CRYPTOCURRENCYMARKET FOR OTHERS, 2020 & 2030 (%)
FIGURE 30.CRYPTOCURRENCY MARKET, BY END USE INDUSTRY, 2020–2030
FIGURE 31.COMPARATIVE COUNTRY ANALYSIS OF CRYPTOCURRENCYMARKET FOR TRADING, 2020 & 2030 (%)
FIGURE 32.COMPARATIVE COUNTRY ANALYSIS OF CRYPTOCURRENCYMARKET FOR RETAIL & E-COMMERCE, 2020 & 2030 (%)
FIGURE 33.COMPARATIVE COUNTRY ANALYSIS OF CRYPTOCURRENCYMARKET FOR BANKING, 2020 & 2030 (%)
FIGURE 34.COMPARATIVE COUNTRY ANALYSIS OF CRYPTOCURRENCYMARKET FOR OTHERS, 2020 & 2030 (%)
FIGURE 35.U.S. CRYPTOCURRENCY MARKET REVENUE, 2020–2030 ($MILLION)
FIGURE 36.CANADA CRYPTOCURRENCY MARKET REVENUE, 2020–2030 ($MILLION)
FIGURE 37.UK CRYPTOCURRENCY MARKET REVENUE, 2020–2030 ($MILLION)
FIGURE 38.GERMANY CRYPTOCURRENCY MARKET REVENUE, 2020–2030 ($MILLION)
FIGURE 39.FRANCE CRYPTOCURRENCY MARKET REVENUE, 2020–2030 ($MILLION)
FIGURE 40.ITALY CRYPTOCURRENCY MARKET REVENUE, 2020–2030 ($MILLION)
FIGURE 41.SPAIN CRYPTOCURRENCY MARKET REVENUE, 2020–2030 ($MILLION)
FIGURE 42.THE NETHERLANDS CRYPTOCURRENCY MARKET REVENUE, 2020–2030 ($MILLION)
FIGURE 43.REST OF EUROPE CRYPTOCURRENCY MARKET REVENUE, 2020–2030 ($MILLION)
FIGURE 44.CHINA CRYPTOCURRENCY MARKET REVENUE, 2020–2030 ($MILLION)
FIGURE 45.JAPAN CRYPTOCURRENCY MARKET REVENUE, 2020–2030 ($MILLION)
FIGURE 46.INDIA CRYPTOCURRENCY MARKET REVENUE, 2020–2030 ($MILLION)
FIGURE 47.AUSTRALIA CRYPTOCURRENCY MARKET REVENUE, 2020–2030 ($MILLION)
FIGURE 48.SOUTH KOREA CRYPTOCURRENCY MARKET REVENUE, 2020–2030 ($MILLION)
FIGURE 49.REST OF ASIA-PACIFIC CRYPTOCURRENCY MARKET REVENUE, 2020–2030 ($MILLION)
FIGURE 50.LATIN AMERICA CRYPTOCURRENCY MARKET REVENUE, 2020–2030 ($MILLION)
FIGURE 51.MIDDLE EAST CRYPTOCURRENCY MARKET REVENUE, 2020–2030 ($MILLION)
FIGURE 52.AFRICA CRYPTOCURRENCY MARKET REVENUE, 2020–2030 ($MILLION)
FIGURE 53.KEY PLAYER POSITIONING ANLYSIS
FIGURE 54.TOP WINNING STRATEGIES, BY YEAR, 2019–2021
FIGURE 55.TOP WINNING STRATEGIES, BY DEVELOPMENT, 2019-2021
FIGURE 56.TOP WINNING STRATEGIES, BY COMPANY, 2019-2021
FIGURE 57.COMPETITIVE DASHBOARD
FIGURE 58.COMPETITIVE DASHBOARD
FIGURE 59.COMPETITIVE HEATMAP OF KEY PLAYERS
FIGURE 60.R&D EXPENDITURE, 2018–2020 ($MILLION)
FIGURE 61.ADVANCED MICRO DEVICES, INC.: REVENUE, 2018–2020 ($MILLION)
FIGURE 62.ADVANCED MICRO DEVICES, INC.: REVENUE SHARE, BY SEGMENT, 2020 (%)
FIGURE 63.ADVANCED MICRO DEVICES, INC.: REVENUE SHARE, BY REGION, 2020 (%)
FIGURE 64.R&D EXPENDITURE, 2018–2020 ($MILLION)
FIGURE 65.INTEL CORPORATION: REVENUE, 2018–2020 ($MILLION)
FIGURE 66.INTEL CORPORATION: REVENUE SHARE, BY SEGMENT, 2020 (%)
FIGURE 67.INTEL CORPORATION: REVENUE SHARE, BY REGION, 2020 (%)
FIGURE 68.NVIDIA CORPORATION: REVENUE, 2019–2021 ($MILLION)
FIGURE 69.NVIDIA CORPORATION: REVENUE SHARE, BY SEGMENT, 2021 (%)
FIGURE 70.NVIDIA CORPORATION: REVENUE SHARE, BY REGION, 2021 (%)
FIGURE 71.R&D EXPENDITURE, 2019–2021 ($MILLION)
FIGURE 72.XILINX: REVENUE, 2019–2011 ($MILLION)
FIGURE 73.XILINX: REVENUE SHARE, BY REGION, 2021 (%)
$6169
$6930
$10665
HAVE A QUERY?
OUR CUSTOMER

SIMILAR REPORTS