
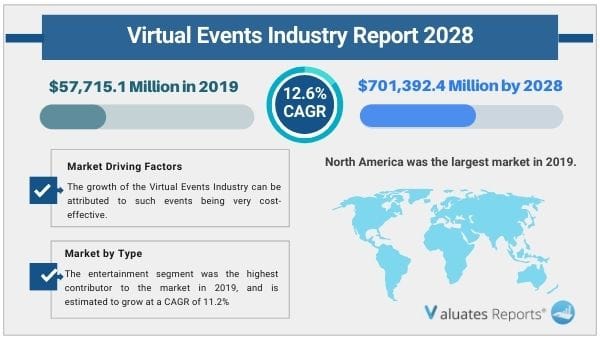
The global virtual events industry size was valued at $57,715.1 million in 2019, and is projected to reach $701,392.4 million by 2028, registering a Compound Annual Growth Rate (CAGR) of 12.6% from 2021 to 2028. The entertainment segment was the highest contributor to the market in 2019, and is estimated to grow at a CAGR of 11.2% during the forecast period. North America held a leading position in the global market in 2019, and is expected to maintain its dominance in the future.
The COVID -19 pandemic and the imposition of the lockdown and social distancing norm has been very beneficial to the Virtual Events Industry. Businesses all around the globe had been forced to use virtual channels of communication for purposes such as meetings, live showcases, product reveals, and more. As a result, the adoption of virtual events as a go to communication platform has been phenomenal.
Virtual events are digitally simulated proceedings such as meetings and conferences using web-based platforms that allow people to share information & discuss and solve problems virtually. Virtual webinar and conferences are held for the same reasons as that of the live events, for instance, to deliver a company’s message to drive leads & revenue and build loyalty lifetime value. The Virtual Events Industry consists of organizers and suppliers that deal in the management and delivery of virtual conference, tradeshow/exhibition, webinar, company meetings, and other related events held to achieve a range of professional & business objectives. Virtual events are less expensive to run as compared to live events. According to the event planner, Wild Apricot, the number of organizations who were planning to run virtual event in 2019 has doubled in 2020, owing to the COVID-19 pandemic.
The growth of the Virtual Events Industry can be attributed to such events being very cost-effective. The cost-efficiency makes way to bring in large number of attendees from all over the globe to a purposeful gathering. Thus, increase in popularity of digitally simulated gatherings among event organizers and attendees due to their time efficacy is likely to fuel the market growth during the forecast period. Furthermore, virtual events help organizations reduce the overall cost associated with organizing a physical seminar, conference, or meeting as planners may save on venue, staff, meals, attendee’s accommodation, and travel costs. Hence, organizations of all sizes are adopting virtual events instead of preferring physical events, as they are quick to arrange, inexpensive, and bring the relevant people for events. Thus, the abovementioned factors act as the key driving forces of the virtual events sector. However, virtual event is completely dependent on technology use. An event app or website with bad user experience (UX), a malfunctioning camera, or weak internet strength can all ruin the virtual event experience. These factors might lead to failure of virtual events; thereby, hampering the Virtual Events Industry growth.
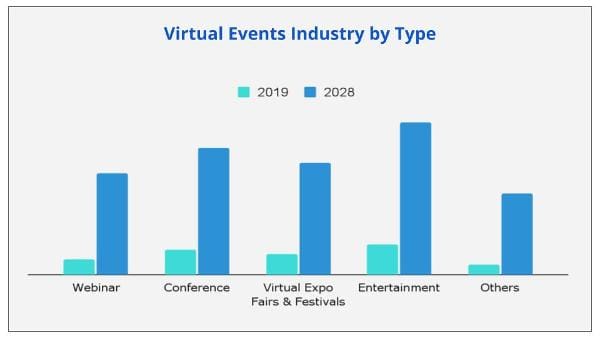
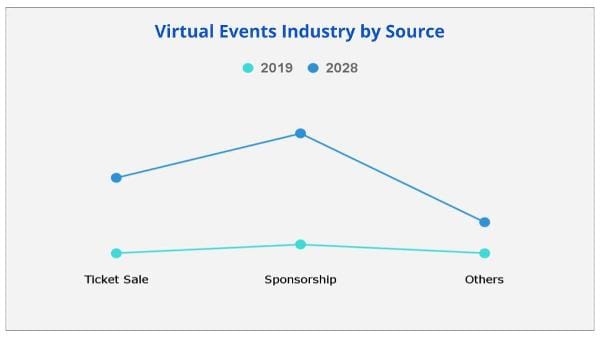
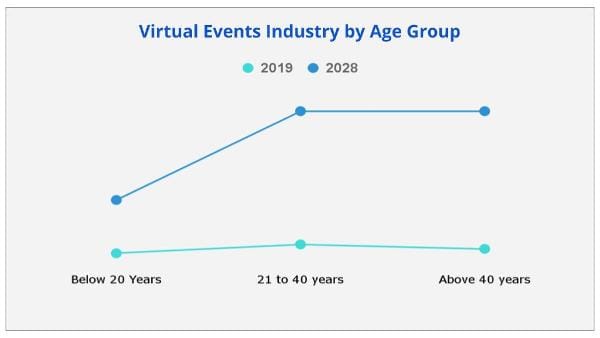
The Virtual Events Industry has been segmented on the basis of type, source, age group, and region. Based on type, the market is divided into webinar, conference, virtual expo fairs & festivals, entertainment, and others. On the basis of source, it is segmented into ticket sale, sponsorship, and others. Based on the age group, the market is classified into below 20 years, 21 to 40 years, and above 40 years.
Furthermore, it includes the revenue generated from the sales of virtual events across North America (the U.S., Canada, and Mexico), Europe (Germany, the UK, France, Italy, Spain, Ireland, and rest of Europe), Asia-Pacific (China, India, Japan, Australia, South Korea, and rest of Asia-Pacific), and LAMEA (Latin America, the Middle East, and Africa)
Based on the Virtual Events Industry analysis by type, the entertainment segment was the largest segment in 2019, and is expected to remain dominant throughout the forecast period. This is attributed to the fact that virtual entertainment events are responsible for providing the general public with a variety of entertainment possibilities, including musical entertainment, live entertainment, mass media entertainment, and electronic entertainment. Thus, increase in popularity of these entertainment events is one of the key factors driving the entertainment segment growth.
Based on the Virtual Events Industry forecast by source, the sponsorship segment was the largest segment in 2019, and is expected to remain dominant throughout the forecast period as sponsorship serves as a powerful and effective marketing tool to increase and reinforce brand awareness among targeted niche markets. Moreover, it is the key for strong marketing, owing to the fact that most of the events use sponsorship support to offer more exciting programs and to help defray rising costs.
Based on age group, the 21 to 40 years segment was the largest segment in 2019, and is expected to remain dominant throughout the forecast period. This is attributed to the fact that this age group is majorly active in events such as exhibitions, conferences, seminars, and music concerts; thereby, augmenting the market growth.
By region, North America was the largest market in 2019, in terms of revenue generation, garnering almost one-third of the global Virtual Events Industry share. U.S. is further expected to expand at notable growth rate exhibiting the highest share throughout the forecast period. However, Asia-Pacific and LAMEA in the Virtual Events Industry are expected to witness notable growth during the forecast period. The growth in these regions can be attributed to improving business environment in the region.
Key players in the Virtual Events Industry have relied on strategies such as product launch and business expansion to expand their market share and to stay relevant in the global market. The key players in the virtual events industry profiled in the report are American Program Bureau Inc., Pace Digital, Revolution CMES, ShowCase Events, Target Exhibitions, TCJ Management Co. Ltd, The Collaborative Exchange, VietApps Co., Ltd., Morph Digital Solutions Private Limited, and London Filmed.
|
Report Metric |
Details |
|
Report Name |
Virtual Events Market |
|
The market size in 2019 |
USD 57,715.1 Million |
|
The revenue forecast in 2028 |
USD 701,392.4 Million |
|
Growth Rate |
Compound Annual Growth Rate (CAGR) of 12.6% from 2021 to 2028 |
|
Market size available for years |
2021-2028 |
|
Forecast units |
Value (USD) |
|
Segments covered |
Type, Source, and Age Group |
|
Report coverage |
Revenue & volume forecast, company share, competitive landscape, growth factors, and trends |
|
Geographic regions covered |
North America, Europe, Asia Pacific, Latin America, Middle East & Africa |
Ans. The global virtual events industry size was valued at $57,715.1 million in 2019, and is projected to reach $701,392.4 million by 2028, registering a Compound Annual Growth Rate (CAGR) of 12.6% from 2021 to 2028.
Ans. Increase in popularity of digitally simulated gatherings among event organizers and attendees due to their time efficacy is likely to fuel the market growth during the forecast period.
Ans. North America was the largest market share in 2019, in terms of revenue generation.
Ans. By Type, The entertainment segment was the highest contributor to the market in 2019, and is estimated to grow at a CAGR of 11.2% during the forecast period.
Ans. The key players in the virtual events industry profiled in the report are American Program Bureau Inc., Pace Digital, Revolution CMES, ShowCase Events, Target Exhibitions, TCJ Management Co. Ltd, The Collaborative Exchange, VietApps Co., Ltd., Morph Digital Solutions Private Limited, and London Filmed.
Table of Content
CHAPTER 1:INTRODUCTION
1.1.Report description
1.2.Key benefits for stakeholders
1.3.Key market segments
1.4.Research methodology
1.4.1.Secondary research
1.4.2.Primary research
1.5.Analyst tools and models
CHAPTER 2:EXECUTIVE SUMMARY
2.1.Virtual Events Industry snapshot
2.2.Key findings of the study
2.3.CXO perspective
CHAPTER 3:MARKET OVERVIEW
3.1.Market definition and scope
3.2.Key findings
3.2.1.Top investment pockets
3.3.Porter's five forces analysis
3.4.Market dynamics
3.4.1.Drivers
3.4.1.1.Increase in trend of work-from-home policy
3.4.1.2.Rise in sponsorship for virtual events
3.4.1.3.Low operational cost involved in organizing virtual events
3.4.1.4.Increase in globalization of businesses
3.4.2.Restraints
3.4.2.1.Lack of awareness among audience about technology
3.4.3.Opportunity
3.4.3.1.Technological advancements in the virtual event industry
3.5.COVID-19 impact analysis
3.5.1.Introduction
3.5.2.Impact on Virtual Events Industry
3.6.Value chain analysis
3.7.Top Impacting factor
CHAPTER 4:VIRTUAL EVENTS INDUSTRY, BY TYPE
4.1.Overview
4.1.1.Market size and forecast
4.2.Webinar
4.2.1.Key market trends, growth factors, and opportunities
4.2.2.Market size and forecast, by region
4.2.3.Market size and forecast, by country
4.3.Conference
4.3.1.Key market trends, growth factors, and opportunities
4.3.2.Market size and forecast, by region
4.3.3.Market size and forecast, by country
4.4.Virtual expo, fairs, and festivals
4.4.1.Key market trends, growth factors, and opportunities
4.4.2.Market size and forecast, by region
4.4.3.Market size and forecast, by country
4.5.Entertainment
4.5.1.Key market trends, growth factors, and opportunities
4.5.2.Market size and forecast, by region
4.5.3.Market size and forecast, by country
4.6.Others
4.6.1.Key market trends, growth factors, and opportunities
4.6.2.Market size and forecast, by region
4.6.3.Market size and forecast, by country
CHAPTER 5:VIRTUAL EVENTS INDUSTRY, BY SOURCE
5.1.Overview
5.1.1.Market size and forecast
5.2.Ticket sale
5.2.1.Key market trends, growth factors, and opportunities
5.2.2.Market size and forecast, by region
5.2.3.Market size and forecast, by country
5.3.Sponsorship
5.3.1.Key market trends, growth factors, and opportunities
5.3.2.Market size and forecast, by region
5.3.3.Market size and forecast, by country
5.4.Others
5.4.1.Key market trends, growth factors, and opportunities
5.4.2.Market size and forecast, by region
5.4.3.Market size and forecast, by country
CHAPTER 6:VIRTUAL EVENTS INDUSTRY, BY AGE GROUP
6.1.Overview
6.1.1.Market size and forecast
6.2.Below 20 years
6.2.1.Key market trends, growth factors, and opportunities
6.2.2.Market size and forecast, by region
6.2.3.Market size and forecast, by country
6.3.21 to 40 years
6.3.1.Key market trends, growth factors, and opportunities
6.3.2.Market size and forecast, by region
6.3.3.Market size and forecast, by country
6.4.Above 40 years
6.4.1.Key market trends, growth factors, and opportunities
6.4.2.Market size and forecast, by region
6.4.3.Market size and forecast, by country
CHAPTER 7:VIRTUAL EVENTS INDUSTRY, BY REGION
7.1.Overview
7.1.1.Market size and forecast, by region
7.2.North America
7.2.1.Key market trends, growth factors, and opportunities
7.2.2.Market size and forecast, by type
7.2.3.Market size and forecast, by source
7.2.4.Market size and forecast, by age group
7.2.5.Market size and forecast, by country
7.2.6.U.S.
7.2.6.1.Market size and forecast, by type
7.2.6.2.Market size and forecast, by source
7.2.6.3.Market size and forecast, by age group
7.2.7.Canada
7.2.7.1.Market size and forecast, by type
7.2.7.2.Market size and forecast, by source
7.2.7.3.Market size and forecast, by age group
7.2.8.Mexico
7.2.8.1.Market size and forecast, by type
7.2.8.2.Market size and forecast, by source
7.2.8.3.Market size and forecast, by age group
7.3.Europe
7.3.1.Key market trends, growth factors, and opportunities
7.3.2.Market size and forecast, by type
7.3.3.Market size and forecast, by source
7.3.4.Market size and forecast, by age group
7.3.5.Market size and forecast, by country
7.3.6.Germany
7.3.6.1.Market size and forecast, by type
7.3.6.2.Market size and forecast, by source
7.3.6.3.Market size and forecast, by age group
7.3.7.UK
7.3.7.1.Market size and forecast, by type
7.3.7.2.Market size and forecast, by source
7.3.7.3.Market size and forecast, by age group
7.3.8.France
7.3.8.1.Market size and forecast, by type
7.3.8.2.Market size and forecast, by source
7.3.8.3.Market size and forecast, by age group
7.3.9.Italy
7.3.9.1.Market size and forecast, by type
7.3.9.2.Market size and forecast, by source
7.3.9.3.Market size and forecast, by age group
7.3.10.Spain
7.3.10.1.Market size and forecast, by type
7.3.10.2.Market size and forecast, by source
7.3.10.3.Market size and forecast, by age group
7.3.11.Ireland
7.3.11.1.Market size and forecast, by type
7.3.11.2.Market size and forecast, by source
7.3.11.3.Market size and forecast, by age group
7.3.12.Rest of Europe
7.3.12.1.Market size and forecast, by type
7.3.12.2.Market size and forecast, by source
7.3.12.3.Market size and forecast, by age group
7.4.Asia-Pacific
7.4.1.Key market trends, growth factors, and opportunities
7.4.2.Market size and forecast, by type
7.4.3.Market size and forecast, by source
7.4.4.Market size and forecast, by age group
7.4.5.Market size and forecast, by country
7.4.6.China
7.4.6.1.Market size and forecast, by type
7.4.6.2.Market size and forecast, by source
7.4.6.3.Market size and forecast, by age group
7.4.7.India
7.4.7.1.Market size and forecast, by type
7.4.7.2.Market size and forecast, by source
7.4.7.3.Market size and forecast, by age group
7.4.8.Japan
7.4.8.1.Market size and forecast, by type
7.4.8.2.Market size and forecast, by source
7.4.8.3.Market size and forecast, by age group
7.4.9.South Korea
7.4.9.1.Market size and forecast, by type
7.4.9.2.Market size and forecast, by source
7.4.9.3.Market size and forecast, by age group
7.4.10.Australia
7.4.10.1.Market size and forecast, by type
7.4.10.2.Market size and forecast, by source
7.4.10.3.Market size and forecast, by age group
7.4.11.Rest of Asia-Pacific
7.4.11.1.Market size and forecast, by type
7.4.11.2.Market size and forecast, by source
7.4.11.3.Market size and forecast, by age group
7.5.LAMEA
7.5.1.Key market trends, growth factors, and opportunities
7.5.2.Market size and forecast, by type
7.5.3.Market size and forecast, by source
7.5.4.Market size and forecast, by age group
7.5.5.Market size and forecast, by country
7.5.6.Latin America
7.5.6.1.Market size and forecast, by type
7.5.6.2.Market size and forecast, by source
7.5.6.3.Market size and forecast, by age group
7.5.7.Middle East
7.5.7.1.Market size and forecast, by type
7.5.7.2.Market size and forecast, by source
7.5.7.3.Market size and forecast, by age group
7.5.8.Africa
7.5.8.1.Market size and forecast, by type
7.5.8.2.Market size and forecast, by source
7.5.8.3.Market size and forecast, by age group
CHAPTER 8:COMPETITION LANDSCAPE
8.1.Top winning strategies
8.2.Product mapping
8.3.Competitive dashboard
8.4.Competitive heat map
8.5.Key developments
8.5.1.Acquisition
8.5.2.Business Expansion
8.5.3.Product Launch
CHAPTER 9:COMPANY PROFILES
9.1.AMERICAN PROGRAM BUREAU, INC.
9.1.1.Company overview
9.1.2.Key executive
9.1.3.Company snapshot
9.1.4.Product portfolio
9.2.PACE DIGITAL
9.2.1.Company overview
9.2.2.Company snapshot
9.2.3.Product portfolio
9.2.4.Key strategic moves and developments
9.3.REVOLUTION CMES
9.3.1.Company overview
9.3.2.Company snapshot
9.3.3.Product portfolio
9.4.SHOWCASE EVENTS
9.4.1.Company overview
9.4.2.Key Executives
9.4.3.Company snapshot
9.4.4.Product portfolio
9.5.TARGET EXHIBITIONS
9.5.1.Company overview
9.5.2.Key Executives
9.5.3.Company snapshot
9.5.4.Product portfolio
9.6.TCJ MANAGEMENT CO. LTD
9.6.1.Company overview
9.6.2.Key Executive
9.6.3.Company snapshot
9.6.4.Product portfolio
9.7.THE COLLABORATIVE EXCHANGE
9.7.1.Company overview
9.7.2.Key Executives
9.7.3.Company snapshot
9.7.4.Product portfolio
9.8.VIETAPPS CO., LTD.
9.8.1.Company overview
9.8.2.Company snapshot
9.8.3.Product portfolio
9.9.MORPH DIGITAL SOLUTIONS PRIVATE LIMITED
9.9.1.Company overview
9.9.2.Key Executives
9.9.3.Company snapshot
9.9.4.Product portfolio
9.10.LONDON FILMED
9.10.1.Company overview
9.10.2.Company snapshot
9.10.3.Product portfolio
List of Tables & Figures
Table 01.Virtual Events Industry, By Type, 2019-2028 ($Million)
Table 02.Webinar Virtual Events Industry, By Region, 2019-2028 ($Million)
Table 03.Conference Virtual Events Industry, By Region, 2019-2028 ($Million)
Table 04.Virtual Expo, Fairs And Festivals Virtual Events Industry, By Region, 2019-2028 ($Million)
Table 05.Entertainment Virtual Events Industry, By Region, 2019-2028 ($Million)
Table 06.Others Virtual Events Industry, By Region, 2019-2028 ($Million)
Table 07.Virtual Events Industry, By Source, 2019-2028 ($Million)
Table 08.Ticket Sale Virtual Events Industry, By Region, 2019-2028 ($Million)
Table 09.Sponsorship Virtual Events Industry, By Region, 2019-2028 ($Million)
Table 10.Others Virtual Events Industry, By Region, 2019-2028 ($Million)
Table 11.Virtual Events Industry, By Age Group, 2019-2028 ($Million)
Table 12.Virtual Events Industry For Below 20 Years, By Region, 2019-2028 ($Million)
Table 13.Virtual Events Industry For 21 To 40 Years, By Region, 2019-2028 ($Million)
Table 14.Virtual Events Industry For Above 40 Years, By Region, 2019-2028 ($Million)
Table 15.Virtual Events Industry, By Region, 2019-2028 ($Million)
Table 16.North America Virtual Events Industry, By Type, 2019-2028 ($Million)
Table 17.North America Virtual Events Industry, By Source, 2019-2028 ($Million)
Table 18.North America Virtual Events Industry, By Age Group, 2019-2028 ($Million)
Table 19.North America Virtual Events Industry, By Source, 2019-2028 ($Million)
Table 20.U.S. Virtual Events Industry, By Type, 2019-2028 ($Million)
Table 21.U.S. Virtual Events Industry, By Source, 2019-2028 ($Million)
Table 22.U.S. Virtual Events Industry, By Age Group, 2019-2028 ($Million)
Table 23.Canada Virtual Events Industry, By Type, 2019-2028 ($Million)
Table 24.Canada Virtual Events Industry, By Source, 2019-2028 ($Million)
Table 25.Canada Virtual Events Industry, By Age Group, 2019-2028 ($Million)
Table 26.Mexico Virtual Events Industry, By Type, 2019-2028 ($Million)
Table 27.Mexico Virtual Events Industry, By Source, 2019-2028 ($Million)
Table 28.Mexico Virtual Events Industry, By Age Group, 2019-2028 ($Million)
Table 29.Europe Virtual Events Industry, By Type, 2019-2028 ($Million)
Table 30.Europe Virtual Events Industry, By Source, 2019-2028 ($Million)
Table 31.Europe Virtual Events Industry, By Age Group, 2019-2028 ($Million)
Table 32.Europe Virtual Events Industry, By Country, 2019-2028 ($Million)
Table 33.Germany Virtual Events Industry, By Type, 2019-2028 ($Million)
Table 34.Germany Virtual Events Industry, By Source, 2019-2028 ($Million)
Table 35.Germany Virtual Events Industry, By Age Group, 2019-2028 ($Million)
Table 36.Uk Virtual Events Industry, By Type, 2019-2028 ($Million)
Table 37.Uk Virtual Events Industry, By Source, 2019-2028 ($Million)
Table 38.Uk Virtual Events Industry, By Age Group, 2019-2028 ($Million)
Table 39.France Virtual Events Industry, By Type, 2019-2028 ($Million)
Table 40.France Virtual Events Industry, By Source, 2019-2028 ($Million)
Table 41.France Virtual Events Industry, By Age Group, 2019-2028 ($Million)
Table 42.Italy Virtual Events Industry, By Type, 2019-2028 ($Million)
Table 43.Italy Virtual Events Industry, By Source, 2019-2028 ($Million)
Table 44.Italy Virtual Events Industry, By Age Group, 2019-2028 ($Million)
Table 45.Spain Virtual Events Industry, By Type, 2019-2028 ($Million)
Table 46.Spain Virtual Events Industry, By Source, 2019-2028 ($Million)
Table 47.Spain Virtual Events Industry, By Age Group, 2019-2028 ($Million)
Table 48.Ireland Virtual Events Industry, By Type, 2019-2028 ($Million)
Table 49.Ireland Virtual Events Industry, By Source, 2019-2028 ($Million)
Table 50.Ireland Virtual Events Industry, By Age Group, 2019-2028 ($Million)
Table 51.Rest Of Europe Virtual Events Industry, By Type, 2019-2028 ($Million)
Table 52.Rest Of Europe Virtual Events Industry, By Source, 2019-2028 ($Million)
Table 53.Rest Of Europe Virtual Events Industry, By Age Group, 2019-2028 ($Million)
Table 54.Asia-Pacific Virtual Events Industry, By Type, 2019-2028 ($Million)
Table 55.Asia-Pacific Virtual Events Industry, By Source, 2019-2028 ($Million)
Table 56.Asia-Pacific Virtual Events Industry, By Age Group, 2019-2028 ($Million)
Table 57.Asia-Pacific Virtual Events Industry, By Country, 2019-2028 ($Million)
Table 58.China Virtual Events Industry, By Type, 2019-2028 ($Million)
Table 59.China Virtual Events Industry, By Source, 2019-2028 ($Million)
Table 60.China Virtual Events Industry, By Age Group, 2019-2028 ($Million)
Table 61.India Virtual Events Industry, By Type, 2019-2028 ($Million)
Table 62.India Virtual Events Industry, By Source, 2019-2028 ($Million)
Table 63.India Virtual Events Industry, By Age Group, 2019-2028 ($Million)
Table 64.Japan Virtual Events Industry, By Type, 2019-2028 ($Million)
Table 65.Japan Virtual Events Industry, By Source, 2019-2028 ($Million)
Table 66.Japan Virtual Events Industry, By Age Group, 2019-2028 ($Million)
Table 67.South Korea Virtual Events Industry, By Type, 2019-2028 ($Million)
Table 68.South Korea Virtual Events Industry, By Source, 2019-2028 ($Million)
Table 69.South Korea Virtual Events Industry, By Age Group, 2019-2028 ($Million)
Table 70.Australia Virtual Events Industry, By Type, 2019-2028 ($Million)
Table 71.Australia Virtual Events Industry, By Source, 2019-2028 ($Million)
Table 72.Australia Virtual Events Industry, By Age Group, 2019-2028 ($Million)
Table 73.Rest Of Asia-Pacific Virtual Events Industry, By Type, 2019-2028 ($Million)
Table 74.Rest Of Asia-Pacific Virtual Events Industry, By Source, 2019-2028 ($Million)
Table 75.Rest Of Asia-Pacific Virtual Events Industry, By Age Group, 2019-2028 ($Million)
Table 76.Lamea Virtual Events Industry, By Type, 2019-2028 ($Million)
Table 77.Lamea Virtual Events Industry, By Source, 2019-2028 ($Million)
Table 78.Lamea Virtual Events Industry, By Age Group, 2019-2028 ($Million)
Table 79.Lamea Virtual Events Industry, By Country, 2019-2028 ($Million)
Table 80.Latin America Virtual Events Industry, By Type, 2019-2028 ($Million)
Table 81.Latin America Virtual Events Industry, By Source, 2019-2028 ($Million)
Table 82.Latin America Virtual Events Industry, By Age Group, 2019-2028 ($Million)
Table 83.Middle East Virtual Events Industry, By Type, 2019-2028 ($Million)
Table 84.Middle East Virtual Events Industry, By Source, 2019-2028 ($Million)
Table 85.Middle East Virtual Events Industry, By Age Group, 2019-2028 ($Million)
Table 86.Africa Virtual Events Industry, By Type, 2019-2028 ($Million)
Table 87.Africa Virtual Events Industry, By Source, 2019-2028 ($Million)
Table 88.Africa Virtual Events Industry, By Age Group, 2019-2028 ($Million)
Table 89.American Program Bureau, Inc.: Key Executive
Table 90.American Program Bureau, Inc.: Company Snapshot
Table 91.American Program Bureau, Inc.: Product Portfolio
Table 92.Pace Digital: Company Snapshot
Table 93.Pace Digital: Product Portfolio
Table 94.Revolution Cmes: Company Snapshot
Table 95.Revolution Cmes: Product Portfolio
Table 96.Showcase Events: Key Executives
Table 97.Showcase Events: Company Snapshot
Table 98.Showcase Events: Product Portfolio
Table 99.Target Exhibitions: Key Executives
Table 100.Target Exhibitions: Company Snapshot
Table 101.Target Exhibitions: Product Portfolio
Table 102.Tcj Management Co. Ltd: Key Executive
Table 103.Tcj Management Co. Ltd: Company Snapshot
Table 104.Tcj Management Co. Ltd: Product Portfolio
Table 105.The Collaborative Exchange: Key Executives
Table 106.The Collaborative Exchange: Company Snapshot
Table 107.The Collaborative Exchange: Product Portfolio
Table 108.Vietapps Co., Ltd.: Company Snapshot
Table 109.Vietapps Co., Ltd.: Product Portfolio
Table 110.Morph Digital Solutions Private Limited: Key Executives
Table 111.Morph Digital Solutions Private Limited: Company Snapshot
Table 112.Morph Digital Solutions Private Limited: Product Portfolio
Table 113.London Filmed: Company Snapshot
Table 114.London Filmed: Product Portfolio
List Of Figures
Figure 01.Virtual Events Industry Segmentation
Figure 02.Virtual Events Industry, 2019–2027
Figure 03.Top Investment Pocket, By Country
Figure 04.Moderate Bargaining Power Of Suppliers
Figure 05.High Bargaining Power Of Buyers
Figure 06.High Threat Of New Entrants
Figure 07.Moderate Threat Of Substitutes
Figure 08.Moderate Intensity Of Competitive Rivalry
Figure 09.Virtual Events Industry: Drivers, Restraints, And Opportunities
Figure 10.Impact Of Covid-19 On Virtual Events Industry Forecast
Figure 11.Value Chain Analysis: Virtual Events Industry
Figure 12.Top Impacting Factor: Virtual Events Industry
Figure 13.Virtual Events Industry, By Type, 2019 (%)
Figure 14.Comparative Share Analysis Of Webinar Virtual Events Industry, By Country, 2019-2028 (%)
Figure 15.Comparative Share Analysis Of Conference Virtual Events Industry, By Country, 2019-2028 (%)
Figure 16.Comparative Share Analysis Of Virtual Expo, Fairs And Festivals Virtual Events Industry, By Country, 2019-2028 (%)
Figure 17.Comparative Share Analysis Of Entertainment Virtual Events Industry, By Country, 2019-2028 (%)
Figure 18.Comparative Share Analysis Of Others Virtual Events Industry, By Country, 2019-2028 (%)
Figure 19.Virtual Events Industry, By Source, 2019 (%)
Figure 20.Comparative Share Analysis Of Ticket Sale Virtual Events Industry, By Country, 2019-2028 (%)
Figure 21.Comparative Share Analysis Of Sponsorship Virtual Events Industry, By Country, 2019-2028 (%)
Figure 22.Comparative Share Analysis Of Others Virtual Events Industry, By Country, 2019-2028 (%)
Figure 23.Virtual Events Industry, By Age Group, 2019 (%)
Figure 24.Comparative Share Analysis Of Virtual Events Industry For Below 20 Years, By Country, 2019-2028 (%)
Figure 25.Comparative Share Analysis Of Virtual Events Industry For 21 To 40 Years, By Country, 2019-2028 (%)
Figure 26.Comparative Share Analysis Of Virtual Events Industry For Above 40 Years, By Country, 2019-2028 (%)
Figure 27.Virtual Events Industry, By Region, 2019 (%)
Figure 28.U.S. Virtual Events Industry Revenue, 2019–2027 ($Million)
Figure 29.Canada Virtual Events Industry Revenue, 2019–2027 ($Million)
Figure 30.Mexico Virtual Events Industry Revenue, 2019–2027 ($Million)
Figure 31.Germany Virtual Events Industry Revenue, 2019–2027 ($Million)
Figure 32.Uk Virtual Events Industry Revenue, 2019–2027 ($Million)
Figure 33.France Virtual Events Industry Revenue, 2019–2027 ($Million)
Figure 34.Italy Virtual Events Industry Revenue, 2019–2027 ($Million)
Figure 35.Spain Virtual Events Industry Revenue, 2019–2027 ($Million)
Figure 36.Ireland Virtual Events Industry Revenue, 2019–2027 ($Million)
Figure 37.Rest Of Europe Virtual Events Industry Revenue, 2019–2027 ($Million)
Figure 38.China Virtual Events Industry Revenue, 2019–2027 ($Million)
Figure 39.India Virtual Events Industry Revenue, 2019–2027 ($Million)
Figure 40.Japan Virtual Events Industry Revenue, 2019–2027 ($Million)
Figure 41.South Korea Virtual Events Industry Revenue, 2019–2027 ($Million)
Figure 42.Australia Virtual Events Industry Revenue, 2019–2027 ($Million)
Figure 43.Rest Of Asia-Pacific Virtual Events Industry Revenue, 2019–2027 ($Million)
Figure 44.Latin America Virtual Events Industry Revenue, 2019–2027 ($Million)
Figure 45.Middle East Virtual Events Industry Revenue, 2019–2027 ($Million)
Figure 46.Africa Virtual Events Industry Revenue, 2019–2027 ($Million)
Figure 47.Product Mapping Of Top 10 Key Players
Figure 48.Competitive Dashboard Of Top 10 Key Players
Figure 49.Competitive Heatmap Of Top 10 Key Player
$5769
$9995
HAVE A QUERY?
OUR CUSTOMER

Add to Cart
Add to Cart
Add to Cart
Add to Cart