
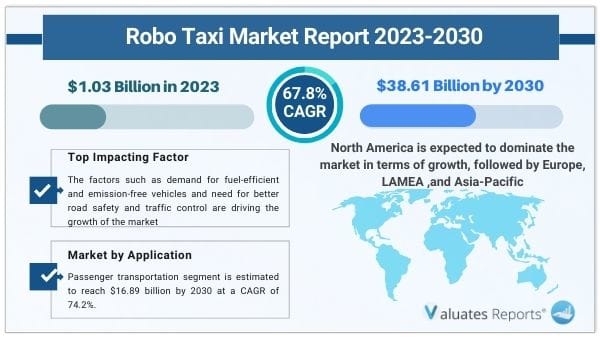
The global Robo taxi market is expected to be $1.03 billion in 2023 and is projected to reach $38.61 billion by 2030, registering a CAGR of 67.8% from 2023 to 2030. The Robo taxi business is predicted to rise in response to the rising demand for ride-hailing services and the need for ride-hailing companies to boost their profit margins. As a result of government efforts and increased expenditures by major participants in the automotive automation industry, the global Robo taxi market is rising. Furthermore, technological developments resulting from R&D conducted by a variety of startups and top players are likely to accelerate the adoption of autonomous vehicles, boosting the Robo taxi market's growth.
The goods transportation category is expected to be the largest contributor to the market, accounting for $0.61 billion in 2023 and growing at a CAGR of 70.5 percent to $21.71 billion by 2030. The passenger transportation industry is expected to grow at a CAGR of 74.2 percent to $16.89 billion by 2030. During the period 2021-2030, North America would have the highest CAGR of 29.6%.
Robo-Taxi is an autonomous car, operated for an e-hailing service. A Robo-Taxi, also known as a Robo-Cab, is a driverless taxi or a self-driving taxi. Its primary purpose is to eliminate the need for human chauffeur, which is a significant part of the operating costs of these types of services. With the use of Robo taxi, maximum fuel efficiency is obtained. It also reduces chances of accident. The rising emission concerns, increasing issues over road safety, and surging demand for ride-hailing services are the major factors fueling the robo taxi market. Robo-taxi requires a better and efficient artificial intelligence network to operate the vehicle which supplements the growth of the market across the globe. The increased automation in vehicles has led to the growth of autonomous vehicles across the globe, which has also fueled the robo taxi market.
The robot taxi industry is predicted to grow in response to the desire for a better driving experience and increased driving safety. The need for a human driver has lessened as a result of vehicle automation, lessening the danger of accidents caused by human error. A Robo-taxi is also equipped with a variety of sensors, including RADAR, LiDAR, and others, which improves the vehicle's efficiency and contributes to the global growth of the Robo taxi market.
According to The Washington Post in May 2021, around 5,000 independent contractors working for Lyft and Uber accounted for about USD 80 million in Economic Injury Disaster Loans during the COVID-19 epidemic. Demand for ridesharing/ride-hailing decreased by 80% as a result of the epidemic, suggesting that these companies couldn't afford to have a large number of drivers. As a result, companies are putting more emphasis on incorporating robot taxis into their fleets, which is expected to lower operating costs and increase profit margins. This, in turn, is projected to propel the Robo taxi sector forward.
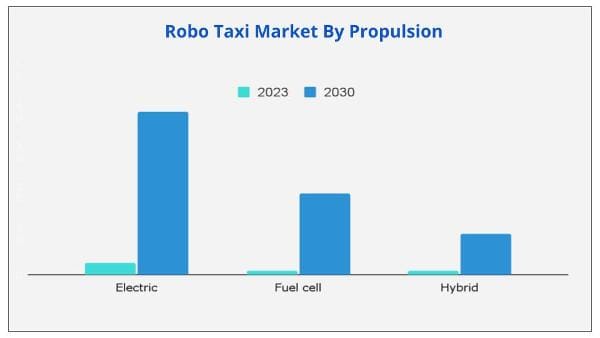
The Robo taxi market is predicted to see an increase in demand for fuel-efficient and emission-free vehicles. Demand for fuel-efficient and emission-free automobiles has increased all around the world as a result of the growing trend of vehicle automation. Manufacturers have been able to produce emission-free vehicles as a result of the increased demand, which is helping to fuel the growth of the Robo taxi industry. Robo-taxis are supposed to be completely self-contained, hence a more advanced and efficient fuel system is required. Furthermore, the introduction of electric and fuel cell vehicles has lessened their need for fossil fuels. This results in a reduction in pollution because they do not produce air pollutants.
The demand for improved road safety and traffic control is projected to propel the robot taxi market forward. Robo-taxis have a number of advantages over traditional cars in terms of safety and traffic congestion. An autonomous vehicle is equipped with a variety of sensors, including LiDAR, RADAR, camera, and GPS. Short-range sensors (which provide details of moving objects near the vehicle) and long-range sensors (which provide details of high-speed oncoming vehicles) help the vehicle detect any object or barrier in its path, lowering the likelihood of an accident.
Furthermore, some nations' governments are enacting rules to encourage autonomous vehicles, which is projected to accelerate the Robo taxi market's growth. The Self Drive Act, for example, establishes a much-needed federal safety framework to encourage self-driving technology and its potential to save lives on the road, improve mobility, and open up new economic opportunities across the country.
North America is expected to dominate the market in terms of growth, followed by Europe, LAMEA ,and Asia-Pacific. U.S. is expected to dominate the global robo taxi market share in 2021, and is projected to grow at a significant rate during the forecast period.
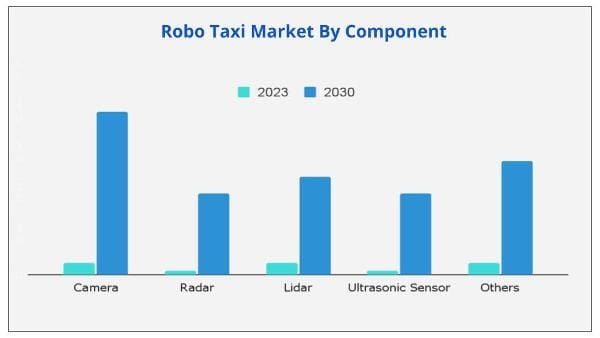
Based on application, the goods transportation segment is expected to dominate the global robo-taxi market in 2023, in terms of revenue. In addition, based on components, camera is expected to lead the market. At present, North America is the highest revenue contributor, and is expected to garner the highest revenue in the global market during the forecast period, followed by Europe, LAMEA and Asia-Pacific.
Key players including Waymo LLC (subsidiary of Alphabet Inc.), Cruise LLC (subsidiary of General Motor Company), Tesla, Nissan Motor Corporation, Lyft, Inc., Uber Technologies, Daimler AG, Ford Motor Company, Volkswagen AG and Volvo Group hold major market share.
Key Benefits for Stakeholders
|
Report Metric |
Details |
|
Report Name |
Robo Taxi Market |
|
The market size in 2023 |
USD 1.03 Billion |
|
The revenue forecast in 2030 |
USD 38.61 Billion |
|
Growth Rate |
CAGR of 67.8% from 2023 to 2030 |
|
Market size available for years |
2023 to 2030 |
|
Forecast units |
Value (USD) |
|
Segments covered |
Application, Component Used, Propulsion, Level Of Automation, And Region |
|
Report coverage |
Revenue & volume forecast, company share, competitive landscape, growth factors, and trends |
|
Geographic regions covered |
North America, Europe, Asia Pacific, Latin America, Middle East & Africa |
Ans. The global robo taxi market is expected to be $1.03 billion in 2023, and is projected to reach $38.61 billion by 2030, registering a CAGR of 67.8% from 2023 to 2030.
Ans. The goods transportation segment is projected to be the highest contributor to the market, with $0.61 billion in 2023, and is estimated to reach $21.71 billion by 2030, at a CAGR of 70.5% during the forecast period.
Ans. North America would exhibit the highest CAGR of 29.6% during 2021-2030.
Ans. Robo taxi market is expected to see a lucrative growth due to the increased demand for safety while travelling in a vehicle. Also, COVID-19 pandemic has increased safety concerns while using public trasnport thus leading to the growth of the market.
Ans. The factors such as demand for fuel-efficient and emission-free vehicles and need for better road safety and traffic control drive the robo taxi market growth
Ans. The forecast period for the Robo taxi market is 2023-2030
Table of Content
CHAPTER 1: INTRODUCTION
1.1. Report description
1.2. Key benefits for stakeholders
1.3. Key market segments
1.4. Research methodology
1.4.1. Primary research
1.4.2. Secondary research
1.4.3. Analyst tools and models
CHAPTER 2: EXECUTIVE SUMMARY
2.1. CXO perspective
CHAPTER 3: MARKET OVERVIEW
3.1. Market definition and scope
3.2. Key findings
3.2.1. Top impacting factors
3.2.2. Top investment pockets
3.2.3. Top winning strategies
3.3. Porter’s five forces analysis
3.4. Market share analysis (2023)
3.5. Market dynamics
3.5.1. Drivers
3.5.1.1. Demand for fuel efficient and emission free vehicles
3.5.1.2. Need for better road safety and traffic control
3.5.2. Restraints
3.5.2.1. High R&D cost for implementation
3.5.2.2. Cybersecurity threats
3.5.3. Opportunities
3.5.3.1. Government regulations
3.5.3.2. Development of smart cities
CHAPTER 4: ROBO-TAXI MARKET, BY APPLICATION
4.1. Overview
4.2. Goods transportation
4.2.1. Key market trends, growth factors and opportunities
4.2.2. Market size and forecast, by region
4.2.3. Market analysis by country
4.3. Passenger transportation
4.3.1. Key market trends, growth factors, and opportunities
4.3.2. Market size and forecast, by region
4.3.3. Market analysis by country
CHAPTER 5: ROBO-TAXI MARKET, BY COMPONENT
5.1. Overview
5.2. Camera
5.2.1. Key market trends, growth factors and opportunities
5.2.2. Market size and forecast, by region
5.2.3. Market analysis by country
5.3. RADAR
5.3.1. Key market trends, growth factors, and opportunities
5.3.2. Market size and forecast, by region
5.3.3. Market analysis by country
5.4. LiDAR
5.4.1. Key market trends, growth factors, and opportunities
5.4.2. Market size and forecast, by region
5.4.3. Market analysis by country
5.5. Ultrasonic sensor
5.5.1. Key market trends, growth factors, and opportunities
5.5.2. Market size and forecast, by region
5.5.3. Market analysis by country
5.6. Others
5.6.1. Key market trends, growth factors and opportunities
5.6.2. Market size and forecast, by region
5.6.3. Market analysis by country
CHAPTER 6: ROBO-TAXI MARKET, BY PROPULSION
6.1. Overview
6.2. Electric
6.2.1. Key market trends, growth factors and opportunities
6.2.2. Market size and forecast, by region
6.2.3. Market analysis by country
6.3. Fuel cell
6.3.1. Key market trends, growth factors, and opportunities
6.3.2. Market size and forecast, by region
6.3.3. Market analysis by country
6.4. Hybrid
6.4.1. Key market trends, growth factors, and opportunities
6.4.2. Market size and forecast, by region
6.4.3. Market analysis by country
CHAPTER 7: ROBO-TAXI MARKET, BY LEVEL OF AUTOMATION
7.1. Overview
7.2. Level 4 (L4)
7.2.1. Key market trends, growth factors and opportunities
7.2.2. Market size and forecast, by region
7.2.3. Market analysis by country
7.3. Level 5 (L5)
7.3.1. Key market trends, growth factors, and opportunities
7.3.2. Market size and forecast, by region
7.3.3. Market analysis by country
CHAPTER 8: ROBO-TAXI MARKET, BY REGION
8.1. Overview
8.2. North America
8.2.1. Key market trends, growth factors, and opportunities
8.2.2. Market size and forecast, by application
8.2.3. Market size and forecast, by component
8.2.4. Market size and forecast, by propulsion
8.2.5. Market size and forecast, by level of automation
8.2.6. Market analysis by country
8.2.6.1. U.S.
8.2.6.1.1. Market size and forecast, by application
8.2.6.1.2. Market size and forecast, by component
8.2.6.1.3. Market size and forecast, by propulsion
8.2.6.1.4. Market size and forecast, by level of automation
8.2.6.2. Canada
8.2.6.2.1. Market size and forecast, by application
8.2.6.2.2. Market size and forecast, by component
8.2.6.2.3. Market size and forecast, by propulsion
8.2.6.2.4. Market size and forecast, by level of automation
8.2.6.3. Mexico
8.2.6.3.1. Market size and forecast, by application
8.2.6.3.2. Market size and forecast, by component
8.2.6.3.3. Market size and forecast, by propulsion
8.2.6.3.4. Market size and forecast, by level of automation
8.3. Europe
8.3.1. Key market trends, growth factors, and opportunities
8.3.2. Market size and forecast, by application
8.3.3. Market size and forecast, by component
8.3.4. Market size and forecast, by propulsion
8.3.5. Market size and forecast, by level of automation
8.3.6. Market analysis by country
8.3.6.1. Germany
8.3.6.1.1. Market size and forecast, by application
8.3.6.1.2. Market size and forecast, by component
8.3.6.1.3. Market size and forecast, by propulsion
8.3.6.1.4. Market size and forecast, by level of automation
8.3.6.2. France
8.3.6.2.1. Market size and forecast, by application
8.3.6.2.2. Market size and forecast, by component
8.3.6.2.3. Market size and forecast, by propulsion
8.3.6.2.4. Market size and forecast, by level of automation
8.3.6.3. UK
8.3.6.3.1. Market size and forecast, by application
8.3.6.3.2. Market size and forecast, by component
8.3.6.3.3. Market size and forecast, by propulsion
8.3.6.3.4. Market size and forecast, by level of automation
8.3.6.4. Italy
8.3.6.4.1. Market size and forecast, by application
8.3.6.4.2. Market size and forecast, by component
8.3.6.4.3. Market size and forecast, by propulsion
8.3.6.4.4. Market size and forecast, by level of automation
8.3.6.5. Rest of Europe
8.3.6.5.1. Market size and forecast, by application
8.3.6.5.2. Market size and forecast, by component
8.3.6.5.3. Market size and forecast, by propulsion
8.3.6.5.4. Market size and forecast, by level of automation
8.4. Asia-Pacific
8.4.1. Key market trends, growth factors, and opportunities
8.4.2. Market size and forecast, by application
8.4.3. Market size and forecast, by component
8.4.4. Market size and forecast, by propulsion
8.4.5. Market size and forecast, by level of automation
8.4.6. Market analysis by country
8.4.6.1. Japan
8.4.6.1.1. Market size and forecast, by application
8.4.6.1.2. Market size and forecast, by component
8.4.6.1.3. Market size and forecast, by propulsion
8.4.6.1.4. Market size and forecast, by level of automation
8.4.6.2. China
8.4.6.2.1. Market size and forecast, by application
8.4.6.2.2. Market size and forecast, by component
8.4.6.2.3. Market size and forecast, by propulsion
8.4.6.2.4. Market size and forecast, by level of automation
8.4.6.3. Australia
8.4.6.3.1. Market size and forecast, by application
8.4.6.3.2. Market size and forecast, by component
8.4.6.3.3. Market size and forecast, by propulsion
8.4.6.3.4. Market size and forecast, by level of automation
8.4.6.4. South Korea
8.4.6.4.1. Market size and forecast, by application
8.4.6.4.2. Market size and forecast, by component
8.4.6.4.3. Market size and forecast, by propulsion
8.4.6.4.4. Market size and forecast, by level of automation
8.4.6.5. Rest of Asia-Pacific
8.4.6.5.1. Market size and forecast, by application
8.4.6.5.2. Market size and forecast, by component
8.4.6.5.3. Market size and forecast, by propulsion
8.4.6.5.4. Market size and forecast, by level of automation
8.5. LAMEA
8.5.1. Key market trends, growth factors, and opportunities
8.5.2. Market size and forecast, by application
8.5.3. Market size and forecast, by component
8.5.4. Market size and forecast, by propulsion
8.5.5. Market size and forecast, by level of automation
8.5.6. Market analysis by country
8.5.6.1. Latin America
8.5.6.1.1. Market size and forecast, by application
8.5.6.1.2. Market size and forecast, by component
8.5.6.1.3. Market size and forecast, by propulsion
8.5.6.1.4. Market size and forecast, by level of automation
8.5.6.2. Middle East
8.5.6.2.1. Market size and forecast, by application
8.5.6.2.2. Market size and forecast, by component
8.5.6.2.3. Market size and forecast, by propulsion
8.5.6.2.4. Market size and forecast, by level of automation
8.5.6.3. Africa
8.5.6.3.1. Market size and forecast, by application
8.5.6.3.2. Market size and forecast, by component
8.5.6.3.3. Market size and forecast, by propulsion
8.5.6.3.4. Market size and forecast, by level of automation
CHAPTER 9: COMPANY PROFILES
9.1. Cruise LLC (subsidiary of General Motor Company)
9.1.1. Company overview
9.1.2. Company snapshot
9.1.3. Operating business segments
9.1.4. Business performance
9.1.5. Key strategic moves and developments
9.2. Daimler AG
9.2.1. Company overview
9.2.2. Company snapshot
9.2.3. Operating business segments
9.2.4. Business performance
9.2.5. Key strategic moves and developments
9.3. Ford Motor Company
9.3.1. Company overview
9.3.2. Company snapshot
9.3.3. Operating business segments
9.3.4. Business performance
9.3.5. Key strategic moves and developments
9.4. Lyft, Inc.
9.4.1. Company overview
9.4.2. Company snapshot
9.4.3. Product portfolio
9.4.4. Key strategic moves and developments
9.5. Nissan Motor Corporation
9.5.1. Company overview
9.5.2. Company snapshot
9.5.3. Operating business segments
9.5.4. Business performance
9.5.5. Key strategic moves and developments
9.6. Tesla
9.6.1. Company overview
9.6.2. Company snapshot
9.6.3. Operating business segments
9.6.4. Business performance
9.6.5. Key strategic moves and developments
9.7. Uber Technologies
9.7.1. Company overview
9.7.2. Company snapshot
9.7.3. Operating business segments
9.7.4. Business performance
9.7.5. Key strategic moves and developments
9.8. Volkswagen AG
9.8.1. Company overview
9.8.2. Company snapshot
9.8.3. Operating business segments
9.8.4. Business performance
9.8.5. Key strategic moves and developments
9.9. Volvo Group
9.9.1. Company overview
9.9.2. Company snapshot
9.9.3. Operating business segments
9.9.4. Business performance
9.9.5. Key strategic moves and developments
9.10. WAYMO LLC (subsidiary of Alphabet Inc.)
9.10.1. Company overview
9.10.2. Company snapshot
9.10.3. Operating business segments
9.10.4. Business performance
9.10.5. Key strategic moves and developments
LIST OF TABLES
TABLE 01. GLOBAL ROBO-TAXI MARKET, BY APPLICATION, 2023–2030 ($MILLION)
TABLE 02. ROBO-TAXI MARKET REVENUE FOR GOODS TRANSPORTATION, BY REGION 2023–2030 ($MILLION)
TABLE 03. ROBO-TAXI MARKET REVENUE FOR PASSENGER TRANSPORTATION, BY REGION 2023–2030 ($MILLION)
TABLE 04. GLOBAL ROBO-TAXI MARKET, BY COMPONENT, 2023-2030($MILLION)
TABLE 05. ROBO-TAXI MARKET REVENUE FOR CAMERA, BY REGION 2023-2030 ($MILLION)
TABLE 06. ROBO-TAXI MARKET REVENUE FOR RADAR, BY REGION 2023-2030 ($MILLION)
TABLE 07. ROBO-TAXI MARKET REVENUE FOR LIDAR, BY REGION 2023–2030 ($MILLION)
TABLE 08. ROBO-TAXI MARKET REVENUE FOR ULTRASONIC SENSOR, BY REGION 2023–2030 ($MILLION)
TABLE 09. ROBO-TAXI MARKET REVENUE FOR OTHERS, BY REGION 2023-2030 ($MILLION)
TABLE 10. GLOBAL ROBO-TAXI MARKET, BY PROPULSION, 2023-2030($MILLION)
TABLE 11. ROBO-TAXI MARKET REVENUE FOR ELECTRIC, BY REGION 2023-2030 ($MILLION)
TABLE 12. ROBO-TAXI MARKET REVENUE FOR FUEL CELL, BY REGION 2023-2030 ($MILLION)
TABLE 13. ROBO-TAXI MARKET REVENUE FOR HYBRID, BY REGION 2023-2030 ($MILLION)
TABLE 14. GLOBAL ROBO-TAXI MARKET, BY LEVEL OF AUTOMATION, 2023–2030 ($MILLION)
TABLE 15. ROBO-TAXI MARKET REVENUE FOR L4, BY REGION 2023–2030 ($MILLION)
TABLE 16. ROBO-TAXI MARKET REVENUE FOR LEVEL 5 (L5), BY REGION 2023–2030 ($MILLION)
TABLE 17. NORTH AMERICA ROBO-TAXI MARKET, BY APPLICATION, 2023–2030 ($MILLION)
TABLE 18. NORTH AMERICA ROBO-TAXI MARKET, BY COMPONENT, 2023–2030 ($MILLION)
TABLE 19. NORTH AMERICA ROBO-TAXI MARKET, BY PROPULSION, 2023–2030 ($MILLION)
TABLE 20. NORTH AMERICA ROBO-TAXI MARKET, BY LEVEL OF AUTOMATION, 2023–2030 ($MILLION)
TABLE 21. U.S. ROBO-TAXI MARKET, BY APPLICATION, 2023–2030 ($MILLION)
TABLE 22. U.S. ROBO-TAXI MARKET, BY COMPONENT, 2023–2030 ($MILLION)
TABLE 23. U.S. ROBO-TAXI MARKET, BY PROPULSION, 2023–2030 ($MILLION)
TABLE 24. U.S. ROBO-TAXI MARKET, BY LEVEL OF AUTOMATION, 2023–2030 ($MILLION)
TABLE 25. CANADA ROBO-TAXI MARKET, BY APPLICATION, 2023–2030 ($MILLION)
TABLE 26. CANADA ROBO-TAXI MARKET, BY COMPONENT, 2023–2030 ($MILLION)
TABLE 27. CANADA ROBO-TAXI MARKET, BY PROPULSION, 2023–2030 ($MILLION)
TABLE 28. CANADA ROBO-TAXI MARKET, BY LEVEL OF AUTOMATION, 2023–2030 ($MILLION)
TABLE 29. MEXICO ROBO-TAXI MARKET, BY APPLICATION, 2023–2030 ($MILLION)
TABLE 30. MEXICO ROBO-TAXI MARKET, BY COMPONENT, 2023–2030 ($MILLION)
TABLE 31. MEXICO ROBO-TAXI MARKET, BY PROPULSION, 2023–2030 ($MILLION)
TABLE 32. MEXICO ROBO-TAXI MARKET, BY LEVEL OF AUTOMATION, 2023–2030 ($MILLION)
TABLE 33. EUROPE ROBO-TAXI MARKET, BY APPLICATION, 2023–2030 ($MILLION)
TABLE 34. EUROPE ROBO-TAXI MARKET, BY COMPONENT, 2023–2030 ($MILLION)
TABLE 35. EUROPE ROBO-TAXI MARKET, BY PROPULSION, 2023–2030 ($MILLION)
TABLE 36. EUROPE ROBO-TAXI MARKET, BY LEVEL OF AUTOMATION, 2023–2030 ($MILLION)
TABLE 37. GERMANY ROBO-TAXI MARKET, BY APPLICATION, 2023–2030 ($MILLION)
TABLE 38. GERMANY ROBO-TAXI MARKET, BY COMPONENT, 2023–2030 ($MILLION)
TABLE 39. GERMANY ROBO-TAXI MARKET, BY PROPULSION, 2023–2030 ($MILLION)
TABLE 40. GERMANY ROBO-TAXI MARKET, BY LEVEL OF AUTOMATION, 2023–2030 ($MILLION)
TABLE 41. FRANCE ROBO-TAXI MARKET, BY APPLICATION, 2023–2030 ($MILLION)
TABLE 42. FRANCE ROBO-TAXI MARKET, BY COMPONENT, 2023–2030 ($MILLION)
TABLE 43. FRANCE ROBO-TAXI MARKET, BY PROPULSION, 2023–2030 ($MILLION)
TABLE 44. FRANCE ROBO-TAXI MARKET, BY LEVEL OF AUTOMATION, 2023–2030 ($MILLION)
TABLE 45. UK ROBO-TAXI MARKET, BY APPLICATION, 2023–2030 ($MILLION)
TABLE 46. UK ROBO-TAXI MARKET, BY COMPONENT, 2023–2030 ($MILLION)
TABLE 47. UK ROBO-TAXI MARKET, BY PROPULSION, 2023–2030 ($MILLION)
TABLE 48. UK ROBO-TAXI MARKET, BY LEVEL OF AUTOMATION, 2023–2030 ($MILLION)
TABLE 49. ITALY ROBO-TAXI MARKET, BY APPLICATION, 2023–2030 ($MILLION)
TABLE 50. ITALY ROBO-TAXI MARKET, BY COMPONENT, 2023–2030 ($MILLION)
TABLE 51. ITALY ROBO-TAXI MARKET, BY PROPULSION, 2023–2030 ($MILLION)
TABLE 52. ITALY ROBO-TAXI MARKET, BY LEVEL OF AUTOMATION, 2023–2030 ($MILLION)
TABLE 53. REST OF EUROPE ROBO-TAXI MARKET, BY APPLICATION, 2023–2030 ($MILLION)
TABLE 54. REST OF EUROPE ROBO-TAXI MARKET, BY COMPONENT, 2023–2030 ($MILLION)
TABLE 55. REST OF EUROPE ROBO-TAXI MARKET, BY PROPULSION, 2023–2030 ($MILLION)
TABLE 56. REST OF EUROPE ROBO-TAXI MARKET, BY LEVEL OF AUTOMATION, 2023–2030 ($MILLION)
TABLE 57. ASIA-PACIFIC ROBO-TAXI MARKET, BY APPLICATION, 2023–2030 ($MILLION)
TABLE 58. ASIA-PACIFIC ROBO-TAXI MARKET, BY COMPONENT, 2023–2030 ($MILLION)
TABLE 59. ASIA-PACIFIC ROBO-TAXI MARKET, BY PROPULSION, 2023–2030 ($MILLION)
TABLE 60. ASIA-PACIFIC ROBO-TAXI MARKET, BY LEVEL OF AUTOMATION, 2023–2030 ($MILLION)
TABLE 61. JAPAN ROBO-TAXI MARKET, BY APPLICATION, 2023–2030 ($MILLION)
TABLE 62. JAPAN ROBO-TAXI MARKET, BY COMPONENT, 2023–2030 ($MILLION)
TABLE 63. JAPAN ROBO-TAXI MARKET, BY PROPULSION, 2023–2030 ($MILLION)
TABLE 64. JAPAN ROBO-TAXI MARKET, BY LEVEL OF AUTOMATION, 2023–2030 ($MILLION)
TABLE 65. CHINA ROBO-TAXI MARKET, BY APPLICATION, 2023–2030 ($MILLION)
TABLE 66. CHINA ROBO-TAXI MARKET, BY COMPONENT, 2023–2030 ($MILLION)
TABLE 67. CHINA ROBO-TAXI MARKET, BY PROPULSION, 2023–2030 ($MILLION)
TABLE 68. CHINA ROBO-TAXI MARKET, BY LEVEL OF AUTOMATION, 2023–2030 ($MILLION)
TABLE 69. AUSTRALIA ROBO-TAXI MARKET, BY APPLICATION, 2023–2030 ($MILLION)
TABLE 70. AUSTRALIA ROBO-TAXI MARKET, BY COMPONENT, 2023–2030 ($MILLION)
TABLE 71. AUSTRALIA ROBO-TAXI MARKET, BY PROPULSION, 2023–2030 ($MILLION)
TABLE 72. AUSTRALIA ROBO-TAXI MARKET, BY LEVEL OF AUTOMATION, 2023–2030 ($MILLION)
TABLE 73. SOUTH KOREA ROBO-TAXI MARKET, BY APPLICATION, 2023–2030 ($MILLION)
TABLE 74. SOUTH KOREA ROBO-TAXI MARKET, BY COMPONENT, 2023–2030 ($MILLION)
TABLE 75. SOUTH KOREA ROBO-TAXI MARKET, BY PROPULSION, 2023–2030 ($MILLION)
TABLE 76. SOUTH KOREA ROBO-TAXI MARKET, BY LEVEL OF AUTOMATION, 2023–2030 ($MILLION)
TABLE 77. REST OF ASIA-PACIFIC ROBO-TAXI MARKET, BY APPLICATION, 2023–2030 ($MILLION)
TABLE 78. REST OF ASIA-PACIFIC ROBO-TAXI MARKET, BY COMPONENT, 2023–2030 ($MILLION)
TABLE 79. REST OF ASIA-PACIFIC ROBO-TAXI MARKET, BY PROPULSION, 2023–2030 ($MILLION)
TABLE 80. REST OF ASIA-PACIFIC ROBO-TAXI MARKET, BY LEVEL OF AUTOMATION, 2023–2030 ($MILLION)
TABLE 81. LAMEA ROBO-TAXI MARKET, BY APPLICATION, 2023–2030 ($MILLION)
TABLE 82. LAMEA ROBO-TAXI MARKET, BY COMPONENT, 2023–2030 ($MILLION)
TABLE 83. LAMEA ROBO-TAXI MARKET, BY PROPULSION, 2023–2030 ($MILLION)
TABLE 84. LAMEA ROBO-TAXI MARKET, BY LEVEL OF AUTOMATION, 2023–2030 ($MILLION)
TABLE 85. LATIN AMERICA ROBO-TAXI MARKET, BY APPLICATION, 2023–2030 ($MILLION)
TABLE 86. LATIN AMERICA ROBO-TAXI MARKET, BY COMPONENT, 2023–2030 ($MILLION)
TABLE 87. LATIN AMERICA ROBO-TAXI MARKET, BY PROPULSION, 2023–2030 ($MILLION)
TABLE 88. LATIN AMERICA ROBO-TAXI MARKET, BY LEVEL OF AUTOMATION, 2023–2030 ($MILLION)
TABLE 89. MIDDLE EAST ROBO-TAXI MARKET, BY APPLICATION, 2023–2030 ($MILLION)
TABLE 90. MIDDLE EAST ROBO-TAXI MARKET, BY COMPONENT, 2023–2030 ($MILLION)
TABLE 91. MIDDLE EAST ROBO-TAXI MARKET, BY PROPULSION, 2023–2030 ($MILLION)
TABLE 92. MIDDLE EAST ROBO-TAXI MARKET, BY LEVEL OF AUTOMATION, 2023–2030 ($MILLION)
TABLE 93. AFRICA ROBO-TAXI MARKET, BY APPLICATION, 2023–2030 ($MILLION)
TABLE 94. AFRICA ROBO-TAXI MARKET, BY COMPONENT, 2023–2030 ($MILLION)
TABLE 95. AFRICA ROBO-TAXI MARKET, BY PROPULSION, 2023–2030 ($MILLION)
TABLE 96. AFRICA ROBO-TAXI MARKET, BY LEVEL OF AUTOMATION, 2023–2030 ($MILLION)
TABLE 97. GENERAL MOTORS COMPANY: COMPANY SNAPSHOT
TABLE 98. GENERAL MOTORS COMPANY: OPERATING SEGMENTS
TABLE 99. DAIMLER AG: COMPANY SNAPSHOT
TABLE 100. DAIMLER AG: OPERATING SEGMENTS
TABLE 101. FORD MOTOR COMPANY: COMPANY SNAPSHOT
TABLE 102. DAIMLER AG: OPERATING SEGMENTS
TABLE 103. LYFT INC.: COMPANY SNAPSHOT
TABLE 104. LYFT INC.: PRODUCT PORTFOLIO
TABLE 105. LYFT INC.: KEY STRATEGIC MOVES AND DEVELOPMENTS
TABLE 106. NISSAN MOTOR CORPORATION: COMPANY SNAPSHOT
TABLE 107. NISSAN MOTOR CORPORATION: OPERATING SEGMENTS
TABLE 108. NISSAN MOTOR CORPORATION: KEY STRATEGIC MOVES AND DEVELOPMENTS
TABLE 109. TESLA: COMPANY SNAPSHOT
TABLE 110. TESLA: OPERATING SEGMENTS
TABLE 111. TESLA: KEY STRATEGIC MOVES AND DEVELOPMENTS
TABLE 112. UBER TECHNOLOGIES: COMPANY SNAPSHOT
TABLE 113. EMBRAER: OPERATING SEGMENTS
TABLE 114. VOLKSWAGEN AG: COMPANY SNAPSHOT
TABLE 115. VOLKSWAGEN AG: OPERATING SEGMENTS
TABLE 116. VOLVO GROUP (VOLVO): COMPANY SNAPSHOT
TABLE 117. VOLVO GROUP (VOLVO): OPERATING SEGMENTS
TABLE 118. WAYMO LLC (SUBSIDIARY OF ALPHABET INC.): COMPANY SNAPSHOT
TABLE 119. WAYMO LLC: OPERATING SEGMENTS
LIST OF FIGURES
FIGURE 01. KEY MARKET SEGMENTS
FIGURE 02. EXECUTIVE SUMMARY
FIGURE 03. EXECUTIVE SUMMARY
FIGURE 04. TOP IMPACTING FACTORS
FIGURE 05. TOP INVESTMENT POCKETS
FIGURE 06. TOP WINNING STRATEGIES, BY YEAR, 2016–2019*
FIGURE 07. TOP WINNING STRATEGIES, BY YEAR, 2016–2019*
FIGURE 08. TOP WINNING STRATEGIES, BY COMPANY, 2016–2019*
FIGURE 09. MODERATE-TO-HIGH BARGAINING POWER OF SUPPLIERS
FIGURE 10. MODERATE-TO-HIGH THREAT OF NEW ENTRANTS
FIGURE 11. MODERATE THREAT OF SUBSTITUTES
FIGURE 12. HIGH-TO-MODERATE INTENSITY OF RIVALRY
FIGURE 13. MODERATE BARGAINING POWER OF BUYERS
FIGURE 14. MARKET SHARE ANALYSIS (2023)
FIGURE 15. GLOBAL ROBO-TAXI MARKET, BY APPLICATION, 2023–2030 ($MILLION)
FIGURE 16. COMPARATIVE SHARE ANALYSIS OF ROBO-TAXI MARKET FOR GOODS TRANSPORTATION, BY COUNTRY, 2023 & 2030 ($MILLION)
FIGURE 17. COMPARATIVE SHARE ANALYSIS OF ROBO-TAXI MARKET FOR PASSENGER TRANSPORTATION, BY COUNTRY, 2023 & 2030 ($MILLION)
FIGURE 18. GLOBAL ROBO-TAXI MARKET, BY COMPONENT, 2023 & 2030 (%)
FIGURE 19. COMPARATIVE SHARE ANALYSIS OF ROBO-TAXI MARKET FOR CAMERA, BY COUNTRY, 2023 & 2030 ($MILLION)
FIGURE 20. COMPARATIVE SHARE ANALYSIS OF ROBO-TAXI MARKET FOR RADAR, BY COUNTRY, 2023 & 2030 ($MILLION)
FIGURE 21. COMPARATIVE SHARE ANALYSIS OF ROBO-TAXI MARKET FOR LIDAR, BY COUNTRY, 2023 & 2030 ($MILLION)
FIGURE 22. COMPARATIVE SHARE ANALYSIS OF ROBO-TAXI MARKET FOR ULTRASONIC SENSOR, BY COUNTRY, 2023 & 2030 ($MILLION)
FIGURE 23. COMPARATIVE SHARE ANALYSIS OF ROBO-TAXI MARKET FOR OTHERS, BY COUNTRY, 2023 & 2030 ($MILLION)
FIGURE 24. GLOBAL ROBO-TAXI MARKET, BY PROPULSION, 2023 & 2030 (%)
FIGURE 25. COMPARATIVE SHARE ANALYSIS OF ROBO-TAXI MARKET FOR ELECTRIC, BY COUNTRY, 2023 & 2030 ($MILLION)
FIGURE 26. COMPARATIVE SHARE ANALYSIS OF ROBO-TAXI MARKET FOR FUEL CELL, BY COUNTRY, 2023 & 2030 ($MILLION)
FIGURE 27. COMPARATIVE SHARE ANALYSIS OF ROBO-TAXI MARKET FOR HYBRID, BY COUNTRY, 2023 & 2030 ($MILLION)
FIGURE 28. GLOBAL ROBO-TAXI MARKET, BY LEVEL OF AUTOMATION, 2023–2030 (%)
FIGURE 29. COMPARATIVE SHARE ANALYSIS OF ROBO-TAXI MARKET FOR LEVEL 4 (L4), BY COUNTRY, 2023 & 2030 ($MILLION)
FIGURE 30. COMPARATIVE SHARE ANALYSIS OF ROBO-TAXI MARKET FOR L5, BY COUNTRY, 2023 & 2030 ($MILLION)
FIGURE 31. ROBO-TAXI MARKET, BY REGION, 2023-2030 (%)
FIGURE 32. COMPARATIVE SHARE ANALYSIS OF ROBO-TAXI MARKET, BY COUNTRY, 2023–2030 (%)
FIGURE 33. U.S. ROBO-TAXI MARKET, 2023–2030 ($MILLION)
FIGURE 34. CANADA ROBO-TAXI MARKET, 2023–2030 ($MILLION)
FIGURE 35. MEXICO ROBO-TAXI MARKET, 2023–2030 ($MILLION)
FIGURE 36. COMPARATIVE SHARE ANALYSIS OF ROBO-TAXI MARKET, BY COUNTRY, 2023–2030 (%)
FIGURE 37. GERMANY ROBO-TAXI MARKET, 2023–2030 ($MILLION)
FIGURE 38. FRANCE ROBO-TAXI MARKET, 2023–2030 ($MILLION)
FIGURE 39. UK ROBO-TAXI MARKET, 2023–2030 ($MILLION)
FIGURE 40. ITALY ROBO-TAXI MARKET, 2023–2030 ($MILLION)
FIGURE 41. REST OF EUROPE ROBO-TAXI MARKET, 2023–2030 ($MILLION)
FIGURE 42. COMPARATIVE SHARE ANALYSIS OF ROBO-TAXI MARKET, BY COUNTRY, 2023–2030 (%)
FIGURE 43. JAPAN ROBO-TAXI MARKET, 2023–2030 ($MILLION)
FIGURE 44. CHINA ROBO-TAXI MARKET, 2023–2030 ($MILLION)
FIGURE 45. AUSTRALIA ROBO-TAXI MARKET, 2023–2030 ($MILLION)
FIGURE 46. SOUTH KOREA ROBO-TAXI MARKET, 2023–2030 ($MILLION)
FIGURE 47. REST OF ASIA-PACIFIC ROBO-TAXI MARKET, 2023–2030 ($MILLION)
FIGURE 48. COMPARATIVE SHARE ANALYSIS OF ROBO-TAXI MARKET, BY COUNTRY, 2023–2030 (%)
FIGURE 49. LATIN AMERICA ROBO-TAXI MARKET, 2023–2030 ($MILLION)
FIGURE 50. MIDDLE EAST ROBO-TAXI MARKET, 2023–2030 ($MILLION)
FIGURE 51. AFRICA ROBO-TAXI MARKET, 2023–2030 ($MILLION)
FIGURE 52. GENERAL MOTORS COMPANY: REVENUE, 2016–2018 ($MILLION)
FIGURE 53. GENERAL MOTORS COMPANY: REVENUE SHARE BY SEGMENT, 2018 (%)
FIGURE 54. GENERAL MOTORS COMPANY: REVENUE SHARE BY REGION, 2018 (%)
FIGURE 55. DAIMLER AG: REVENUE, 2016–2018 ($MILLION)
FIGURE 56. DAIMLER AG: REVENUE SHARE BY SEGMENT, 2018 (%)
FIGURE 57. DAIMLER AG: REVENUE SHARE BY GEOGRAPHY, 2018 (%)
FIGURE 58. FORD MOTOR COMPANY: REVENUE, 2016–2018 ($MILLION)
FIGURE 59. FORD MOTOR COMPANY: REVENUE SHARE BY SEGMENT, 2018 (%)
FIGURE 60. FORD MOTOR COMPANY: REVENUE SHARE BY REGION, 2018 (%)
FIGURE 61. NISSAN MOTOR CORPORATION: REVENUE, 2016–2018 ($MILLION)
FIGURE 62. NISSAN MOTOR CORPORATION: REVENUE SHARE BY SEGMENT, 2018 (%)
FIGURE 63. NISSAN MOTOR CORPORATION: REVENUE SHARE BY REGION, 2018 (%)
FIGURE 64. TESLA: REVENUE, 2016–2018 ($MILLION)
FIGURE 65. TESLA: REVENUE SHARE BY SEGMENT, 2018 (%)
FIGURE 66. TESLA: REVENUE SHARE BY REGION, 2018 (%)
FIGURE 67. UBER TECHNOLOGIES: REVENUE, 2016–2018 ($MILLION)
FIGURE 68. UBER TECHNOLOGIES: REVENUE, BY BUSINESS SEGMENT, 2018 (%)
FIGURE 69. UBER TECHNOLOGIES: REVENUE, BY REGION, 2018 (%)
FIGURE 70. VOLKSWAGEN AG: REVENUE, 2016–2018 ($MILLION)
FIGURE 71. VOLKSWAGEN AG: REVENUE SHARE BY SEGMENT, 2018 (%)
FIGURE 72. VOLKSWAGEN AG: REVENUE SHARE BY GEOGRAPHY, 2018 (%)
FIGURE 73. VOLVO GROUP (VOLVO): REVENUE, 2016–2018 ($MILLION)
FIGURE 74. VOLVO GROUP (VOLVO): REVENUE SHARE BY SEGMENT, 2018 (%)
FIGURE 75. VOLVO GROUP (VOLVO): REVENUE SHARE BY REGION, 2018 (%)
FIGURE 76. ALPHABET INC: NET SALES, 2015-2017 ($MILLION)
FIGURE 77. ALPHABET INC: REVENUE SHARE BY SEGMENT, 2017 (%)
FIGURE 78. ALPHABET INC: REVENUE SHARE BY REGION, 2017 (%)
$4833
$5805
$8096
HAVE A QUERY?
OUR CUSTOMER

SIMILAR REPORTS
Add to Cart
Add to Cart
Add to Cart
Add to Cart