
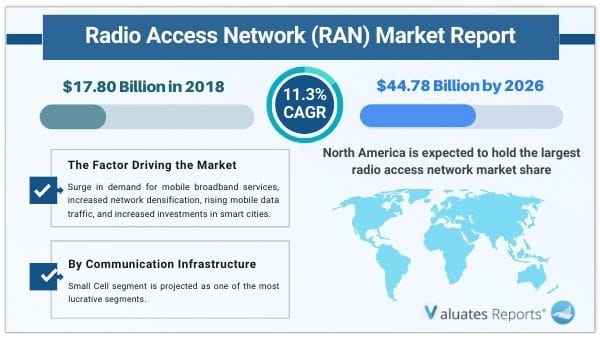
The global radio access network market size was valued at $17.80 billion in 2018 and is projected to reach $44.78 billion by 2026, growing at a CAGR of 11.3% from 2019 to 2026. Radio Access Network (RAN) is used in computers, mobile phones, or any other wireless devices for transmitting signals, sounds, messages, signs, and information with the help of radio access technology. RAN helps in providing a connection with its core networks.
The market for RAN is anticipated to be driven by the 5G network due to increasing demand for wireless broadband services that require fast and high-capacity networks. The development of the 5G connectivity technology is expected to address the growing demand for high-speed data communication. For instance, 5G (RAN) focuses on improving networks by creating demands for low latency and large capacity. Due to the existence of silicon chip in core network and user devices, RAN can function smoothly. There are various types of radio access networks that provide high data rates such as generic radio access networks (GRAN), GSM edge radio access networks (GERAN), evolved universal terrestrial radio access network (EUTRAN) and UMTS terrestrial radio access networks (UTRAN). This can lead to the need for related network infrastructure, which is estimated to provide growth opportunities for the radio access network market in the coming years.
Factors such as surge in demand for mobile broadband services, increase in network densification, and rising mobile data traffic are the major key drivers for the radio access network market growth. However, concerns related to fiber backhaul and privacy & security concerns act as a major restraint, which can hinder the market growth. Furthermore, increase in investments in smart cities provide lucrative growth opportunities to radio access network market.
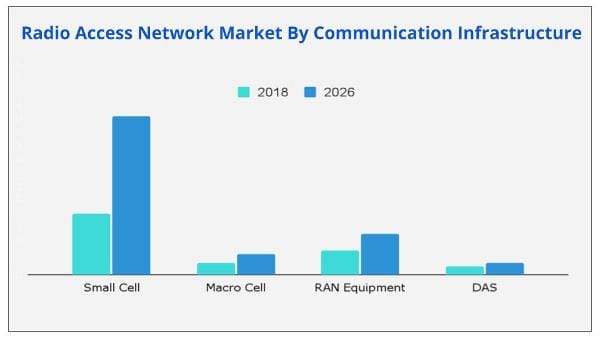
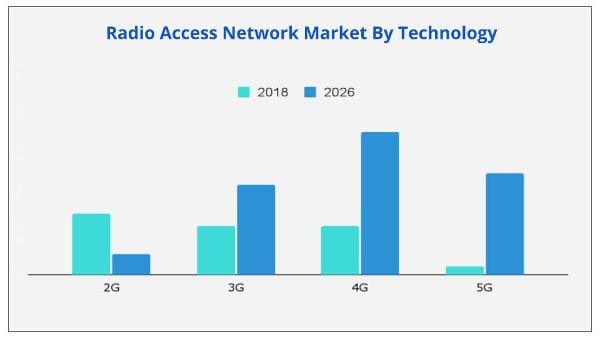
The radio access network industry is segmented by communication infrastructure, technology, end user, and region. On the basis of communication infrastructure, it is classified into small cell, macro cell, RAN equipment, and DAS. On the basis technology, it is analyzed into 2G, 3G, 4G, and 5G. By end user, it is analyzed across residential, industrial, commercial, and others. Region wise, it is analyzed across North America. Europe, Asia-Pacific, and LAMEA.
The significant impacting factors in the radio access network market trends include rise in demand for mobile broadband services, increase in network densification, and growing mobile data traffic. However, concerns related to fiber backhaul and privacy & security concerns is expected to hinder the market growth. Conversely, increase in investments in smart cities is projected to offer remunerative opportunities to the RAN market. Each of these factors is anticipated to have a definite impact on the market during the forecast period.
Mobile broadband subscriptions grew with the annual rate of more than 20% in the last six years and reached 4.3 billion globally by the end of 2017. This huge adoption in mobile broadband services was due to affordable prices. The average subscription price of mobile broadband was 0.7% of the gross national income (GNI) per capita in developed economies, whereas it was 4.3% of the world GNI per capita in developing economies. Thus, numerous initiatives are being made to expand internet access through the increased availability of broadband networks. This is anticipated to increase the number of 5G mobile broadband users, thereby, fueling the radio access network market growth.
Network densification is an integral part of deploying 5G architecture, which promises massively increased data rates, from megabits per second (Mbps) to gigabits per second (Gbps); and ultra-reliable lower latency, from tens of milliseconds to milliseconds. Successful 5G implementation is mainly dependent on network densification, which is increased through available network capacity by adding more cell sites, which includes macro sites, radio access networks, in-building wireless, and small cell deployments. The optimal locations for network densification are generally near urban areas and large venues where there are higher number of digital users.
Key players operating in the radio access industry are Huawei Technologies, Samsung Electronics Co., Ltd., Cisco Systems, Inc., Ericsson, Nokia Corporation, ZTE Corporation, Fujitsu, Qualcomm Incorporated, Intel Corporation, and NEC Corporation. These players adopted product launch, collaboration, partnership, and agreement as their key developmental strategies to increase revenue of the radio access network market and develop new products for enhancing their product portfolio. Nokia Corporation is a leading player in telecommunication and information technology that provides radio access network, making 5G a reality, which is highly versatile in terms of connectivity, capacity, and low latency. The radio access network market is expected to witness growth from 2019 to 2026 due to continuous evolution in advanced connectivity technologies such as 2G, 3G, and 4G.
|
Report Metric |
Details |
|
Report Name |
Radio Access Network (RAN) Market |
|
The market size in 2018 |
USD 17.80 Billion |
|
The revenue forecast in 2026 |
USD 44.78 Billion |
|
Growth Rate |
CAGR of 11.3% from 2019 to 2026 |
|
Market size available for years |
2019-2026 |
|
Forecast units |
Value (USD) |
|
Segments covered |
by Communication Infrastructure, by Communication Technology, by End User, & Region |
|
Report coverage |
Revenue & volume forecast, company share, competitive landscape, growth factors, and trends |
|
Geographic regions covered |
North America, Europe, Asia Pacific, Latin America, Middle East & Africa |
Ans. The global radio access network market size was valued at $17.80 billion in 2018 and is projected to reach $44.78 billion by 2026, growing at a CAGR of 11.3% from 2019 to 2026
Ans. By Communication Infrastructure, Small Cell segment is projected as one of the most lucrative segments.
Ans. Global Radio Access Network Market key players include Huawei Technologies, Samsung Electronics Co., Ltd., Cisco Systems, Inc., Ericsson, Nokia Corporation, ZTE Corporation, Fujitsu, Qualcomm Incorporated, Intel Corporation, and NEC Corporation.
Ans. Major factors driving the growth of radio access network market size are a surge in demand for mobile broadband services, increased network densification, rising mobile data traffic, and increased investments in smart cities.
Ans. Yes, the report includes a COVID-19 impact analysis. Also, it is further extended into every individual segment of the report.
TABLE OF CONTENT
Chapter 1: Introduction
1.1. Report description
1.2. Key benefits for stakeholders
1.3. Key market segments
1.4. Research methodology
1.4.1. Primary research
1.4.2. Secondary research
1.4.3. Analyst tools and models
Chapter 2: Executive Summary
2.1. Key findings
2.1.1. Top impacting factors
2.1.2. Top investment pockets
2.2. CXO perspective
Chapter 3: Market Overview
3.1. Market definition and scope
3.2. Porter’s five forces analysis
3.3. Patent analysis
3.3.1. By region (2012-2017)
3.3.2. By applicant
3.4. Market dynamics
3.4.1. Drivers
3.4.1.1. Increase in demand for mobile broadband services
3.4.1.2. Increase in network densification
3.4.1.3. Growing mobile data traffic
3.4.2. Restraints
3.4.2.1. Concerns related to fiber backhaul
3.4.2.2. Privacy & security concerns
3.4.3. Opportunity
3.4.3.1. Increase in investments in smart cities
Chapter 4: RAN Market, By Communication Infrastructure
4.1. Overview
4.2. Small cell
4.2.1. Key market trends, growth factors, and opportunities
4.2.2. Market size and forecast, by region
4.2.3. Market analysis, by country
4.3. Macro cell
4.3.1. Key market trends, growth factors, and opportunities
4.3.2. Market size and forecast, by region
4.3.3. Market analysis, by country
4.4. RAN Equipment
4.4.1. Key market trends, growth factors, and opportunities
4.4.2. Market size and forecast, by region
4.4.3. Market analysis, by country
4.5. DAS
4.5.1. Key market trends, growth factors, and opportunities
4.5.2. Market size and forecast, by region
4.5.3. Market analysis, by country
Chapter 5: RAN Market, By Technology
5.1. Overview
5.2. 2G
5.2.1. Key market trends, growth factors, and opportunities
5.2.2. Market size and forecast, by region
5.2.3. Market analysis, by country
5.3. 3G
5.3.1. Key market trends, growth factors, and opportunities
5.3.2. Market size and forecast, by region
5.3.3. Market analysis, by country
5.4. 4G
5.4.1. Key market trends, growth factors, and opportunities
5.4.2. Market size and forecast, by region
5.4.3. Market analysis, by country
5.5. 5G
5.5.1. Key market trends, growth factors, and opportunities
5.5.2. Market size and forecast, by region
5.5.3. Market analysis, by country
Chapter 6: RAN Market, By End User
6.1. Overview
6.2. Residential
6.2.1. Key market trends, growth factors, and opportunities
6.2.2. Market size and forecast, by region
6.2.3. Market analysis, by country
6.3. Enterprise
6.3.1. Key market trends, growth factors, and opportunities
6.3.2. Market size and forecast, by region
6.3.3. Market analysis, by country
Chapter 7: RAN Market, By Region
7.1. Overview
7.2. North America
7.2.1. Key market trends, growth factors, and opportunities
7.2.2. Market size and forecast, by communication infrastructure
7.2.3. Market size and forecast, by Technology
7.2.4. Market size and forecast, by End User
7.2.5. Market analysis, by country
7.2.5.1. U.S.
7.2.5.1.1. Market size and forecast, by communication infrastructure
7.2.5.1.2. Market size and forecast, by Technology
7.2.5.1.3. Market size and forecast, by End User
7.2.5.2. Canada
7.2.5.2.1. Market size and forecast, by communication infrastructure
7.2.5.2.2. Market size and forecast, by Technology
7.2.5.2.3. Market size and forecast, by End User
7.2.5.3. Mexico
7.2.5.3.1. Market size and forecast, by communication infrastructure
7.2.5.3.2. Market size and forecast, by Technology
7.2.5.3.3. Market size and forecast, by End User
7.3. Europe
7.3.1. Key market trends, growth factors, and opportunities
7.3.2. Market size and forecast, by communication infrastructure
7.3.3. Market size and forecast, by Technology
7.3.4. Market size and forecast, by End User
7.3.5. Market analysis, by country
7.3.5.1. UK
7.3.5.1.1. Market size and forecast, by communication infrastructure
7.3.5.1.2. Market size and forecast, by Technology
7.3.5.1.3. Market size and forecast, by End User
7.3.5.2. Germany
7.3.5.2.1. Market size and forecast, by communication infrastructure
7.3.5.2.2. Market size and forecast, by Technology
7.3.5.2.3. Market size and forecast, by End User
7.3.5.3. France
7.3.5.3.1. Market size and forecast, by communication infrastructure
7.3.5.3.2. Market size and forecast, by Technology
7.3.5.3.3. Market size and forecast, by End User
7.3.5.4. Rest of Europe
7.3.5.4.1. Market size and forecast, by communication infrastructure
7.3.5.4.2. Market size and forecast, by Technology
7.3.5.4.3. Market size and forecast, by End User
7.4. Asia-Pacific
7.4.1. Key market trends, growth factors, and opportunities
7.4.2. Market size and forecast, by communication infrastructure
7.4.3. Market size and forecast, by Technology
7.4.4. Market size and forecast, by End User
7.4.5. Market analysis, by country
7.4.5.1. China
7.4.5.1.1. Market size and forecast, by communication infrastructure
7.4.5.1.2. Market size and forecast, by Technology
7.4.5.1.3. Market size and forecast, by End User
7.4.5.2. Japan
7.4.5.2.1. Market size and forecast, by communication infrastructure
7.4.5.2.2. Market size and forecast, by Technology
7.4.5.2.3. Market size and forecast, by End User
7.4.5.3. India
7.4.5.3.1. Market size and forecast, by communication infrastructure
7.4.5.3.2. Market size and forecast, by Technology
7.4.5.3.3. Market size and forecast, by End User
7.4.5.4. Rest of Asia-Pacific
7.4.5.4.1. Market size and forecast, by communication infrastructure
7.4.5.4.2. Market size and forecast, by Technology
7.4.5.4.3. Market size and forecast, by End User
7.5. LAMEA
7.5.1. Key market trends, growth factors, and opportunities
7.5.2. Market size and forecast, by communication infrastructure
7.5.3. Market size and forecast, by Technology
7.5.4. Market size and forecast, by End User
7.5.5. Market analysis, by country
7.5.5.1. Latin America
7.5.5.1.1. Market size and forecast, by communication infrastructure
7.5.5.1.2. Market size and forecast, by Technology
7.5.5.1.3. Market size and forecast, by End User
7.5.5.2. Middle East
7.5.5.2.1. Market size and forecast, by communication infrastructure
7.5.5.2.2. Market size and forecast, by Technology
7.5.5.2.3. Market size and forecast, by End User
7.5.5.3. Africa
7.5.5.3.1. Market size and forecast, by communication infrastructure
7.5.5.3.2. Market size and forecast, by Technology
7.5.5.3.3. Market size and forecast, by End User
Chapter 8: Competitive Landscape
8.1. Introduction
8.1.1. Market player positioning, 2019
8.2. Top winning strategies
Chapter 9: Company Profile
9.1. Ericsson
9.1.1. Company overview
9.1.2. Company snapshot
9.1.3. Operating business segments
9.1.4. Product portfolio
9.1.5. R&D Expenditure
9.1.6. Business performance
9.1.7. Key strategic moves and developments
9.2. Fujitsu Limited
9.2.1. Company overview
9.2.2. Company snapshot
9.2.3. Operating business segments
9.2.4. Product portfolio
9.2.5. R&D Expenditure
9.2.6. Business performance
9.2.7. Key strategic moves and developments
9.3. Huawei Technologies Co., Ltd.
9.3.1. Company overview
9.3.2. Company snapshot
9.3.3. Operating business segments
9.3.4. Product portfolio
9.3.5. R&D Expenditure
9.3.6. Business performance
9.3.7. Key strategic moves and developments
9.4. Intel Corporation
9.4.1. Company overview
9.4.2. Company snapshot
9.4.3. Operating business segments
9.4.4. Product portfolio
9.4.5. R&D Expenditure
9.4.6. Business performance
9.4.7. Key strategic moves and developments
9.5. Nokia Corporation
9.5.1. Company overview
9.5.2. Company snapshot
9.5.3. Operating business segments
9.5.4. Product portfolio
9.5.5. R&D Expenditure
9.5.6. Business performance
9.5.7. Key strategic moves and developments
9.6. Qualcomm Technologies, Inc.
9.6.1. Company overview
9.6.2. Company snapshot
9.6.3. Operating business segments
9.6.4. Product portfolio
9.6.5. R&D Expenditure
9.6.6. Business performance
9.6.7. Key strategic moves and developments
9.7. SAMSUNG ELECTRONICS CO. LTD.
9.7.1. Company overview
9.7.2. Operating business segments
9.7.3. Product portfolio
9.7.4. R&D Expenditure
9.7.5. Business performance
9.7.6. Key strategic moves and developments
9.8. Cisco Systems, Inc.
9.8.1. Company overview
9.8.2. Company snapshot
9.8.3. Operating business segments
9.8.4. Product portfolio
9.8.5. R&D Expenditure
9.8.6. Business performance
9.9. ZTE Corporation
9.9.1. Company overview
9.9.2. Company snapshot
9.9.3. Operating business segments
9.9.4. Product portfolio
9.9.5. R&D Expenditure
9.9.6. Business performance
9.9.7. Key strategic moves and developments
9.10. NEC Corporation
9.10.1. Company overview
9.10.2. Company snapshot
9.10.3. Operating business segments
9.10.4. Product portfolio
9.10.5. R&D Expenditure
9.10.6. Business performance
9.10.7. Key strategic moves and developments
LIST OF TABLES & FIGURES
TABLE 01. SMALL CELL RAN MARKET, BY REGION, 2018-2026 ($MILLION)
TABLE 02. MACRO CELL RAN MARKET, BY REGION 2018-2026 ($MILLION)
TABLE 03. RAN EQUIPMENT MARKET, BY REGION 2018-2026 ($MILLION)
TABLE 04. DAS MARKET, BY REGION 2018-2026 ($MILLION)
TABLE 05. GLOBAL RAN MARKET, BY TECHNOLOGY, 2018-2026($MILLION)
TABLE 06. RAN MARKET FOR 2G, BY REGION 2018-2026 ($MILLION)
TABLE 07. RAN MARKET FOR 3G, BY REGION 2018-2026 ($MILLION)
TABLE 08. RAN MARKET FOR 4G, BY REGION 2018-2026 ($MILLION)
TABLE 09. RAN MARKET FOR 5G, BY REGION 2018-2026 ($MILLION)
TABLE 10. GLOBAL RAN MARKET, BY END USER, 2018-2026($MILLION)
TABLE 11. RAN MARKET FOR RESIDENTIAL, BY REGION 2018-2026 ($MILLION)
TABLE 12. RAN MARKET FOR ENTERPRISE, BY REGION 2018-2026 ($MILLION)
TABLE 13. RAN MARKET REVENUE, BY REGION, 2018–2026 ($MILLION)
TABLE 14. NORTH AMERICA RAN MARKET, BY COMMUNICATION INFRASTRUCTURE, 2018–2026 ($MILLION)
TABLE 15. NORTH AMERICA RAN MARKET, BY TECHNOLOGY, 2018–2026 ($MILLION)
TABLE 16. NORTH AMERICA RAN MARKET, BY END USER, 2018–2026 ($MILLION)
TABLE 17. U.S. RAN MARKET, BY COMMUNICATION INFRASTRUCTURE, 2018–2026 ($MILLION)
TABLE 18. U.S. RAN MARKET, BY TECHNOLOGY, 2018–2026 ($MILLION)
TABLE 19. U.S. RAN MARKET, BY END USER, 2018–2026 ($MILLION)
TABLE 20. CANADA RAN MARKET, BY COMMUNICATION INFRASTRUCTURE, 2018–2026 ($MILLION)
TABLE 21. CANADA RAN MARKET, BY TECHNOLOGY, 2018–2026 ($MILLION)
TABLE 22. CANADA RAN MARKET, BY END USER, 2018–2026 ($MILLION)
TABLE 23. MEXICO RAN MARKET, BY COMMUNICATION INFRASTRUCTURE, 2018–2026 ($MILLION)
TABLE 24. MEXICO RAN MARKET, BY TECHNOLOGY, 2018–2026 ($MILLION)
TABLE 25. MEXICO RAN MARKET, BY END USER, 2018–2026 ($MILLION)
TABLE 26. EUROPE RAN MARKET, BY COMMUNICATION INFRASTRUCTURE, 2018–2026 ($MILLION)
TABLE 27. EUROPE RAN MARKET, BY TECHNOLOGY, 2018–2026 ($MILLION)
TABLE 28. EUROPE RAN MARKET, BY END USER, 2018–2026 ($MILLION)
TABLE 29. UK RAN MARKET, BY COMMUNICATION INFRASTRUCTURE, 2018–2026 ($MILLION)
TABLE 30. UK RAN MARKET, BY TECHNOLOGY, 2018–2026 ($MILLION)
TABLE 31. UK RAN MARKET, BY END USER, 2018–2026 ($MILLION)
TABLE 32. GERMANY RAN MARKET, BY COMMUNICATION INFRASTRUCTURE, 2018–2026 ($MILLION)
TABLE 33. GERMANY RAN MARKET, BY TECHNOLOGY, 2018–2026 ($MILLION)
TABLE 34. GERMANY RAN MARKET, BY END USER, 2018–2026 ($MILLION)
TABLE 35. FRANCE RAN MARKET, BY COMMUNICATION INFRASTRUCTURE, 2018–2026 ($MILLION)
TABLE 36. FRANCE RAN MARKET, BY TECHNOLOGY, 2018–2026 ($MILLION)
TABLE 37. FRANCE RAN MARKET, BY END USER, 2018–2026 ($MILLION)
TABLE 38. REST OF EUROPE RAN MARKET, BY COMMUNICATION INFRASTRUCTURE, 2018–2026 ($MILLION)
TABLE 39. REST OF EUROPE RAN MARKET, BY TECHNOLOGY, 2018–2026 ($MILLION)
TABLE 40. REST OF EUROPE RAN MARKET, BY END USER, 2018–2026 ($MILLION)
TABLE 41. ASIA-PACIFIC RAN MARKET, BY COMMUNICATION INFRASTRUCTURE, 2018–2026 ($MILLION)
TABLE 42. ASIA-PACIFIC RAN MARKET, BY TECHNOLOGY, 2018–2026 ($MILLION)
TABLE 43. ASIA-PACIFIC RAN MARKET, BY END USER, 2018–2026 ($MILLION)
TABLE 44. CHINA RAN MARKET, BY COMMUNICATION INFRASTRUCTURE, 2018–2026 ($MILLION)
TABLE 45. CHINA RAN MARKET, BY TECHNOLOGY, 2018–2026 ($MILLION)
TABLE 46. CHINA RAN MARKET, BY END USER, 2018–2026 ($MILLION)
TABLE 47. JAPAN RAN MARKET, BY COMMUNICATION INFRASTRUCTURE, 2018–2026 ($MILLION)
TABLE 48. JAPAN RAN MARKET, BY TECHNOLOGY, 2018–2026 ($MILLION)
TABLE 49. JAPAN RAN MARKET, BY END USER, 2018–2026 ($MILLION)
TABLE 50. INDIA RAN MARKET, BY COMMUNICATION INFRASTRUCTURE, 2018–2026 ($MILLION)
TABLE 51. INDIA RAN MARKET, BY TECHNOLOGY, 2018–2026 ($MILLION)
TABLE 52. INDIA RAN MARKET, BY END USER, 2018–2026 ($MILLION)
TABLE 53. REST OF ASIA-PACIFIC RAN MARKET, BY COMMUNICATION INFRASTRUCTURE, 2018–2026 ($MILLION)
TABLE 54. REST OF ASIA-PACIFIC RAN MARKET, BY TECHNOLOGY, 2018–2026 ($MILLION)
TABLE 55. REST OF ASIA-PACIFIC RAN MARKET, BY END USER, 2018–2026 ($MILLION)
TABLE 56. LAMEA RAN MARKET, BY COMMUNICATION INFRASTRUCTURE, 2018–2026 ($MILLION)
TABLE 57. LAMEA RAN MARKET, BY TECHNOLOGY, 2018–2026 ($MILLION)
TABLE 58. LAMEA RAN MARKET, BY END USER, 2018–2026 ($MILLION)
TABLE 59. LATIN AMERICA RAN MARKET, BY COMMUNICATION INFRASTRUCTURE, 2018–2026 ($MILLION)
TABLE 60. LATIN AMERICA RAN MARKET, BY TECHNOLOGY, 2018–2026 ($MILLION)
TABLE 61. LATIN AMERICA RAN MARKET, BY END USER, 2018–2026 ($MILLION)
TABLE 62. MIDDLE EAST RAN MARKET, BY COMMUNICATION INFRASTRUCTURE, 2018–2026 ($MILLION)
TABLE 63. MIDDLE EAST RAN MARKET, BY TECHNOLOGY, 2018–2026 ($MILLION)
TABLE 64. MIDDLE EAST RAN MARKET, BY END USER, 2018–2026 ($MILLION)
TABLE 65. AFRICA RAN MARKET, BY COMMUNICATION INFRASTRUCTURE, 2018–2026 ($MILLION)
TABLE 66. AFRICA RAN MARKET, BY TECHNOLOGY, 2018–2026 ($MILLION)
TABLE 67. AFRICA RAN MARKET, BY END USER, 2018–2026 ($MILLION)
TABLE 68. ERICSSON: COMPANY SNAPSHOT
TABLE 69. ERICSSON: PRODUCT CATEGORY
TABLE 70. ERICSSON: PRODUCT PORTFOLIO
TABLE 71. FUJITSU: COMPANY SNAPSHOT
TABLE 72. FUJITSU: OPERATING SEGMENTS
TABLE 73. FUJITSU: PRODUCT PORTFOLIO
TABLE 74. HUAWEI TECHNOLOGIES CO., LTD.: COMPANY SNAPSHOT
TABLE 75. HUAWEI TECHNOLOGIES CO., LTD.: OPERATING SEGMENTS
TABLE 76. HUAWEI TECHNOLOGIES CO., LTD.: PRODUCT PORTFOLIO
TABLE 77. HUAWEI TECHNOLOGIES CO., LTD.: KEY STRATEGIC MOVES AND DEVELOPMENTS
TABLE 78. INTEL CORPORATION: COMPANY SNAPSHOT
TABLE 79. INTEL CORPORATION: OPERATING SEGMENTS
TABLE 80. INTEL CORPORATION: PRODUCT PORTFOLIO
TABLE 81. INTEL CORPORATION: KEY STRATEGIC MOVES AND DEVELOPMENTS
TABLE 82. NOKIA CORPORATION: COMPANY SNAPSHOT
TABLE 83. NOKIA CORPORATION: OPERATING SEGMENTS
TABLE 84. NOKIA CORPORATION: PRODUCT PORTFOLIO
TABLE 85. QUALCOMM TECHNOLOGIES, INC.: COMPANY SNAPSHOT
TABLE 86. QUALCOMM TECHNOLOGIES, INC.: PRODUCT CATEGORY
TABLE 87. QUALCOMM TECHNOLOGIES, INC.: PRODUCT PORTFOLIO
TABLE 88. QUALCOMM TECHNOLOGIES: KEY STRATEGIC MOVES AND DEVELOPMENTS
TABLE 89. SAMSUNG ELECTRONICS CO. LTD.: COMPANY SNAPSHOT
TABLE 90. SAMSUNG ELECTRONICS CO. LTD.: OPERATING SEGMENTS
TABLE 91. SAMSUNG ELECTRONICS CO. LTD.: PRODUCT PORTFOLIO
TABLE 92. SAMSUNG ELECTRONICS CO. LTD.: KEY STRATEGIC MOVES AND DEVELOPMENTS
TABLE 93. CISCO SYSTEMS, INC.: COMPANY SNAPSHOT
TABLE 94. CISCO SYSTEMS, INC.: PRODUCT CATEGORIES
TABLE 95. CISCO SYSTEMS, INC.: PRODUCT PORTFOLIO
TABLE 96. ZTE CORPORATION: COMPANY SNAPSHOT
TABLE 97. ZTE CORPORATION: OPERATING SEGMENTS
TABLE 98. ZTE CORPORATION: PRODUCT PORTFOLIO
TABLE 99. ZTE CORPORATION: KEY STRATEGIC MOVES AND DEVELOPMENTS
TABLE 100. NEC CORPORATION: COMPANY SNAPSHOT
TABLE 101. NEC CORPORATION: PRODUCT CATEGORY
TABLE 102. NEC CORPORATION: PRODUCT PORTFOLIO
TABLE 103. NEC CORPORATION: KEY STRATEGIC MOVES AND DEVELOPMENTS
LIST OF FIGURES
FIGURE 01. KEY MARKET SEGMENTS
FIGURE 02. EXECUTIVE SUMMARY, BY SEGMENTATION
FIGURE 03. EXECUTIVE SUMMARY, BY REGION
FIGURE 04. TOP IMPACTING FACTORS
FIGURE 05. TOP INVESTMENT POCKETS
FIGURE 06. LOW BARGAINING POWER OF SUPPLIERS
FIGURE 07. MODERATE THREAT OF NEW ENTRANTS
FIGURE 08. MODERATE THREAT OF SUBSTITUTES
FIGURE 09. HIGH INTENSITY OF RIVALRY
FIGURE 10. MODERATE BARGAINING POWER OF BUYERS
FIGURE 11. PATENT ANALYSIS, BY COUNTRY
FIGURE 12. PATENT ANALYSIS, BY APPLICANT
FIGURE 13. GLOBAL RAN MARKET SHARE, BY COMMUNICATION INFRASTRUCTURE, 2018–2026 (%)
FIGURE 14. GLOBAL RAN MARKET, BY COMMUNICATION INFRASTRUCTURE, 2018-2026 ($MILLION)
FIGURE 15. COMPARATIVE SHARE ANALYSIS SMALL CELL RAN MARKET, BY COUNTRY, 2018 & 2026 (%)
FIGURE 16. COMPARATIVE SHARE ANALYSIS MACRO CELL RAN MARKET, BY COUNTRY, 2018 & 2026 (%)
FIGURE 17. COMPARATIVE SHARE ANALYSIS RAN EQUIPMENT MARKET, BY COUNTRY, 2018 & 2026 (%)
FIGURE 18. COMPARATIVE SHARE ANALYSIS DAS MARKET, BY COUNTRY, 2018 & 2026 (%)
FIGURE 19. GLOBAL RAN MARKET SHARE, BY TECHNOLOGY, 2018–2026 (%)
FIGURE 20. COMPARATIVE SHARE ANALYSIS OF RAN MARKET FOR 2G, BY COUNTRY, 2018 & 2026 (%)
FIGURE 21. COMPARATIVE SHARE ANALYSIS OF RAN MARKET FOR 3G, BY COUNTRY, 2018 & 2026 (%)
FIGURE 22. COMPARATIVE SHARE ANALYSIS OF MERCHANT RAN MARKET FOR 4G, BY COUNTRY, 2018 & 2026 (%)
FIGURE 23. COMPARATIVE SHARE ANALYSIS OF RAN MARKET FOR 5G , BY COUNTRY, 2018 & 2026 (%)
FIGURE 24. GLOBAL RAN MARKET SHARE, BY END USER, 2018–2026 (%)
FIGURE 25. COMPARATIVE SHARE ANALYSIS OF RAN MARKET FOR RESIDENTIAL, BY COUNTRY, 2018 & 2026 (%)
FIGURE 26. COMPARATIVE SHARE ANALYSIS OF RAN MARKET FOR ENTERPRISE, BY COUNTRY, 2018 & 2026 (%)
FIGURE 27. RAN MARKET, BY REGION, 2018-2026 (%)
FIGURE 28. COMPARATIVE SHARE ANALYSIS OF NORTH AMERICA RAN MARKET, BY COUNTRY, 2018–2026 (%)
FIGURE 29. U.S. RAN MARKET, 2018–2026 ($MILLION)
FIGURE 30. CANADA RAN MARKET, 2018–2026 ($MILLION)
FIGURE 31. MEXICO RAN MARKET, 2018–2026 ($MILLION)
FIGURE 32. COMPARATIVE SHARE ANALYSIS OF EUROPE RAN MARKET, BY COUNTRY, 2018–2026 (%)
FIGURE 33. UK RAN MARKET, 2018–2026 ($MILLION)
FIGURE 34. GERMANY RAN MARKET, 2018–2026 ($MILLION)
FIGURE 35. FRANCE RAN MARKET, 2018–2026 ($MILLION)
FIGURE 36. REST OF EUROPE RAN MARKET, 2018–2026 ($MILLION)
FIGURE 37. COMPARATIVE SHARE ANALYSIS OF ASIA-PACIFIC RAN MARKET, BY COUNTRY, 2018–2026 (%)
FIGURE 38. CHINA RAN MARKET, 2018–2026 ($MILLION)
FIGURE 39. JAPAN RAN MARKET, 2018–2026 ($MILLION)
FIGURE 40. INDIA RAN MARKET, 2018–2026 ($MILLION)
FIGURE 41. REST OF ASIA-PACIFIC RAN MARKET, 2018–2026 ($MILLION)
FIGURE 42. COMPARATIVE SHARE ANALYSIS OF LAMEA RAN MARKET, BY COUNTRY, 2018–2026 (%)
FIGURE 43. LATIN AMERICA RAN MARKET, 2018–2026 ($MILLION)
FIGURE 44. MIDDLE EAST RAN MARKET, 2018–2026 ($MILLION)
FIGURE 45. AFRICA RAN MARKET, 2018–2026 ($MILLION)
FIGURE 46. MARKET PLAYER POSITIONING, 2019
FIGURE 47. TOP WINNING STRATEGIES, BY YEAR, 2016-2019*
FIGURE 48. TOP WINNING STRATEGIES, BY DEVELOPMENT, 2016-2019*
FIGURE 49. TOP WINNING STRATEGIES, BY COMPANY, 2016-2019*
FIGURE 50. ERICSSON: R&D EXPENDITURE, 2016–2018 ($MILLION)
FIGURE 51. ERICSSON: REVENUE, 2016–2018 ($MILLION)
FIGURE 52. ERICSSON: REVENUE SHARE BY SEGMENT, 2018 (%)
FIGURE 53. ERICSSON: REVENUE SHARE BY REGION, 2018 (%)
FIGURE 54. R&D EXPENDITURE, 2016–2018 ($MILLION)
FIGURE 55. FUJITSU: NET SALES, 2016–2018 ($MILLION)
FIGURE 56. FUJITSU: REVENUE SHARE BY SEGMENT, 2018 (%)
FIGURE 57. FUJITSU: REVENUE SHARE BY REGION, 2018 (%)
FIGURE 58. R&D EXPENDITURE, 2016–2018 ($MILLION)
FIGURE 59. HUAWEI TECHNOLOGIES CO., LTD.: NET SALES, 2016–2018 ($MILLION)
FIGURE 60. HUAWEI TECHNOLOGIES CO., LTD.: REVENUE SHARE BY BUSINESS, 2018 (%)
FIGURE 61. HUAWEI TECHNOLOGIES CO., LTD.: REVENUE SHARE BY REGION, 2018 (%)
FIGURE 62. R&D EXPENDITURE, 2016–2018 ($MILLION)
FIGURE 63. INTEL CORPORATION: NET SALES, 2018–2018 ($MILLION)
FIGURE 64. INTEL CORPORATION: REVENUE SHARE BY SEGMENT, 2018 (%)
FIGURE 65. INTEL CORPORATION: REVENUE SHARE BY REGION, 2018 (%)
FIGURE 66. R&D EXPENDITURE, 2016–2018 ($MILLION)
FIGURE 67. NOKIA CORPORATION: REVENUE, 2016–2018 ($MILLION)
FIGURE 68. NOKIA CORPORATION: REVENUE SHARE BY SEGMENT, 2018 (%)
FIGURE 69. NOKIA CORPORATION: REVENUE SHARE BY REGION, 2018 (%)
FIGURE 70. R&D EXPENDITURE, 2016–2018 ($MILLION)
FIGURE 71. QUALCOMM TECHNOLOGIES, INC.: REVENUE, 2016–2018 ($MILLION)
FIGURE 72. QUALCOMM TECHNOLOGIES, INC.: REVENUE SHARE BY SEGMENT, 2018 (%)
FIGURE 73. QUALCOMM TECHNOLOGIES, INC.: REVENUE SHARE BY REGION, 2018 (%)
FIGURE 74. R&D EXPENDITURE, 2016–2018 ($MILLION)
FIGURE 75. SAMSUNG ELECTRONICS CO. LTD.: NET SALES, 2016–2018 ($MILLION)
FIGURE 76. SAMSUNG ELECTRONICS CO. LTD.: REVENUE SHARE BY SEGMENT, 2018 (%)
FIGURE 77. SAMSUNG ELECTRONICS CO. LTD.: REVENUE SHARE BY REGION, 2018 (%)
FIGURE 78. R&D EXPENDITURE, 2016–2018 ($MILLION)
FIGURE 79. CISCO SYSTEMS, INC.: REVENUE, 2017–2019 ($MILLION)
FIGURE 80. CISCO SYSTEMS, INC.: REVENUE SHARE BY SEGMENT, 2019 (%)
FIGURE 81. CISCO SYSTEMS, INC.: REVENUE SHARE BY REGION, 2019 (%)
FIGURE 82. ZTE CORPORATION: R&D EXPENDITURE, 2016–2018 ($MILLION)
FIGURE 83. ZTE CORPORATION: REVENUE, 2016–2018 ($MILLION)
FIGURE 84. ZTE CORPORATION: REVENUE SHARE BY SEGMENT, 2018 (%)
FIGURE 85. ZTE CORPORATION: REVENUE SHARE BY REGION, 2018 (%)
FIGURE 86. R&D EXPENDITURE, 2016–2018 ($MILLION)
FIGURE 87. NEC CORPORATION: REVENUE, 2016–2018 ($MILLION)
FIGURE 88. NEC CORPORATION: REVENUE SHARE BY SEGMENT, FY2018 (%)
FIGURE 89. NEC CORPORATION: REVENUE SHARE BY REGION, FY2018 (%)
$5769
$8995
HAVE A QUERY?
OUR CUSTOMER

SIMILAR REPORTS