
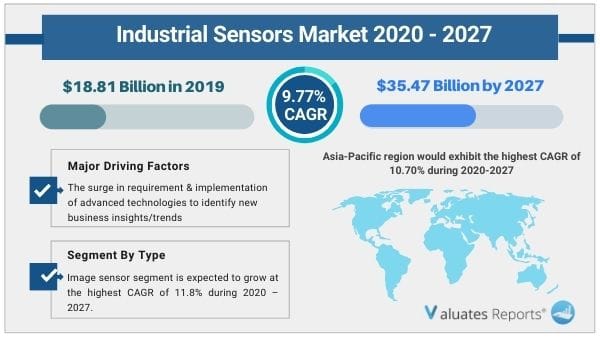
The global industrial sensors market size is expected to reach $35.47 billion by 2027 from $18.81 billion in 2019, growing at a CAGR of 9.77% from 2020 to 2027. Industrial sensor is a device that detects events or changes in the environment and subsequently provides corresponding output. These sensors play a vital role in factory automation and Industry 4.0. Motion sensors, environmental sensors, and vibration sensors are used to monitor the condition of equipment, from linear or angular positioning, tilt sensing, leveling, and shock or fall detection. The manufacturing industry segment impacted negatively, due to COVID-19 Pandemic.
They sense physical input such as light, heat, motion, moisture, pressure, or any other entity, and respond by producing an output on a display or transmit the information in electronic form for further processing. These define major applications in water level monitoring systems, environmental monitoring, energy saving in artificial lighting, and equipment fault diagnostics.
A wide variety of sensors are available for practically any industrial needs. For mission-critical industrial applications, industrial sensors can help to improve processes and offer unmatched asset protection. Sensing technology and its various applications are constantly evolving in line with advancements in technology and business needs. Sensors are available to detect a wide variety of real-world properties–from distance to heat to pressure.
In addition, industrial sensors are used to measure physical, chemical, or biological quantities with accuracy and repeatability. Their reliability has resulted in widespread adoption and use across various industries ranging from healthcare to infrastructure to manufacturing. Furthermore, infrastructure systems such as smart grid, smart homes, smart water networks, and intelligent transportation connect through the concept of Internet of Things (IoT), where there is extensive use of sensors.
By Sensor Type - Image sensor segment will grow at a highest CAGR of 11.8% during 2020 - 2027
The prominent factor that drives the industrial sensors market size includes a surge in penetration of Internet of Things & Industry 4.0, increase in trend of industrial automation. The sensor technology is indispensable to a broad range of industries, providing critical information about parameters such as pressure, temperature, flow, gas, position, and humidity sensors which can have a profound impact on a number of processes or systems. In the modern era, Industry 4.0 improves manufacturing and industrial automation across different industry verticals. Several sensing devices empower robotic processes such as debarring, grinding, polishing, and sanding.
Moreover, promising government regulations towards the usage of industrial sensors fuels the growth of the global industrial sensors market. However, one of the major restraints is the high initial cost of sensors, which hamper the industrial sensors market growth. Although the integration of sensors increases the industrial automation level, it incurs additional cost, thereby limiting their use in cost-sensitive applications. In addition, high development costs involved in R&D activities to develop new products acts as a key challenge, especially for cash-deficient, small- & medium-sized sensor manufacturers. On the contrary, rise in adoption of smart sensors in several industries is anticipated to provide lucrative opportunities for the expansion of the industrial sensors industry during the forecast period.
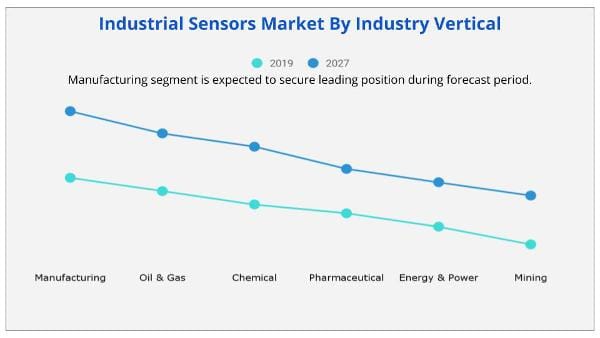
The global industrial sensors market is segmented into sensor type, industry vertical, and region. On the basis of sensor type, it is categorized into image sensor, pressure sensor, temperature sensor, level sensor, position sensor, humidity sensor, force sensor, and others. Depending on industry vertical, it is fragmented into manufacturing, pharmaceutical, chemical, oil & gas, energy & power, and mining.
Region wise, the industrial sensors market trends are analyzed across North America (U.S., Canada, and Mexico), Europe (Germany, France, UK, Italy, and rest of Europe), Asia-Pacific (China, Japan, India, South Korea, and rest of Asia-Pacific), and LAMEA (Latin America, Middle East, and Africa).
The prominent factors that drive the growth of the industrial sensors market include surge in penetration of Internet of Things & Industry 4.0, increase in industrial automation, and supportive government regulations toward the usage of industrial sensors. However, high initial cost of the sensor device restricts the industrial sensors market growth. Conversely, rise in adoption of smart sensors in several industries is anticipated to provide potential opportunities for the expansion of the market.
Competitive analysis and profiles of the major Honeywell, Texas Instruments, Siemens, STMicroelectronics, Amphenol Corporation, TE Connectivity, Rockwell Automation, NXP Semiconductors, Infineon Technologies, and Renesas Electronics are provided in this report.
COVID-19 is having a large impact on both consumers and the economy. Manufacturing hubs have been temporarily working at low efficiency to contain the COVID-19 spread. This has majorly affected the supply chain of the market by creating shortages of materials, components, and finished goods. Lack of business continuity has ensured significant negative impacts on shareholder returns, and revenue, which are expected to create financial disruptions in the industrial sensors industry.
The impact of COVID-19 on the manufacturing industry has significantly affected the global economy. Electronic components, such as sensors, PCBs, LED chips & wafers, ICs, and other semiconductor devices, are mostly imported from China. Attributed to the temporary shutdown of manufacturing units, the prices of semiconductor components have increased by 2-3%, owing to shortage of supplies.
Shortages of critical components and materials have significantly impacted the global supply chains. In addition, reductions in various capital budgets and delays in various planned projects in various end-use industries have hampered the global economy.
By Region - Asia-Pacific region would exhibit the highest CAGR of 10.70% during 2020-2027
|
Report Metric |
Details |
|
Report Name |
Industrial Sensors Market |
|
The Market size value in 2019 |
18.81 Billion USD |
|
The Revenue forecast in 2027 |
35.47 Billion USD |
|
Growth Rate |
CAGR of 9.77% from 2020 to 2027 |
|
Base year considered |
2019 |
|
Forecast period |
2020-2027 |
|
Forecast units |
Value (USD) |
|
Segments covered |
Type, End-User, Offerings, and Region |
|
Report coverage |
Revenue & volume forecast, company share, competitive landscape, growth factors, and trends |
|
Geographic regions covered |
North America, Europe, Asia Pacific, Latin America, Middle East & Africa |
|
Companies covered |
Honeywell, Texas Instruments, Siemens, STMicroelectronics, Amphenol Corporation, TE Connectivity, Rockwell Automation, NXP Semiconductors, Infineon Technologies, and Renesas Electronics |
Ans. The global industrial sensors market size is expected to reach $35.47 billion by 2027 from $18.81 billion in 2019.
Ans. The global industrial sensors market is expected to grow at a compound annual growth rate of 9.77% from 2020 to 2027.
Ans. Honeywell, Texas Instruments, Siemens, STMicroelectronics, Amphenol Corporation, TE Connectivity, Rockwell Automation, NXP Semiconductors, Infineon Technologies, and Renesas Electronics.
CHAPTER 1:INTRODUCTION
1.1.Report description
1.2.Key benefits for stakeholders
1.3.Key market segments
1.4.Research methodology
1.4.1.Primary research
1.4.2.Secondary research
1.4.3.Analyst tools and models
CHAPTER 2:EXECUTIVE SUMMARY
2.1.Key findings
2.1.1.Top impacting factors
2.1.2.Top investment pockets
2.2.CXO perspective
CHAPTER 3:MARKET OVERVIEW
3.1.Market definition and scope
3.2.Key forces shaping industrial sensor market
3.3.Patent analysis
3.3.1.By Region (2015-2020)
3.3.2.By Applicant (2015-2020)
3.4.Market dynamics
3.4.1.Drivers
3.4.1.1.Surge in trends toward Internet of Things and Industry 4.0
3.4.1.2.High growth in industrial automation
3.4.1.3.Promising government regulations towards the usage of industrial sensors
3.4.2.Restraint
3.4.2.1.High initial cost of the sensor device
3.4.3.Opportunity
3.4.3.1.Rise in adoption of smart sensors in several industries
3.5.COVID-19 impact analysis
3.5.1.COVID-19 outbreak
3.5.2.Impact on the market size
3.5.3.End user trends, preferences, and budget impact
3.5.4.Parent industry impact
CHAPTER 4:GLOBAL INDUSTRIAL SENSOR MARKET, BY SENSOR TYPE
4.1.Overview
4.2.Image Sensor
4.2.1.Key market trends, growth factors, and opportunities
4.2.2.Market size and forecast, by region
4.2.3.Market analysis by country
4.3.Pressure Sensor
4.3.1.Key market trends, growth factors, and opportunities
4.3.2.Market size and forecast, by region
4.3.3.Market analysis by country
4.4.Temperature Sensor
4.4.1.Key market trends, growth factors, and opportunities
4.4.2.Market size and forecast, by region
4.4.3.Market analysis by country
4.5.Level sensors
4.5.1.Key market trends, growth factors, and opportunities
4.5.2.Market size and forecast, by region
4.5.3.Market analysis by country
4.6.Position Sensor
4.6.1.Key market trends, growth factors, and opportunities
4.6.2.Market size and forecast, by region
4.6.3.Market analysis by country
4.7.Humidity Sensor
4.7.1.Key market trends, growth factors, and opportunities
4.7.2.Market size and forecast, by region
4.7.3.Market analysis by country
4.8.Force Sensor
4.8.1.Key market trends, growth factors, and opportunities
4.8.2.Market size and forecast, by region
4.8.3.Market analysis by country
4.9.Others
4.9.1.Key market trends, growth factors, and opportunities
4.9.2.Market size and forecast, by region
4.9.3.Market analysis by country
CHAPTER 5:GLOBAL INDUSTRIAL SENSOR MARKET, BY INDUSTRY VERTICAL
5.1.Overview
5.2.Manufacturing
5.2.1.Key market trends, growth factors, and opportunities
5.2.2.Market size and forecast, by region
5.2.3.Market analysis by country
5.3.Oil & Gas
5.3.1.Key market trends, growth factors, and opportunities
5.3.2.Market size and forecast, by region
5.3.3.Market analysis by country
5.4.Chemical
5.4.1.Key market trends, growth factors, and opportunities
5.4.2.Market size and forecast, by region
5.4.3.Market analysis by country
5.5.Pharmaceutical
5.5.1.Key market trends, growth factors, and opportunities
5.5.2.Market size and forecast, by region
5.5.3.Market analysis by country
5.6.Energy & Power
5.6.1.Key market trends, growth factors, and opportunities
5.6.2.Market size and forecast, by region
5.6.3.Market analysis by country
5.7.Mining
5.7.1.Key market trends, growth factors, and opportunities
5.7.2.Market size and forecast, by region
5.7.3.Market analysis by country
CHAPTER 6:INDUSTRIAL SENSOR MARKET, BY REGION
6.1.Overview
6.2.North America
6.2.1.Key market trends, growth factors, and opportunities
6.2.2.Market size and forecast, by sensor type
6.2.3.Market size and forecast, by Industry vertical
6.2.4.Market analysis by country
6.2.4.1.U.S.
6.2.4.1.1.Market size and forecast, by sensor type
6.2.4.1.2.Market size and forecast, by Industry vertical
6.2.4.2.Canada
6.2.4.2.1.Market size and forecast, by sensor type
6.2.4.2.2.Market size and forecast, by Industry vertical
6.2.4.3.Mexico
6.2.4.3.1.Market size and forecast, by sensor type
6.2.4.3.2.Market size and forecast, by Industry vertical
6.3.Europe
6.3.1.Key market trends, growth factors, and opportunities
6.3.2.Market size and forecast, by sensor type
6.3.3.Market size and forecast, by Industry vertical
6.3.4.Market analysis by country
6.3.4.1.Germany
6.3.4.1.1.Market size and forecast, by sensor type
6.3.4.1.2.Market size and forecast, by Industry vertical
6.3.4.2.UK
6.3.4.2.1.Market size and forecast, by sensor type
6.3.4.2.2.Market size and forecast, by Industry vertical
6.3.4.3.France
6.3.4.3.1.Market size and forecast, by sensor type
6.3.4.3.2.Market size and forecast, by Industry vertical
6.3.4.4.Italy
6.3.4.4.1.Market size and forecast, by sensor type
6.3.4.4.2.Market size and forecast, by Industry vertical
6.3.4.5.Rest of Europe
6.3.4.5.1.Market size and forecast, by sensor type
6.3.4.5.2.Market size and forecast, by Industry vertical
6.4.Asia-Pacific
6.4.1.Key market trends, growth factors, and opportunities
6.4.2.Market size and forecast, by sensor type
6.4.3.Market size and forecast, by Industry vertical
6.4.4.Market analysis by country
6.4.4.1.China
6.4.4.1.1.Market size and forecast, by sensor type
6.4.4.1.2.Market size and forecast, by Industry vertical
6.4.4.2.Japan
6.4.4.2.1.Market size and forecast, by sensor type
6.4.4.2.2.Market size and forecast, by Industry vertical
6.4.4.4.South Korea
6.4.4.4.1.Market size and forecast, by sensor Type
6.4.4.4.2.Market size and forecast, by Industry vertical
6.4.4.5.India
6.4.4.5.1.Market size and forecast, by sensor type
6.4.4.5.2.Market size and forecast, by Industry vertical
6.4.4.6.Rest of Asia-Pacific
6.4.4.6.1.Market size and forecast, by sensor type
6.4.4.6.2.Market size and forecast, by Industry vertical
6.5.LAMEA
6.5.1.Key market trends, growth factors, and opportunities
6.5.2.Market size and forecast, by sensor type
6.5.3.Market size and forecast, by Industry vertical
6.5.4.Market analysis by country
6.5.4.1.Latin America
6.5.4.1.1.Market size and forecast, by sensor Type
6.5.4.1.2.Market size and forecast, by Industry vertical
6.5.4.2.Middle East
6.5.4.2.1.Market size and forecast, by sensor Type
6.5.4.2.2.Market size and forecast, by Industry vertical
6.5.4.3.Africa
6.5.4.3.1.Market size and forecast, by sensor Type
6.5.4.3.2.Market size and forecast, by Industry vertical
CHAPTER 7:COMPETITIVE LANDSCAPE
7.1.Introduction
7.2.Top winning strategies
7.2.1.Top winning strategies, by year
7.2.2.Top winning strategies, by development
7.2.3.Top winning strategies, by company
7.3.Market player positioning, 2020
7.4.Competitive dashboard
7.5.Competitive heatmap
CHAPTER 8:COMPANY PROFILES
8.1.Amphenol Corporation
8.1.1.Company overview
8.1.2.Key Executives
8.1.3.Company snapshot
8.1.4.Operating business segments
8.1.5.Product portfolio
8.1.6.R&D Expenditure
8.1.7.Business performance
8.1.8.Key strategic moves and developments
8.2.Honeywell International Inc.
8.2.1.Company overview
8.2.2.Key Executives
8.2.3.Company snapshot
8.2.4.Operating business segments
8.2.5.Product portfolio
8.2.6.R&D Expenditure
8.2.7.Business performance
8.2.8.Key strategic moves and developments
8.3.Infineon Technologies
8.3.1.Company overview
8.3.2.Key Executives
8.3.3.Company snapshot
8.3.4.Operating business segments
8.3.5.Product portfolio
8.3.6.R&D Expenditure
8.3.7.Business performance
8.3.8.Key strategic moves and developments
8.4.NXP Semiconductors
8.4.1.Company overview
8.4.2.Key Executives
8.4.3.Company snapshot
8.4.4.Operating business segments
8.4.5.Product portfolio
8.4.6.R&D Expenditure
8.4.7.Business performance
8.4.8.Key strategic moves and developments
8.5.Renesas Electronics Corporation
8.5.1.Company overview
8.5.2.Key Executives
8.5.3.Company snapshot
8.5.4.Operating business segments
8.5.5.Product portfolio
8.5.6.R&D Expenditure
8.5.7.Business performance
8.5.8.Key strategic moves and developments
8.6.ROCKWELL AUTOMATION, INC.
8.6.1.Company overview
8.6.2.Key Executives
8.6.3.Company snapshot
8.6.4.Operating business segments
8.6.5.Product portfolio
8.6.6.R&D Expenditure
8.6.7.Business performance
8.6.8.Key strategic moves and developments
8.7.Siemens AG
8.7.1.Company overview
8.7.1.Key Executives
8.7.2.Company snapshot
8.7.3.Operating business segments
8.7.4.Product portfolio
8.7.5.R&D Expenditure
8.7.6.Business performance
8.7.7.Key strategic moves and developments
8.8.STMicroelectronics
8.8.1.Company overview
8.8.2.Key Executives
8.8.3.Company snapshot
8.8.4.Operating business segments
8.8.5.Product portfolio
8.8.6.R&D Expenditure
8.8.7.Business performance
8.8.8.Key strategic moves and developments
8.9.TE Connectivity Ltd.
8.9.1.Company overview
8.9.2.Key Executives
8.9.3.Company snapshot
8.9.4.Operating business segments
8.9.5.Product portfolio
8.9.6.R&D Expenditure
8.9.7.Business performance
8.9.8.Key strategic moves and developments
8.10.TEXAS INSTRUMENTS INCORPORATED
8.10.1.Company overview
8.10.2.Key Executives
8.10.3.Company snapshot
8.10.4.Operating business segments
8.10.5.Product portfolio
8.10.6.R&D Expenditure
8.10.7.Business performance
8.10.8.Key strategic moves and developments
LIST OF TABLES
TABLE 01.GLOBAL INDUSTRIAL SENSOR MARKET, BY SENSOR TYPE, 2019–2027($MILLION)
TABLE 02.INDUSTRIAL SENSOR MARKET REVENUE FOR IMAGE SENSOR, BY REGION, 2019–2027($MILLION)
TABLE 03.INDUSTRIAL SENSOR MARKET REVENUE FOR PRESSURE SENSOR, BY REGION, 2019–2027($MILLION)
TABLE 04.INDUSTRIAL SENSOR MARKET REVENUE FOR TEMPERATURE SENSOR, BY REGION, 2019–2027($MILLION)
TABLE 05.INDUSTRIAL SENSOR MARKET REVENUE FOR LEVEL SENSORS, BY REGION, 2019–2027($MILLION)
TABLE 06.INDUSTRIAL SENSOR MARKET REVENUE FOR POSITION SENSOR, BY REGION, 2019–2027($MILLION)
TABLE 07.INDUSTRIAL SENSOR MARKET REVENUE FOR HUMIDITY SENSORS, BY REGION, 2019–2027($MILLION)
TABLE 08.INDUSTRIAL SENSOR MARKET REVENUE FOR FORCE SENSOR, BY REGION, 2019–2027($MILLION)
TABLE 09.INDUSTRIAL SENSOR MARKET REVENUE FOR OTHERS, BY REGION, 2019–2027($MILLION)
TABLE 10.GLOBAL INDUSTRIAL SENSOR MARKET REVENUE, BY INDUSTRY VERTICAL, 2019–2027($MILLION)
TABLE 11.INDUSTRIAL SENSOR MARKET REVENUE FOR MANUFACTURING, BY REGION, 2019–2027($MILLION)
TABLE 12.INDUSTRIAL SENSOR MARKET REVENUE FOR OIL & GAS, BY REGION, 2019–2027($MILLION)
TABLE 13.INDUSTRIAL SENSOR MARKET REVENUE FOR CHEMICAL, BY REGION, 2019–2027($MILLION)
TABLE 14.INDUSTRIAL SENSOR MARKET REVENUE FOR PHARMACEUTICAL, BY REGION, 2019–2027($MILLION)
TABLE 15.INDUSTRIAL SENSOR MARKET REVENUE FOR ENERGY & POWER, BY REGION, 2019–2027($MILLION)
TABLE 16.INDUSTRIAL SENSOR MARKET REVENUE FOR MINING, BY REGION, 2019–2027($MILLION)
TABLE 17.NORTH AMERICA INDUSTRIAL SENSOR MARKET REVENUE, BY SENSOR TYPE, 2019–2027($MILLION)
TABLE 18.NORTH AMERICA INDUSTRIAL SENSOR MARKET REVENUE, BY INDUSTRY VERTICAL, 2019–2027($MILLION)
TABLE 19.U.S. INDUSTRIAL SENSOR MARKET REVENUE, BY SENSOR TYPE, 2019–2027($MILLION)
TABLE 20.U.S. INDUSTRIAL SENSOR MARKET REVENUE, BY INDUSTRY VERTICAL, 2019–2027($MILLION)
TABLE 21.CANADA INDUSTRIAL SENSOR MARKET REVENUE, BY SENSOR TYPE, 2019–2027($MILLION)
TABLE 22.CANADA INDUSTRIAL SENSOR MARKET REVENUE, BY INDUSTRY VERTICAL, 2019–2027($MILLION)
TABLE 23.MEXICO INDUSTRIAL SENSOR MARKET REVENUE, BY SENSOR TYPE, 2019–2027($MILLION)
TABLE 24.MEXICO INDUSTRIAL SENSOR MARKET REVENUE, BY INDUSTRY VERTICAL, 2019–2027($MILLION)
TABLE 25.EUROPE INDUSTRIAL SENSOR MARKET REVENUE, BY SENSOR TYPE, 2019–2027($MILLION)
TABLE 26.EUROPE INDUSTRIAL SENSOR MARKET REVENUE, BY INDUSTRY VERTICAL, 2019–2027($MILLION)
TABLE 27.GERMANY INDUSTRIAL SENSOR MARKET REVENUE, BY SENSOR TYPE, 2019–2027($MILLION)
TABLE 28.GERMANY INDUSTRIAL SENSOR MARKET REVENUE, BY INDUSTRY VERTICAL, 2019–2027($MILLION)
TABLE 29.UK INDUSTRIAL SENSOR MARKET REVENUE, BY SENSOR TYPE, 2019–2027($MILLION)
TABLE 30.UK INDUSTRIAL SENSOR MARKET REVENUE, BY INDUSTRY VERTICAL, 2019–2027($MILLION)
TABLE 31.FRANCE INDUSTRIAL SENSOR MARKET REVENUE, BY SENSOR TYPE, 2019–2027($MILLION)
TABLE 32.FRANCE INDUSTRIAL SENSOR MARKET REVENUE, BY INDUSTRY VERTICAL, 2019–2027($MILLION)
TABLE 33.ITALY INDUSTRIAL SENSOR MARKET REVENUE, BY SENSOR TYPE, 2019–2027($MILLION)
TABLE 34.ITALY INDUSTRIAL SENSOR MARKET REVENUE, BY INDUSTRY VERTICAL, 2019–2027($MILLION)
TABLE 35.REST OF EUROPE INDUSTRIAL SENSOR MARKET REVENUE, BY SENSOR TYPE, 2019–2027($MILLION)
TABLE 36.REST OF EUROPE INDUSTRIAL SENSOR MARKET REVENUE, BY INDUSTRY VERTICAL, 2019–2027($MILLION)
TABLE 37.ASIA-PACIFIC INDUSTRIAL SENSOR MARKET REVENUE, BY SENSOR TYPE, 2019–2027($MILLION)
TABLE 38.ASIA-PACIFIC INDUSTRIAL SENSOR MARKET REVENUE, BY INDUSTRY VERTICAL, 2019–2027($MILLION)
TABLE 39.CHINA INDUSTRIAL SENSOR MARKET REVENUE, BY SENSOR TYPE, 2019–2027($MILLION)
TABLE 40.CHINA INDUSTRIAL SENSOR MARKET REVENUE, BY INDUSTRY VERTICAL, 2019–2027($MILLION)
TABLE 41.JAPAN INDUSTRIAL SENSOR MARKET REVENUE, BY SENSOR TYPE, 2019–2027($MILLION)
TABLE 42.JAPAN INDUSTRIAL SENSOR MARKET REVENUE, BY INDUSTRY VERTICAL, 2019–2027($MILLION)
TABLE 43.SOUTH KOREA INDUSTRIAL SENSOR MARKET REVENUE, BY SENSOR TYPE, 2019–2027($MILLION)
TABLE 44.SOUTH KOREA INDUSTRIAL SENSOR MARKET REVENUE, BY INDUSTRY VERTICAL, 2019–2027($MILLION)
TABLE 45.INDIA INDUSTRIAL SENSOR MARKET REVENUE, BY SENSOR TYPE, 2019–2027($MILLION)
TABLE 46.INDIA INDUSTRIAL SENSOR MARKET REVENUE, BY INDUSTRY VERTICAL, 2019–2027($MILLION)
TABLE 47.REST OF ASIA-PACIFIC INDUSTRIAL SENSOR MARKET REVENUE, BY SENSOR TYPE, 2019–2027($MILLION)
TABLE 48.REST OF ASIA-PACIFIC INDUSTRIAL SENSOR MARKET REVENUE, BY INDUSTRY VERTICAL, 2019–2027($MILLION)
TABLE 49.LAMEA INDUSTRIAL SENSOR MARKET REVENUE, BY SENSOR TYPE, 2019–2027($MILLION)
TABLE 50.LAMEA INDUSTRIAL SENSOR MARKET REVENUE, BY INDUSTRY VERTICAL, 2019–2027($MILLION)
TABLE 51.LATIN AMERICA INDUSTRIAL SENSOR MARKET REVENUE, BY SENSOR TYPE, 2019–2027($MILLION)
TABLE 52.LATIN AMERICA INDUSTRIAL SENSOR MARKET REVENUE, BY INDUSTRY VERTICAL, 2019–2027($MILLION)
TABLE 53.MIDDLE EAST INDUSTRIAL SENSOR MARKET REVENUE, BY SENSOR TYPE, 2019–2027($MILLION)
TABLE 54.MIDDLE EAST INDUSTRIAL SENSOR MARKET REVENUE, BY INDUSTRY VERTICAL, 2019–2027($MILLION)
TABLE 55.AFRICA INDUSTRIAL SENSOR MARKET REVENUE, BY SENSOR TYPE, 2019–2027($MILLION)
TABLE 56.AFRICA INDUSTRIAL SENSOR MARKET REVENUE, BY INDUSTRY VERTICAL, 2019–2027($MILLION)
TABLE 57.AMPHENOL CORPORATION:KEY EXECUTIVES
TABLE 58.AMPHENOL CORPORATION: COMPANY SNAPSHOT
TABLE 59.AMPHENOL CORPORATION: OPERATING SEGMENTS
TABLE 60.AMPHENOL CORPORATION: PRODUCT PORTFOLIO
TABLE 61.AMPHENOL CORPORATION: KEY STRATEGIC MOVES AND DEVELOPMENTS
TABLE 62.HONEYWELL INTERNATIONAL INC.:KEY EXECUTIVES
TABLE 63.HONEYWELL INTERNATIONAL INC.: COMPANY SNAPSHOT
TABLE 64.HONEYWELL INTERNATIONAL INC.: OPERATING SEGMENTS
TABLE 65.HONEYWELL INTERNATIONAL INC.: PRODUCT PORTFOLIO
TABLE 66.HONEYWELL INTERNATIONAL INC.: KEY STRATEGIC MOVES AND DEVELOPMENTS
TABLE 67.INFINEON TECHNOLOGIES:KEY EXECUTIVES
TABLE 68.INFINEON TECHNOLOGIES: COMPANY SNAPSHOT
TABLE 69.INFINEON TECHNOLOGIES: OPERATING SEGMENTS
TABLE 70.INFINEON TECHNOLOGIES: PRODUCT PORTFOLIO
TABLE 71.INFINEON TECHNOLOGIES: KEY STRATEGIC MOVES AND DEVELOPMENTS
TABLE 72.NXP SEMICONDUCTORS:KEY EXECUTIVES
TABLE 73.NXP SEMICONDUCTORS: COMPANY SNAPSHOT
TABLE 74.NXP SEMICONDUCTORS: OPERATING SEGMENTS
TABLE 75.NXP SEMICONDUCTORS: PRODUCT PORTFOLIO
TABLE 76.NXP SEMICONDUCTORS: KEY STRATEGIC MOVES AND DEVELOPMENTS
TABLE 77.RENESAS ELECTRONICS CORPORATION:KEY EXECUTIVES
TABLE 78.RENESAS ELECTRONICS CORPORATION: COMPANY SNAPSHOT
TABLE 79.RENESAS ELECTRONICS CORPORATION: OPERATING SEGMENTS
TABLE 80.RENESAS ELECTRONICS CORPORATION: PRODUCT PORTFOLIO
TABLE 81.RENESAS ELECTRONICS CORPORATION: KEY STRATEGIC MOVES AND DEVELOPMENTS
TABLE 82.ROCKWELL AUTOMATION, INC.:KEY EXECUTIVES
TABLE 83.ROCKWELL AUTOMATION, INC.: COMPANY SNAPSHOT
TABLE 84.ROCKWELL AUTOMATION, INC.: OPERATING SEGMENTS
TABLE 85.ROCKWELL AUTOMATION, INC.: PRODUCT PORTFOLIO
TABLE 86.ROCKWELL AUTOMATION, INC.: KEY STRATEGIC MOVES AND DEVELOPMENTS
TABLE 87.SIEMENS AG: KEY EXECUTIVES
TABLE 88.SIEMENS AG: COMPANY SNAPSHOT
TABLE 89.SIEMENS AG: OPERATING SEGMENTS
TABLE 90.SIEMENS AG: PRODUCT PORTFOLIO
TABLE 91.SIEMENS AG: KEY STRATEGIC MOVES AND DEVELOPMENTS
TABLE 92.STMICROELECTRONICS:KEY EXECUTIVES
TABLE 93.STMICROELECTRONICS: COMPANY SNAPSHOT
TABLE 94.STMICROELECTRONICS: OPERATING SEGMENTS
TABLE 95.STMICROELECTRONICS: PRODUCT PORTFOLIO
TABLE 96.STMICROELECTRONICS: KEY STRATEGIC MOVES AND DEVELOPMENTS
TABLE 97.TE CONNECTIVITY LTD.:KEY EXECUTIVES
TABLE 98.TE CONNECTIVITY LTD.: COMPANY SNAPSHOT
TABLE 99.TE CONNECTIVITY LTD.: OPERATING SEGMENTS
TABLE 100.TE CONNECTIVITY LTD.: PRODUCT PORTFOLIO
TABLE 101.TE CONNECTIVITY LTD.: KEY STRATEGIC MOVES AND DEVELOPMENTS
TABLE 102.TEXAS INSTRUMENTS INCORPORATED:KEY EXECUTIVES
TABLE 103.TEXAS INSTRUMENTS INCORPORATED: COMPANY SNAPSHOT
TABLE 104.TEXAS INSTRUMENTS INCORPORATED: OPERATING SEGMENTS
TABLE 105.TEXAS INSTRUMENTS INCORPORATED: PRODUCT PORTFOLIO
TABLE 106.TEXAS INSTRUMENTS INCORPORATED: KEY STRATEGIC MOVES AND DEVELOPMENTS
LIST OF FIGURES
FIGURE 01.KEY MARKET SEGMENTS
FIGURE 02.EXECUTIVE SUMMARY
FIGURE 03.EXECUTIVE SUMMARY
FIGURE 04.TOP IMPACTING FACTORS
FIGURE 05.TOP INVESTMENT POCKETS
FIGURE 06.MODERATE BARGAINING POWER OF SUPPLIERS
FIGURE 07.HIGH THREAT OF NEW ENTRANTS
FIGURE 08.MODERATE THREAT OF SUBSTITUTES
FIGURE 09.MODERATE INTENSITY OF RIVALRY
FIGURE 10.MODERATE BARGAINING POWER OF BUYERS
FIGURE 11.PATENT ANALYSIS, BY REGION
FIGURE 12.PATENT ANALYSIS, BY APPLICANT
FIGURE 13.GLOBAL INDUSTRIAL SENSOR MARKET, BY SENSOR TYPE, 2020–2027
FIGURE 14.COMPARATIVE SHARE ANALYSIS OF INDUSTRIAL SENSOR MARKET FOR IMAGE SENSOR, BY COUNTRY, 2019 & 2027 (%)
FIGURE 15.COMPARATIVE SHARE ANALYSIS OF INDUSTRIAL SENSOR MARKET FOR PRESSURE SENSOR, BY COUNTRY, 2019 & 2027 (%)
FIGURE 16.COMPARATIVE SHARE ANALYSIS OF SMART SENSORS FOR TEMPERATURE SENSOR MARKET, BY COUNTRY, 2019 & 2027 (%)
FIGURE 17.COMPARATIVE SHARE ANALYSIS OF INDUSTRIAL SENSOR MARKET FOR LEVEL SENSORS, BY COUNTRY, 2019 & 2027 (%)
FIGURE 18.COMPARATIVE SHARE ANALYSIS OF INDUSTRIAL SENSOR MARKET FOR POSITION SENSOR, BY COUNTRY, 2019 & 2027 (%)
FIGURE 19.COMPARATIVE SHARE ANALYSIS OF INDUSTRIAL SENSOR MARKET FOR HUMIDITY SENSORS, BY COUNTRY, 2019 & 2027 (%)
FIGURE 20.COMPARATIVE SHARE ANALYSIS OF INDUSTRIAL SENSOR MARKET FOR FORCE SENSOR, BY COUNTRY, 2019 & 2027 (%)
FIGURE 21.COMPARATIVE SHARE ANALYSIS OF INDUSTRIAL SENSOR MARKET FOR OTHERS, BY COUNTRY, 2019 & 2027 (%)
FIGURE 22.GLOBAL INDUSTRIAL SENSOR MARKET, BY INDUSTRY VERTICAL, 2020–2027
FIGURE 23.COMPARATIVE SHARE ANALYSIS OF INDUSTRIAL SENSOR MARKET FOR MANUFACTURING, BY COUNTRY, 2019 & 2027 (%)
FIGURE 24.COMPARATIVE SHARE ANALYSIS OF SHARE INDUSTRIAL SENSOR MARKET FOR OIL & GAS, BY COUNTRY, 2019 & 2027 (%)
FIGURE 25.COMPARATIVE SHARE ANALYSIS OF INDUSTRIAL SENSOR MARKET FOR CHEMICAL, BY COUNTRY, 2019 & 2027 (%)
FIGURE 26.COMPARATIVE SHARE ANALYSIS OF INDUSTRIAL SENSOR MARKET FOR PHARMACEUTICAL, BY COUNTRY, 2019 & 2027 (%)
FIGURE 27.COMPARATIVE SHARE ANALYSIS OF SHARE INDUSTRIAL SENSOR MARKET FOR ENERGY & POWER, BY COUNTRY, 2019 & 2027 (%)
FIGURE 28.COMPARATIVE SHARE ANALYSIS OF SHARE INDUSTRIAL SENSOR MARKET FOR MINING, BY COUNTRY, 2019 & 2027 (%)
FIGURE 29.INDUSTRIAL SENSOR MARKET, BY REGION, 2020–2027
FIGURE 30.COMPARATIVE SHARE ANALYSIS OF INDUSTRIAL SENSOR MARKET, BY COUNTRY, 2019–2027(%)
FIGURE 31.U.S. INDUSTRIAL SENSOR MARKET REVENUE, 2019–2027($MILLION)
FIGURE 32.CANADA INDUSTRIAL SENSOR MARKET REVENUE, 2019–2027($MILLION)
FIGURE 33.MEXICO INDUSTRIAL SENSOR MARKET REVENUE, 2019–2027($MILLION)
FIGURE 34.COMPARATIVE SHARE ANALYSIS OF INDUSTRIAL SENSOR MARKET, BY COUNTRY, 2019–2027(%)
FIGURE 35.GERMANY INDUSTRIAL SENSOR MARKET REVENUE, 2019–2027($MILLION)
FIGURE 36.UK INDUSTRIAL SENSOR MARKET REVENUE, 2019–2027($MILLION)
FIGURE 37.FRANCE INDUSTRIAL SENSOR MARKET REVENUE, 2019–2027($MILLION)
FIGURE 38.ITALY INDUSTRIAL SENSOR MARKET REVENUE, 2019–2027($MILLION)
FIGURE 39.REST OF EUROPE INDUSTRIAL SENSOR MARKET REVENUE, 2019–2027($MILLION)
FIGURE 40.COMPARATIVE SHARE ANALYSIS OF INDUSTRIAL SENSOR MARKET, BY COUNTRY, 2019–2027(%)
FIGURE 41.CHINA INDUSTRIAL SENSOR MARKET REVENUE, 2019–2027($MILLION)
FIGURE 42.JAPAN INDUSTRIAL SENSOR MARKET REVENUE, 2019–2027($MILLION)
FIGURE 43.SOUTH KOREA INDUSTRIAL SENSOR MARKET REVENUE, 2019–2027($MILLION)
FIGURE 44.INDIA INDUSTRIAL SENSOR MARKET REVENUE, 2019–2027($MILLION)
FIGURE 45.REST OF ASIA-PACIFIC INDUSTRIAL SENSOR MARKET REVENUE, 2019–2027($MILLION)
FIGURE 46.COMPARATIVE SHARE ANALYSIS OF INDUSTRIAL SENSOR MARKET, BY COUNTRY, 2019–2027(%)
FIGURE 47.LATIN AMERICA INDUSTRIAL SENSOR MARKET REVENUE, 2019–2027($MILLION)
FIGURE 48.MIDDLE EAST INDUSTRIAL SENSOR MARKET REVENUE, 2019–2027($MILLION)
FIGURE 49.AFRICA INDUSTRIAL SENSOR MARKET REVENUE, 2019–2027($MILLION)
FIGURE 50.TOP WTOP WINNING STRATEGIES, BY YEAR, 2017–2021
FIGURE 51.TOP WINNING STRATEGIES, BY DEVELOPMENT, 2017–2021 (%)
FIGURE 52.TOP WINNING STRATEGIES, BY COMPANY, 2017–2021
FIGURE 53.MARKET PLAYER POSITIONING, 2020
FIGURE 54.COMPETITIVE DASHBOARD
FIGURE 55.COMPETITIVE HEATMAP OF KEY PLAYERS
FIGURE 56.AMPHENOL CORPORATION: R&D EXPENDITURE, 2018–2020 ($MILLION)
FIGURE 57.AMPHENOL CORPORATION: REVENUE, 2018–2020 ($MILLION)
FIGURE 58.AMPHENOL CORPORATION: REVENUE SHARE, BY SEGMENT, 2020 (%)
FIGURE 59.AMPHENOL CORPORATION: REVENUE SHARE, BY REGION, 2020 (%)
FIGURE 60.HONEYWELL INTERNATIONAL INC.: R&D EXPENDITURE, 2018–2020 ($MILLION)
FIGURE 61.HONEYWELL INTERNATIONAL INC.: REVENUE, 2018–2020 ($MILLION)
FIGURE 62.HONEYWELL INTERNATIONAL INC.: REVENUE SHARE, BY SEGMENT, 2020 (%)
FIGURE 63.HONEYWELL INTERNATIONAL INC.: REVENUE SHARE, BY REGION, 2020 (%)
FIGURE 64.INFINEON TECHNOLOGIES: R&D EXPENDITURE, 2018–2020 ($MILLION)
FIGURE 65.INFINEON TECHNOLOGIES: REVENUE, 2018–2020 ($MILLION)
FIGURE 66.INFINEON TECHNOLOGIES: REVENUE SHARE, BY SEGMENT, 2020 (%)
FIGURE 67.INFINEON TECHNOLOGIES: REVENUE SHARE, BY REGION, 2020 (%)
FIGURE 68.NXP SEMICONDUCTORS: R&D EXPENDITURE, 2018–2020 ($MILLION)
FIGURE 69.NXP SEMICONDUCTORS: REVENUE, 2018–2020 ($MILLION)
FIGURE 70.NXP SEMICONDUCTORS: REVENUE SHARE, BY SEGMENT, 2020 (%)
FIGURE 71.NXP SEMICONDUCTORS: REVENUE SHARE, BY REGION, 2020 (%)
FIGURE 72.RENESAS ELECTRONICS CORPORATION: R&D EXPENDITURE, 2018–2020 ($MILLION)
FIGURE 73.RENESAS ELECTRONICS CORPORATION: REVENUE, 2018–2020 ($MILLION)
FIGURE 74.RENESAS ELECTRONICS CORPORATION: REVENUE SHARE, BY SEGMENT, 2020 (%)
FIGURE 75.RENESAS ELECTRONICS CORPORATION: REVENUE SHARE, BY REGION, 2020 (%)
FIGURE 76.ROCKWELL AUTOMATION, INC: R&D EXPENDITURE, 2018–2020 ($MILLION)
FIGURE 77.ROCKWELL AUTOMATION, INC.: REVENUE, 2018–2020 ($MILLION)
FIGURE 78.ROCKWELL AUTOMATION, INC.: REVENUE SHARE, BY SEGMENT, 2020 (%)
FIGURE 79.ROCKWELL AUTOMATION, INC.: REVENUE SHARE, BY REGION, 2020 (%)
FIGURE 80.SIEMENS AG: R&D EXPENDITURE, 2018–2020 ($MILLION)
FIGURE 81.SIEMENS AG: REVENUE, 2018–2020 ($MILLION)
FIGURE 82.SIEMENS AG: REVENUE SHARE, BY SEGMENT, 2020 (%)
FIGURE 83.SIEMENS AG: REVENUE SHARE, BY REGION, 2020 (%)
FIGURE 84.STMICROELECTRONICS: R&D EXPENDITURE, 2018–2020 ($MILLION)
FIGURE 85.STMICROELECTRONICS: REVENUE, 2018–2020 ($MILLION)
FIGURE 86.STMICROELECTRONICS: REVENUE SHARE, BY SEGMENT, 2020 (%)
FIGURE 87.STMICROELECTRONICS: REVENUE SHARE, BY REGION, 2020 (%)
FIGURE 88.TE CONNECTIVITY LTD.: R&D EXPENDITURE, 2018–2020 ($MILLION)
FIGURE 89.TE CONNECTIVITY LTD.: REVENUE, 2018–2020 ($MILLION)
FIGURE 90.TE CONNECTIVITY LTD.: REVENUE SHARE, BY SEGMENT, 2020 (%)
FIGURE 91.TE CONNECTIVITY LTD.: REVENUE SHARE, BY REGION, 2020 (%)
FIGURE 92.TEXAS INSTRUMENTS INCORPORATED: R&D EXPENDITURE, 2018–2020 ($MILLION)
FIGURE 93.TEXAS INSTRUMENTS INCORPORATED: REVENUE, 2018–2020 ($MILLION)
FIGURE 94.TEXAS INSTRUMENTS INCORPORATED: REVENUE SHARE, BY SEGMENT, 2020 (%)
FIGURE 95.TEXAS INSTRUMENTS INCORPORATED: REVENUE SHARE, BY REGION, 2020 (%)
$6168
$9663
HAVE A QUERY?
OUR CUSTOMER
SIMILAR REPORTS