
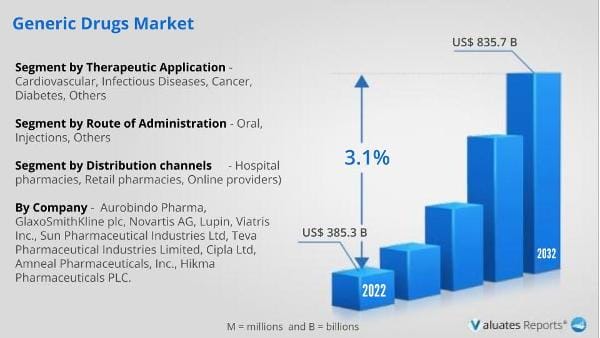
The global generic drugs market was valued at $385.3 billion in 2022, and is projected to reach $835.7 billion by 2032, growing at a CAGR of 8.1% from 2023 to 2032. Generic drugs have the same ingredient as their reference branded drugs. Generic drugs are also available at a lower cost than brand-name medications. The generic drugs are around cost 85% less than branded drugs. The FDA approves patent and exclusivity protection for the branded drug developer to allow them to profit from their innovation and research for several years. During this time, no generics can compete with the brand. However, once the patent has expired generic drugs can enter the market through a shortened FDA approval process. Generic medications need to meet the same quality, safety, and effectiveness standards as brands.
The COVID-19 pandemic affected the generic drugs industry in a negative way, like various other healthcare industries were affected. Overall, the COVID-19 pandemic had a fairly negative impact on the generic drugs industry owing to the decrease in the number of hospital visits during the phase of pandemic. In addition, the number of new generic drugs approvals was also reported to be medium paced. Moreover, factors such as the adoption of various strategies by the market players such as new product launch, merger and acquisitions also created lucrative opportunities for the market to grow in the post pandemic situations.
The growth of Generic Drugs Market Size is majorly driven by rise in prevalence of chronic diseases such as hypertension, asthma and COPD. For instance, according to American Lung Association, in 2020, 12.5 million people, reported a diagnosis of chronic obstructive pulmonary disease (COPD), chronic bronchitis, or emphysema. Moreover, rise in number of patients suffering from cardiovascular diseases is expected to creates remunerative opportunities for the expansion of the Generic Drugs Industry. In addition, key players are adopting various strategies such as product launch, product approval, agreements, partnerships, and collaborations to strengthen their foothold in the market. For instance, in May 2023, Lupin, approval from U.S. FDA for its Abbreviated New Drug Application for Obeticholic Acid Tablets, 5 mg and 10 mg, a generic equivalent of Ocaliva Tablets, 5 mg and 10 mg, of Intercept Pharmaceuticals, Inc.
The demand for generic drugs is not only limited to developed countries but is also being witnessed in the developing countries, such as China, Brazil, and India, which fuels the Generic Drugs Market Growth. Factors such as rise in hospital admissions, increase in number of surgeries, and surge in awareness toward advantages of generic drugs drive the growth of the Generic Drugs Industry.
Furthermore, the rising cost of branded medicines, increase in healthcare expenditure, and growing demand of generic drugs contributes to the growth of Generic Drugs Market Size. In addition, increase in research activities by manufacturers for developing enhanced generic drugs is expected to fuel the growth of the industry.
However, concern related to quality of generic drugs is hampering market growth.
The global generic drugs market is segmented into therapeutic application, route of administration, distribution channel, and region. By therapeutic application, the market is classified into cardiovascular, infectious diseases, cancer, diabetes, and others. Based on the route of administration, the market is classified into oral, injection and others. Depending on distribution channel, it is classified into hospital pharmacies, retail pharmacies and online providers. Region wise, the market is studied across North America (the U.S., Canada, and Mexico), Europe (Germany, France, UK, Italy, Spain, and rest of Europe), Asia-Pacific (Japan, China, Australia, India, South Korea, and rest of Asia-Pacific), and LAMEA (Brazil, South Africa, Saudi Arabia, and rest of LAMEA).
On the basis of the therapeutic application, the market is classified into cardiovascular, infectious diseases, cancer, diabetes, and others. The others segment dominated the global Generic Drugs Market Share in 2022 and is expected to remain dominant throughout the forecast period owing to increase in adoption of generic drugs for treatment of target diseases and rise in demand for generic drugs among the patient population. Moreover, surge in geriatric population is anticipated to boost the demand for generic drugs. This is attributed to the fact that aged individuals are highly susceptible to chronic diseases.
Based on the route of administration, the market is classified into oral, injection, and others. The oral segment dominated the global Generic Drugs Market Share in 2022 and is expected to remain dominant throughout the Generic Drugs Market Forecast period owing to an increase in the prevalence of chronic diseases and the growing adoption of the oral route of administration.
Based on distribution channel the market is divided into hospital pharmacies, retail pharmacies and online providers. The retail pharmacy treatment segment dominated the global market in 2022 and is anticipated to continue this trend during the forecast period. This is attributed to an increase in the adoption of generic drugs in retail pharmacies. In addition, an increase in the number of hospital visits drives the growth of the market. Moreover, improvements in the healthcare infrastructure are anticipated to drive the growth of market.
By region, the generic drugs market is analyzed across North America, Europe, Asia-Pacific, and LAMEA. In 2022, North America was the dominant region and is expected to continue this trend throughout the forecast period owing to high prevalence of chronic disorders such as diabetes, asthma and bronchitis, strong presence of key players, and surge in number of generic drugs approved in the region. However, Asia-Pacific is expected to witness the highest CAGR during the analysis period, owing to the presence of high populace countries such as India and China, which, in turn, increases the number of chances of suffering from various types of chronic and fatal conditions and rise number of strategies and trends adopted by the market players that include product development, product approval, partnership, collaboration, and agreement.
Competition Analysis
Competitive analysis and profiles of the major players in the generic drugs market such as Amneal Pharmaceuticals, Aurobindo Pharma, Cipla, GlaxoSmithKline Plc, Hikma Pharmaceuticals, Lupin Pharmaceuticals, Sandoz International GmbH, Sun Pharmaceuticals, Teva Pharmaceutical Industries Ltd and Viatris Inc. are provided in this report. These players have adopted product launch and product development as key developmental strategies to improve the product portfolio of the generic drugs.
In May 2023, Lupin Limited announced that its Canada subsidiary, Lupin Pharma Canada Ltd., has received approval from Health Canada to market a generic version of Spiriva (tiotropium bromide inhalation powder) for the treatment of chronic obstructive pulmonary disease (COPD)
In March 2023, Lupin Limited announced that it has received approval from the U.S. FDA for its Abbreviated New Drug Application for Tenofovir Alafenamide Tablets,25 mg, a generic equivalent of Vemlidy Tablets, 25 mg, of Gilead Sciences, Inc.
In March 2022, Viatris Inc. andKindeva Drug Delivery L.P.today announced that, Mylan Pharmaceuticals Inc., a Viatris subsidiary, has received approval from the U.S. Food and Drug Administration (FDA) for its Generic Version of Symbicort Inhalation Aerosol, Breyna (Budesonide and Formoterol Fumarate Dihydrate Inhalation Aerosol).
| Report Metric | Details |
| Report Name | Global Generic Drugs Market |
| Base Year | 2022 |
| Forecasted years | 2023-2032 |
| By Company |
Aurobindo Pharma, GlaxoSmithKline plc, Novartis AG, Lupin, Viatris Inc., Sun Pharmaceutical Industries Ltd, Teva Pharmaceutical Industries Limited, Cipla Ltd, Amneal Pharmaceuticals, Inc., Hikma Pharmaceuticals PLC |
| Segment by Distribution Channels |
|
| Segment by Therapeutic Application |
|
| Segment by Route of Administration |
|
| CAGR | 8.1% |
| Forecast units | USD billion in value |
| Report coverage | Revenue and volume forecast, company share, competitive landscape, growth factors and trends |
Ans. The global generic drugs market was valued at $385.3 billion in 2022, and is projected to reach $835.7 billion by 2032, growing at a CAGR of 8.1% from 2023 to 2032.
Ans. The global generic drugs market is expected to grow at a compound annual growth rate of 8.1% from 2023 to 2032.
Ans. Aurobindo Pharma, GlaxoSmithKline plc, Novartis AG, Lupin, Viatris Inc., Sun Pharmaceutical Industries Ltd, Teva Pharmaceutical Industries Limited, Cipla Ltd, Amneal Pharmaceuticals, Inc., Hikma Pharmaceuticals PLC.
Ans. The market for generic medications is expanding significantly, partly as a result of factors including the patents for many branded medications expiring, mounting demand to lower healthcare costs, and the rising incidence of chronic diseases globally.
Ans. The others segment dominated the global Generic Drugs Market Share in 2022 and is expected to remain dominant throughout the forecast period owing to increase in adoption of generic drugs for treatment of target diseases and rise in demand for generic drugs among the patient population.
Ans. The oral segment dominated the global Generic Drugs Market Share in 2022 and is expected to remain dominant throughout the Generic Drugs Market Forecast period.
Ans. The retail pharmacy treatment segment dominated the global market in 2022 and is anticipated to continue this trend during the forecast period.
CHAPTER 1: INTRODUCTION
1.1. Report description
1.2. Key market segments
1.3. Key benefits to the stakeholders
1.4. Research Methodology
1.4.1. Primary research
1.4.2. Secondary research
1.4.3. Analyst tools and models
CHAPTER 2: EXECUTIVE SUMMARY
2.1. CXO Perspective
CHAPTER 3: MARKET OVERVIEW
3.1. Market definition and scope
3.2. Key findings
3.2.1. Top impacting factors
3.2.2. Top investment pockets
3.3. Porter’s five forces analysis
3.3.1. Moderate bargaining power of suppliers
3.3.2. Moderate threat of new entrants
3.3.3. Moderate threat of substitutes
3.3.4. Moderate intensity of rivalry
3.3.5. Moderate bargaining power of buyers
3.4. Market dynamics
3.4.1. Drivers
3.4.1.1. Rise in prevalence of chronic diseases
3.4.1.2. Availability of low-cost generic drugs
3.4.1.3. Upsurge in geriatric population
3.4.2. Restraints
3.4.2.1. Concern related to the quality of generic drugs
3.4.3. Opportunities
3.4.3.1. Patent expiry of branded drugs and new product approvals
3.5. COVID-19 Impact Analysis on the market
CHAPTER 4: GENERIC DRUGS MARKET, BY THERAPEUTIC APPLICATION
4.1. Overview
4.1.1. Market size and forecast
4.2. Cardiovascular
4.2.1. Key market trends, growth factors and opportunities
4.2.2. Market size and forecast, by region
4.2.3. Market share analysis by country
4.3. Infectious Diseases
4.3.1. Key market trends, growth factors and opportunities
4.3.2. Market size and forecast, by region
4.3.3. Market share analysis by country
4.4. Cancer
4.4.1. Key market trends, growth factors and opportunities
4.4.2. Market size and forecast, by region
4.4.3. Market share analysis by country
4.5. Diabetes
4.5.1. Key market trends, growth factors and opportunities
4.5.2. Market size and forecast, by region
4.5.3. Market share analysis by country
4.6. Others
4.6.1. Key market trends, growth factors and opportunities
4.6.2. Market size and forecast, by region
4.6.3. Market share analysis by country
CHAPTER 5: GENERIC DRUGS MARKET, BY ROUTE OF ADMINISTRATION
5.1. Overview
5.1.1. Market size and forecast
5.2. Oral
5.2.1. Key market trends, growth factors and opportunities
5.2.2. Market size and forecast, by region
5.2.3. Market share analysis by country
5.3. Injections
5.3.1. Key market trends, growth factors and opportunities
5.3.2. Market size and forecast, by region
5.3.3. Market share analysis by country
5.4. Others
5.4.1. Key market trends, growth factors and opportunities
5.4.2. Market size and forecast, by region
5.4.3. Market share analysis by country
CHAPTER 6: GENERIC DRUGS MARKET, BY DISTRIBUTION CHANNEL
6.1. Overview
6.1.1. Market size and forecast
6.2. Hospital pharmacies
6.2.1. Key market trends, growth factors and opportunities
6.2.2. Market size and forecast, by region
6.2.3. Market share analysis by country
6.3. Retail pharmacies
6.3.1. Key market trends, growth factors and opportunities
6.3.2. Market size and forecast, by region
6.3.3. Market share analysis by country
6.4. Online providers
6.4.1. Key market trends, growth factors and opportunities
6.4.2. Market size and forecast, by region
6.4.3. Market share analysis by country
CHAPTER 7: GENERIC DRUGS MARKET, BY REGION
7.1. Overview
7.1.1. Market size and forecast By Region
7.2. North America
7.2.1. Key trends and opportunities
7.2.2. Market size and forecast, by Therapeutic Application
7.2.3. Market size and forecast, by Route of Administration
7.2.4. Market size and forecast, by Distribution Channel
7.2.5. Market size and forecast, by country
7.2.5.1. U.S.
7.2.5.1.1. Key market trends, growth factors and opportunities
7.2.5.1.2. Market size and forecast, by Therapeutic Application
7.2.5.1.3. Market size and forecast, by Route of Administration
7.2.5.1.4. Market size and forecast, by Distribution Channel
7.2.5.2. Canada
7.2.5.2.1. Key market trends, growth factors and opportunities
7.2.5.2.2. Market size and forecast, by Therapeutic Application
7.2.5.2.3. Market size and forecast, by Route of Administration
7.2.5.2.4. Market size and forecast, by Distribution Channel
7.2.5.3. Mexico
7.2.5.3.1. Key market trends, growth factors and opportunities
7.2.5.3.2. Market size and forecast, by Therapeutic Application
7.2.5.3.3. Market size and forecast, by Route of Administration
7.2.5.3.4. Market size and forecast, by Distribution Channel
7.3. Europe
7.3.1. Key trends and opportunities
7.3.2. Market size and forecast, by Therapeutic Application
7.3.3. Market size and forecast, by Route of Administration
7.3.4. Market size and forecast, by Distribution Channel
7.3.5. Market size and forecast, by country
7.3.5.1. Germany
7.3.5.1.1. Key market trends, growth factors and opportunities
7.3.5.1.2. Market size and forecast, by Therapeutic Application
7.3.5.1.3. Market size and forecast, by Route of Administration
7.3.5.1.4. Market size and forecast, by Distribution Channel
7.3.5.2. France
7.3.5.2.1. Key market trends, growth factors and opportunities
7.3.5.2.2. Market size and forecast, by Therapeutic Application
7.3.5.2.3. Market size and forecast, by Route of Administration
7.3.5.2.4. Market size and forecast, by Distribution Channel
7.3.5.3. UK
7.3.5.3.1. Key market trends, growth factors and opportunities
7.3.5.3.2. Market size and forecast, by Therapeutic Application
7.3.5.3.3. Market size and forecast, by Route of Administration
7.3.5.3.4. Market size and forecast, by Distribution Channel
7.3.5.4. Italy
7.3.5.4.1. Key market trends, growth factors and opportunities
7.3.5.4.2. Market size and forecast, by Therapeutic Application
7.3.5.4.3. Market size and forecast, by Route of Administration
7.3.5.4.4. Market size and forecast, by Distribution Channel
7.3.5.5. Spain
7.3.5.5.1. Key market trends, growth factors and opportunities
7.3.5.5.2. Market size and forecast, by Therapeutic Application
7.3.5.5.3. Market size and forecast, by Route of Administration
7.3.5.5.4. Market size and forecast, by Distribution Channel
7.3.5.6. Rest of Europe
7.3.5.6.1. Key market trends, growth factors and opportunities
7.3.5.6.2. Market size and forecast, by Therapeutic Application
7.3.5.6.3. Market size and forecast, by Route of Administration
7.3.5.6.4. Market size and forecast, by Distribution Channel
7.4. Asia-Pacific
7.4.1. Key trends and opportunities
7.4.2. Market size and forecast, by Therapeutic Application
7.4.3. Market size and forecast, by Route of Administration
7.4.4. Market size and forecast, by Distribution Channel
7.4.5. Market size and forecast, by country
7.4.5.1. China
7.4.5.1.1. Key market trends, growth factors and opportunities
7.4.5.1.2. Market size and forecast, by Therapeutic Application
7.4.5.1.3. Market size and forecast, by Route of Administration
7.4.5.1.4. Market size and forecast, by Distribution Channel
7.4.5.2. Japan
7.4.5.2.1. Key market trends, growth factors and opportunities
7.4.5.2.2. Market size and forecast, by Therapeutic Application
7.4.5.2.3. Market size and forecast, by Route of Administration
7.4.5.2.4. Market size and forecast, by Distribution Channel
7.4.5.3. India
7.4.5.3.1. Key market trends, growth factors and opportunities
7.4.5.3.2. Market size and forecast, by Therapeutic Application
7.4.5.3.3. Market size and forecast, by Route of Administration
7.4.5.3.4. Market size and forecast, by Distribution Channel
7.4.5.4. Australia
7.4.5.4.1. Key market trends, growth factors and opportunities
7.4.5.4.2. Market size and forecast, by Therapeutic Application
7.4.5.4.3. Market size and forecast, by Route of Administration
7.4.5.4.4. Market size and forecast, by Distribution Channel
7.4.5.5. South Korea
7.4.5.5.1. Key market trends, growth factors and opportunities
7.4.5.5.2. Market size and forecast, by Therapeutic Application
7.4.5.5.3. Market size and forecast, by Route of Administration
7.4.5.5.4. Market size and forecast, by Distribution Channel
7.4.5.6. Rest of Asia-Pacific
7.4.5.6.1. Key market trends, growth factors and opportunities
7.4.5.6.2. Market size and forecast, by Therapeutic Application
7.4.5.6.3. Market size and forecast, by Route of Administration
7.4.5.6.4. Market size and forecast, by Distribution Channel
7.5. LAMEA
7.5.1. Key trends and opportunities
7.5.2. Market size and forecast, by Therapeutic Application
7.5.3. Market size and forecast, by Route of Administration
7.5.4. Market size and forecast, by Distribution Channel
7.5.5. Market size and forecast, by country
7.5.5.1. Brazil
7.5.5.1.1. Key market trends, growth factors and opportunities
7.5.5.1.2. Market size and forecast, by Therapeutic Application
7.5.5.1.3. Market size and forecast, by Route of Administration
7.5.5.1.4. Market size and forecast, by Distribution Channel
7.5.5.2. Saudi Arabia
7.5.5.2.1. Key market trends, growth factors and opportunities
7.5.5.2.2. Market size and forecast, by Therapeutic Application
7.5.5.2.3. Market size and forecast, by Route of Administration
7.5.5.2.4. Market size and forecast, by Distribution Channel
7.5.5.3. South Africa
7.5.5.3.1. Key market trends, growth factors and opportunities
7.5.5.3.2. Market size and forecast, by Therapeutic Application
7.5.5.3.3. Market size and forecast, by Route of Administration
7.5.5.3.4. Market size and forecast, by Distribution Channel
7.5.5.4. Rest of LAMEA
7.5.5.4.1. Key market trends, growth factors and opportunities
7.5.5.4.2. Market size and forecast, by Therapeutic Application
7.5.5.4.3. Market size and forecast, by Route of Administration
7.5.5.4.4. Market size and forecast, by Distribution Channel
CHAPTER 8: COMPETITIVE LANDSCAPE
8.1. Introduction
8.2. Top winning strategies
8.3. Product Mapping of Top 10 Player
8.4. Competitive Dashboard
8.5. Competitive Heatmap
8.6. Top player positioning, 2022
CHAPTER 9: COMPANY PROFILES
9.1. Amneal Pharmaceuticals, Inc.
9.1.1. Company overview
9.1.2. Key Executives
9.1.3. Company snapshot
9.1.4. Operating business segments
9.1.5. Product portfolio
9.1.6. Business performance
9.2. GlaxoSmithKline plc
9.2.1. Company overview
9.2.2. Key Executives
9.2.3. Company snapshot
9.2.4. Operating business segments
9.2.5. Product portfolio
9.2.6. Business performance
9.3. Novartis AG
9.3.1. Company overview
9.3.2. Key Executives
9.3.3. Company snapshot
9.3.4. Operating business segments
9.3.5. Product portfolio
9.3.6. Business performance
9.4. Teva Pharmaceutical Industries Limited
9.4.1. Company overview
9.4.2. Key Executives
9.4.3. Company snapshot
9.4.4. Operating business segments
9.4.5. Product portfolio
9.4.6. Business performance
9.5. Viatris Inc.
9.5.1. Company overview
9.5.2. Key Executives
9.5.3. Company snapshot
9.5.4. Operating business segments
9.5.5. Product portfolio
9.5.6. Business performance
9.5.7. Key strategic moves and developments
9.6. Sun Pharmaceutical Industries Ltd
9.6.1. Company overview
9.6.2. Key Executives
9.6.3. Company snapshot
9.6.4. Operating business segments
9.6.5. Product portfolio
9.6.6. Business performance
9.7. Cipla Ltd
9.7.1. Company overview
9.7.2. Key Executives
9.7.3. Company snapshot
9.7.4. Operating business segments
9.7.5. Product portfolio
9.7.6. Business performance
9.8. Hikma Pharmaceuticals PLC
9.8.1. Company overview
9.8.2. Key Executives
9.8.3. Company snapshot
9.8.4. Operating business segments
9.8.5. Product portfolio
9.8.6. Business performance
9.9. Lupin
9.9.1. Company overview
9.9.2. Key Executives
9.9.3. Company snapshot
9.9.4. Operating business segments
9.9.5. Product portfolio
9.9.6. Business performance
9.9.7. Key strategic moves and developments
9.10. Aurobindo Pharma
9.10.1. Company overview
9.10.2. Key Executives
9.10.3. Company snapshot
9.10.4. Operating business segments
9.10.5. Product portfolio
9.10.6. Business performance
LIST OF TABLES
TABLE 01. GLOBAL GENERIC DRUGS MARKET, BY THERAPEUTIC APPLICATION, 2022-2032 ($MILLION)
TABLE 02. GENERIC DRUGS MARKET FOR CARDIOVASCULAR, BY REGION, 2022-2032 ($MILLION)
TABLE 03. GENERIC DRUGS MARKET FOR INFECTIOUS DISEASES, BY REGION, 2022-2032 ($MILLION)
TABLE 04. GENERIC DRUGS MARKET FOR CANCER, BY REGION, 2022-2032 ($MILLION)
TABLE 05. GENERIC DRUGS MARKET FOR DIABETES, BY REGION, 2022-2032 ($MILLION)
TABLE 06. GENERIC DRUGS MARKET FOR OTHERS, BY REGION, 2022-2032 ($MILLION)
TABLE 07. GLOBAL GENERIC DRUGS MARKET, BY ROUTE OF ADMINISTRATION, 2022-2032 ($MILLION)
TABLE 08. GENERIC DRUGS MARKET FOR ORAL, BY REGION, 2022-2032 ($MILLION)
TABLE 09. GENERIC DRUGS MARKET FOR INJECTIONS, BY REGION, 2022-2032 ($MILLION)
TABLE 10. GENERIC DRUGS MARKET FOR OTHERS, BY REGION, 2022-2032 ($MILLION)
TABLE 11. GLOBAL GENERIC DRUGS MARKET, BY DISTRIBUTION CHANNEL, 2022-2032 ($MILLION)
TABLE 12. GENERIC DRUGS MARKET FOR HOSPITAL PHARMACIES, BY REGION, 2022-2032 ($MILLION)
TABLE 13. GENERIC DRUGS MARKET FOR RETAIL PHARMACIES, BY REGION, 2022-2032 ($MILLION)
TABLE 14. GENERIC DRUGS MARKET FOR ONLINE PROVIDERS, BY REGION, 2022-2032 ($MILLION)
TABLE 15. GENERIC DRUGS MARKET, BY REGION, 2022-2032 ($MILLION)
TABLE 16. NORTH AMERICA GENERIC DRUGS MARKET, BY THERAPEUTIC APPLICATION, 2022-2032 ($MILLION)
TABLE 17. NORTH AMERICA GENERIC DRUGS MARKET, BY ROUTE OF ADMINISTRATION, 2022-2032 ($MILLION)
TABLE 18. NORTH AMERICA GENERIC DRUGS MARKET, BY DISTRIBUTION CHANNEL, 2022-2032 ($MILLION)
TABLE 19. NORTH AMERICA GENERIC DRUGS MARKET, BY COUNTRY, 2022-2032 ($MILLION)
TABLE 20. U.S. GENERIC DRUGS MARKET, BY THERAPEUTIC APPLICATION, 2022-2032 ($MILLION)
TABLE 21. U.S. GENERIC DRUGS MARKET, BY ROUTE OF ADMINISTRATION, 2022-2032 ($MILLION)
TABLE 22. U.S. GENERIC DRUGS MARKET, BY DISTRIBUTION CHANNEL, 2022-2032 ($MILLION)
TABLE 23. CANADA GENERIC DRUGS MARKET, BY THERAPEUTIC APPLICATION, 2022-2032 ($MILLION)
TABLE 24. CANADA GENERIC DRUGS MARKET, BY ROUTE OF ADMINISTRATION, 2022-2032 ($MILLION)
TABLE 25. CANADA GENERIC DRUGS MARKET, BY DISTRIBUTION CHANNEL, 2022-2032 ($MILLION)
TABLE 26. MEXICO GENERIC DRUGS MARKET, BY THERAPEUTIC APPLICATION, 2022-2032 ($MILLION)
TABLE 27. MEXICO GENERIC DRUGS MARKET, BY ROUTE OF ADMINISTRATION, 2022-2032 ($MILLION)
TABLE 28. MEXICO GENERIC DRUGS MARKET, BY DISTRIBUTION CHANNEL, 2022-2032 ($MILLION)
TABLE 29. EUROPE GENERIC DRUGS MARKET, BY THERAPEUTIC APPLICATION, 2022-2032 ($MILLION)
TABLE 30. EUROPE GENERIC DRUGS MARKET, BY ROUTE OF ADMINISTRATION, 2022-2032 ($MILLION)
TABLE 31. EUROPE GENERIC DRUGS MARKET, BY DISTRIBUTION CHANNEL, 2022-2032 ($MILLION)
TABLE 32. EUROPE GENERIC DRUGS MARKET, BY COUNTRY, 2022-2032 ($MILLION)
TABLE 33. GERMANY GENERIC DRUGS MARKET, BY THERAPEUTIC APPLICATION, 2022-2032 ($MILLION)
TABLE 34. GERMANY GENERIC DRUGS MARKET, BY ROUTE OF ADMINISTRATION, 2022-2032 ($MILLION)
TABLE 35. GERMANY GENERIC DRUGS MARKET, BY DISTRIBUTION CHANNEL, 2022-2032 ($MILLION)
TABLE 36. FRANCE GENERIC DRUGS MARKET, BY THERAPEUTIC APPLICATION, 2022-2032 ($MILLION)
TABLE 37. FRANCE GENERIC DRUGS MARKET, BY ROUTE OF ADMINISTRATION, 2022-2032 ($MILLION)
TABLE 38. FRANCE GENERIC DRUGS MARKET, BY DISTRIBUTION CHANNEL, 2022-2032 ($MILLION)
TABLE 39. UK GENERIC DRUGS MARKET, BY THERAPEUTIC APPLICATION, 2022-2032 ($MILLION)
TABLE 40. UK GENERIC DRUGS MARKET, BY ROUTE OF ADMINISTRATION, 2022-2032 ($MILLION)
TABLE 41. UK GENERIC DRUGS MARKET, BY DISTRIBUTION CHANNEL, 2022-2032 ($MILLION)
TABLE 42. ITALY GENERIC DRUGS MARKET, BY THERAPEUTIC APPLICATION, 2022-2032 ($MILLION)
TABLE 43. ITALY GENERIC DRUGS MARKET, BY ROUTE OF ADMINISTRATION, 2022-2032 ($MILLION)
TABLE 44. ITALY GENERIC DRUGS MARKET, BY DISTRIBUTION CHANNEL, 2022-2032 ($MILLION)
TABLE 45. SPAIN GENERIC DRUGS MARKET, BY THERAPEUTIC APPLICATION, 2022-2032 ($MILLION)
TABLE 46. SPAIN GENERIC DRUGS MARKET, BY ROUTE OF ADMINISTRATION, 2022-2032 ($MILLION)
TABLE 47. SPAIN GENERIC DRUGS MARKET, BY DISTRIBUTION CHANNEL, 2022-2032 ($MILLION)
TABLE 48. REST OF EUROPE GENERIC DRUGS MARKET, BY THERAPEUTIC APPLICATION, 2022-2032 ($MILLION)
TABLE 49. REST OF EUROPE GENERIC DRUGS MARKET, BY ROUTE OF ADMINISTRATION, 2022-2032 ($MILLION)
TABLE 50. REST OF EUROPE GENERIC DRUGS MARKET, BY DISTRIBUTION CHANNEL, 2022-2032 ($MILLION)
TABLE 51. ASIA-PACIFIC GENERIC DRUGS MARKET, BY THERAPEUTIC APPLICATION, 2022-2032 ($MILLION)
TABLE 52. ASIA-PACIFIC GENERIC DRUGS MARKET, BY ROUTE OF ADMINISTRATION, 2022-2032 ($MILLION)
TABLE 53. ASIA-PACIFIC GENERIC DRUGS MARKET, BY DISTRIBUTION CHANNEL, 2022-2032 ($MILLION)
TABLE 54. ASIA-PACIFIC GENERIC DRUGS MARKET, BY COUNTRY, 2022-2032 ($MILLION)
TABLE 55. CHINA GENERIC DRUGS MARKET, BY THERAPEUTIC APPLICATION, 2022-2032 ($MILLION)
TABLE 56. CHINA GENERIC DRUGS MARKET, BY ROUTE OF ADMINISTRATION, 2022-2032 ($MILLION)
TABLE 57. CHINA GENERIC DRUGS MARKET, BY DISTRIBUTION CHANNEL, 2022-2032 ($MILLION)
TABLE 58. JAPAN GENERIC DRUGS MARKET, BY THERAPEUTIC APPLICATION, 2022-2032 ($MILLION)
TABLE 59. JAPAN GENERIC DRUGS MARKET, BY ROUTE OF ADMINISTRATION, 2022-2032 ($MILLION)
TABLE 60. JAPAN GENERIC DRUGS MARKET, BY DISTRIBUTION CHANNEL, 2022-2032 ($MILLION)
TABLE 61. INDIA GENERIC DRUGS MARKET, BY THERAPEUTIC APPLICATION, 2022-2032 ($MILLION)
TABLE 62. INDIA GENERIC DRUGS MARKET, BY ROUTE OF ADMINISTRATION, 2022-2032 ($MILLION)
TABLE 63. INDIA GENERIC DRUGS MARKET, BY DISTRIBUTION CHANNEL, 2022-2032 ($MILLION)
TABLE 64. AUSTRALIA GENERIC DRUGS MARKET, BY THERAPEUTIC APPLICATION, 2022-2032 ($MILLION)
TABLE 65. AUSTRALIA GENERIC DRUGS MARKET, BY ROUTE OF ADMINISTRATION, 2022-2032 ($MILLION)
TABLE 66. AUSTRALIA GENERIC DRUGS MARKET, BY DISTRIBUTION CHANNEL, 2022-2032 ($MILLION)
TABLE 67. SOUTH KOREA GENERIC DRUGS MARKET, BY THERAPEUTIC APPLICATION, 2022-2032 ($MILLION)
TABLE 68. SOUTH KOREA GENERIC DRUGS MARKET, BY ROUTE OF ADMINISTRATION, 2022-2032 ($MILLION)
TABLE 69. SOUTH KOREA GENERIC DRUGS MARKET, BY DISTRIBUTION CHANNEL, 2022-2032 ($MILLION)
TABLE 70. REST OF ASIA-PACIFIC GENERIC DRUGS MARKET, BY THERAPEUTIC APPLICATION, 2022-2032 ($MILLION)
TABLE 71. REST OF ASIA-PACIFIC GENERIC DRUGS MARKET, BY ROUTE OF ADMINISTRATION, 2022-2032 ($MILLION)
TABLE 72. REST OF ASIA-PACIFIC GENERIC DRUGS MARKET, BY DISTRIBUTION CHANNEL, 2022-2032 ($MILLION)
TABLE 73. LAMEA GENERIC DRUGS MARKET, BY THERAPEUTIC APPLICATION, 2022-2032 ($MILLION)
TABLE 74. LAMEA GENERIC DRUGS MARKET, BY ROUTE OF ADMINISTRATION, 2022-2032 ($MILLION)
TABLE 75. LAMEA GENERIC DRUGS MARKET, BY DISTRIBUTION CHANNEL, 2022-2032 ($MILLION)
TABLE 76. LAMEA GENERIC DRUGS MARKET, BY COUNTRY, 2022-2032 ($MILLION)
TABLE 77. BRAZIL GENERIC DRUGS MARKET, BY THERAPEUTIC APPLICATION, 2022-2032 ($MILLION)
TABLE 78. BRAZIL GENERIC DRUGS MARKET, BY ROUTE OF ADMINISTRATION, 2022-2032 ($MILLION)
TABLE 79. BRAZIL GENERIC DRUGS MARKET, BY DISTRIBUTION CHANNEL, 2022-2032 ($MILLION)
TABLE 80. SAUDI ARABIA GENERIC DRUGS MARKET, BY THERAPEUTIC APPLICATION, 2022-2032 ($MILLION)
TABLE 81. SAUDI ARABIA GENERIC DRUGS MARKET, BY ROUTE OF ADMINISTRATION, 2022-2032 ($MILLION)
TABLE 82. SAUDI ARABIA GENERIC DRUGS MARKET, BY DISTRIBUTION CHANNEL, 2022-2032 ($MILLION)
TABLE 83. SOUTH AFRICA GENERIC DRUGS MARKET, BY THERAPEUTIC APPLICATION, 2022-2032 ($MILLION)
TABLE 84. SOUTH AFRICA GENERIC DRUGS MARKET, BY ROUTE OF ADMINISTRATION, 2022-2032 ($MILLION)
TABLE 85. SOUTH AFRICA GENERIC DRUGS MARKET, BY DISTRIBUTION CHANNEL, 2022-2032 ($MILLION)
TABLE 86. REST OF LAMEA GENERIC DRUGS MARKET, BY THERAPEUTIC APPLICATION, 2022-2032 ($MILLION)
TABLE 87. REST OF LAMEA GENERIC DRUGS MARKET, BY ROUTE OF ADMINISTRATION, 2022-2032 ($MILLION)
TABLE 88. REST OF LAMEA GENERIC DRUGS MARKET, BY DISTRIBUTION CHANNEL, 2022-2032 ($MILLION)
TABLE 89. AMNEAL PHARMACEUTICALS, INC.: KEY EXECUTIVES
TABLE 90. AMNEAL PHARMACEUTICALS, INC.: COMPANY SNAPSHOT
TABLE 91. AMNEAL PHARMACEUTICALS, INC.: PRODUCT SEGMENTS
TABLE 92. AMNEAL PHARMACEUTICALS, INC.: PRODUCT PORTFOLIO
TABLE 93. GLAXOSMITHKLINE PLC: KEY EXECUTIVES
TABLE 94. GLAXOSMITHKLINE PLC: COMPANY SNAPSHOT
TABLE 95. GLAXOSMITHKLINE PLC: PRODUCT SEGMENTS
TABLE 96. GLAXOSMITHKLINE PLC: PRODUCT PORTFOLIO
TABLE 97. NOVARTIS AG: KEY EXECUTIVES
TABLE 98. NOVARTIS AG: COMPANY SNAPSHOT
TABLE 99. NOVARTIS AG: PRODUCT SEGMENTS
TABLE 100. NOVARTIS AG: PRODUCT PORTFOLIO
TABLE 101. TEVA PHARMACEUTICAL INDUSTRIES LIMITED: KEY EXECUTIVES
TABLE 102. TEVA PHARMACEUTICAL INDUSTRIES LIMITED: COMPANY SNAPSHOT
TABLE 103. TEVA PHARMACEUTICAL INDUSTRIES LIMITED: PRODUCT SEGMENTS
TABLE 104. TEVA PHARMACEUTICAL INDUSTRIES LIMITED: PRODUCT PORTFOLIO
TABLE 105. VIATRIS INC.: KEY EXECUTIVES
TABLE 106. VIATRIS INC.: COMPANY SNAPSHOT
TABLE 107. VIATRIS INC.: PRODUCT SEGMENTS
TABLE 108. VIATRIS INC.: PRODUCT PORTFOLIO
TABLE 109. VIATRIS INC.: KEY STRATERGIES
TABLE 110. SUN PHARMACEUTICAL INDUSTRIES LTD: KEY EXECUTIVES
TABLE 111. SUN PHARMACEUTICAL INDUSTRIES LTD: COMPANY SNAPSHOT
TABLE 112. SUN PHARMACEUTICAL INDUSTRIES LTD: PRODUCT SEGMENTS
TABLE 113. SUN PHARMACEUTICAL INDUSTRIES LTD: PRODUCT PORTFOLIO
TABLE 114. CIPLA LTD: KEY EXECUTIVES
TABLE 115. CIPLA LTD: COMPANY SNAPSHOT
TABLE 116. CIPLA LTD: PRODUCT SEGMENTS
TABLE 117. CIPLA LTD: PRODUCT PORTFOLIO
TABLE 118. HIKMA PHARMACEUTICALS PLC: KEY EXECUTIVES
TABLE 119. HIKMA PHARMACEUTICALS PLC: COMPANY SNAPSHOT
TABLE 120. HIKMA PHARMACEUTICALS PLC: PRODUCT SEGMENTS
TABLE 121. HIKMA PHARMACEUTICALS PLC: PRODUCT PORTFOLIO
TABLE 122. LUPIN: KEY EXECUTIVES
TABLE 123. LUPIN: COMPANY SNAPSHOT
TABLE 124. LUPIN: PRODUCT SEGMENTS
TABLE 125. LUPIN: PRODUCT PORTFOLIO
TABLE 126. LUPIN: KEY STRATERGIES
TABLE 127. AUROBINDO PHARMA: KEY EXECUTIVES
TABLE 128. AUROBINDO PHARMA: COMPANY SNAPSHOT
TABLE 129. AUROBINDO PHARMA: PRODUCT SEGMENTS
TABLE 130. AUROBINDO PHARMA: PRODUCT PORTFOLIO
LIST OF FIGURES
FIGURE 01. GENERIC DRUGS MARKET, 2022-2032
FIGURE 02. SEGMENTATION OF GENERIC DRUGS MARKET, 2022-2032
FIGURE 03. TOP INVESTMENT POCKETS IN GENERIC DRUGS MARKET (2023-2032)
FIGURE 04. MODERATE BARGAINING POWER OF SUPPLIERS
FIGURE 05. MODERATE THREAT OF NEW ENTRANTS
FIGURE 06. MODERATE THREAT OF SUBSTITUTES
FIGURE 07. MODERATE INTENSITY OF RIVALRY
FIGURE 08. MODERATE BARGAINING POWER OF BUYERS
FIGURE 09. DRIVERS, RESTRAINTS AND OPPORTUNITIES: GLOBALGENERIC DRUGS MARKET
FIGURE 09. GENERIC DRUGS MARKET, BY THERAPEUTIC APPLICATION, 2022(%)
FIGURE 10. COMPARATIVE SHARE ANALYSIS OF GENERIC DRUGS MARKET FOR CARDIOVASCULAR, BY COUNTRY 2022 AND 2032(%)
FIGURE 11. COMPARATIVE SHARE ANALYSIS OF GENERIC DRUGS MARKET FOR INFECTIOUS DISEASES, BY COUNTRY 2022 AND 2032(%)
FIGURE 12. COMPARATIVE SHARE ANALYSIS OF GENERIC DRUGS MARKET FOR CANCER, BY COUNTRY 2022 AND 2032(%)
FIGURE 13. COMPARATIVE SHARE ANALYSIS OF GENERIC DRUGS MARKET FOR DIABETES, BY COUNTRY 2022 AND 2032(%)
FIGURE 14. COMPARATIVE SHARE ANALYSIS OF GENERIC DRUGS MARKET FOR OTHERS, BY COUNTRY 2022 AND 2032(%)
FIGURE 15. GENERIC DRUGS MARKET, BY ROUTE OF ADMINISTRATION, 2022(%)
FIGURE 16. COMPARATIVE SHARE ANALYSIS OF GENERIC DRUGS MARKET FOR ORAL, BY COUNTRY 2022 AND 2032(%)
FIGURE 17. COMPARATIVE SHARE ANALYSIS OF GENERIC DRUGS MARKET FOR INJECTIONS, BY COUNTRY 2022 AND 2032(%)
FIGURE 18. COMPARATIVE SHARE ANALYSIS OF GENERIC DRUGS MARKET FOR OTHERS, BY COUNTRY 2022 AND 2032(%)
FIGURE 19. GENERIC DRUGS MARKET, BY DISTRIBUTION CHANNEL, 2022(%)
FIGURE 20. COMPARATIVE SHARE ANALYSIS OF GENERIC DRUGS MARKET FOR HOSPITAL PHARMACIES, BY COUNTRY 2022 AND 2032(%)
FIGURE 21. COMPARATIVE SHARE ANALYSIS OF GENERIC DRUGS MARKET FOR RETAIL PHARMACIES, BY COUNTRY 2022 AND 2032(%)
FIGURE 22. COMPARATIVE SHARE ANALYSIS OF GENERIC DRUGS MARKET FOR ONLINE PROVIDERS, BY COUNTRY 2022 AND 2032(%)
FIGURE 23. GENERIC DRUGS MARKET BY REGION, 2022
FIGURE 24. U.S. GENERIC DRUGS MARKET, 2022-2032 ($MILLION)
FIGURE 25. CANADA GENERIC DRUGS MARKET, 2022-2032 ($MILLION)
FIGURE 26. MEXICO GENERIC DRUGS MARKET, 2022-2032 ($MILLION)
FIGURE 27. GERMANY GENERIC DRUGS MARKET, 2022-2032 ($MILLION)
FIGURE 28. FRANCE GENERIC DRUGS MARKET, 2022-2032 ($MILLION)
FIGURE 29. UK GENERIC DRUGS MARKET, 2022-2032 ($MILLION)
FIGURE 30. ITALY GENERIC DRUGS MARKET, 2022-2032 ($MILLION)
FIGURE 31. SPAIN GENERIC DRUGS MARKET, 2022-2032 ($MILLION)
FIGURE 32. REST OF EUROPE GENERIC DRUGS MARKET, 2022-2032 ($MILLION)
FIGURE 33. CHINA GENERIC DRUGS MARKET, 2022-2032 ($MILLION)
FIGURE 34. JAPAN GENERIC DRUGS MARKET, 2022-2032 ($MILLION)
FIGURE 35. INDIA GENERIC DRUGS MARKET, 2022-2032 ($MILLION)
FIGURE 36. AUSTRALIA GENERIC DRUGS MARKET, 2022-2032 ($MILLION)
FIGURE 37. SOUTH KOREA GENERIC DRUGS MARKET, 2022-2032 ($MILLION)
FIGURE 38. REST OF ASIA-PACIFIC GENERIC DRUGS MARKET, 2022-2032 ($MILLION)
FIGURE 39. BRAZIL GENERIC DRUGS MARKET, 2022-2032 ($MILLION)
FIGURE 40. SAUDI ARABIA GENERIC DRUGS MARKET, 2022-2032 ($MILLION)
FIGURE 41. SOUTH AFRICA GENERIC DRUGS MARKET, 2022-2032 ($MILLION)
FIGURE 42. REST OF LAMEA GENERIC DRUGS MARKET, 2022-2032 ($MILLION)
FIGURE 43. TOP WINNING STRATEGIES, BY YEAR
FIGURE 44. TOP WINNING STRATEGIES, BY DEVELOPMENT
FIGURE 45. TOP WINNING STRATEGIES, BY COMPANY
FIGURE 46. PRODUCT MAPPING OF TOP 10 PLAYERS
FIGURE 47. COMPETITIVE DASHBOARD
FIGURE 48. COMPETITIVE HEATMAP: GENERIC DRUGS MARKET
FIGURE 49. TOP PLAYER POSITIONING, 2022
FIGURE 50. AMNEAL PHARMACEUTICALS, INC.: NET SALES, 2020-2022 ($MILLION)
FIGURE 51. AMNEAL PHARMACEUTICALS, INC.: REVENUE SHARE BY SEGMENT, 2022 (%)
FIGURE 52. GLAXOSMITHKLINE PLC: NET SALES, 2020-2022 ($MILLION)
FIGURE 53. GLAXOSMITHKLINE PLC: REVENUE SHARE BY SEGMENT, 2022 (%)
FIGURE 54. GLAXOSMITHKLINE PLC: REVENUE SHARE BY REGION, 2022 (%)
FIGURE 55. NOVARTIS AG: NET SALES, 2020-2022 ($MILLION)
FIGURE 56. NOVARTIS AG: REVENUE SHARE BY SEGMENT, 2022 (%)
FIGURE 57. NOVARTIS AG: REVENUE SHARE BY REGION, 2022 (%)
FIGURE 58. TEVA PHARMACEUTICAL INDUSTRIES LIMITED: NET REVENUE, 2020-2022 ($MILLION)
FIGURE 59. TEVA PHARMACEUTICAL INDUSTRIES LIMITED: REVENUE SHARE BY SEGMENT, 2022 (%)
FIGURE 60. VIATRIS INC.: NET SALES, 2020-2022 ($MILLION)
FIGURE 61. VIATRIS INC.: REVENUE SHARE BY SEGMENT, 2022 (%)
FIGURE 62. SUN PHARMACEUTICAL INDUSTRIES LTD: NET REVENUE, 2020-2022 ($MILLION)
FIGURE 63. SUN PHARMACEUTICAL INDUSTRIES LTD: REVENUE SHARE BY REGION, 2021 (%)
FIGURE 64. CIPLA LTD: SALES REVENUE, 2020-2022 ($MILLION)
FIGURE 65. CIPLA LTD: REVENUE SHARE BY SEGMENT, 2022 (%)
FIGURE 66. CIPLA LTD: REVENUE SHARE BY REGION, 2022 (%)
FIGURE 67. HIKMA PHARMACEUTICALS PLC: NET REVENUE, 2020-2022 ($MILLION)
FIGURE 68. HIKMA PHARMACEUTICALS PLC: REVENUE SHARE BY SEGMENT, 2022 (%)
FIGURE 69. HIKMA PHARMACEUTICALS PLC: REVENUE SHARE BY REGION, 2021 (%)
FIGURE 70. LUPIN: NET SALES, 2020-2022 ($MILLION)
FIGURE 71. LUPIN: REVENUE SHARE BY REGION, 2022 (%)
FIGURE 72. AUROBINDO PHARMA: NET REVENUE, 2020-2022 ($MILLION)
FIGURE 73. AUROBINDO PHARMA: REVENUE SHARE BY REGION, 2021 (%)
$5730
$6450
$9600
HAVE A QUERY?
OUR CUSTOMER

SIMILAR REPORTS