
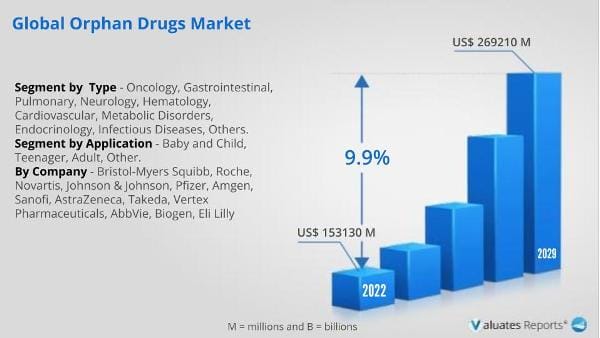
The global Orphan Drugs market was valued at USD 153130 million in 2022 and is anticipated to reach USD 269210 million by 2029, witnessing a CAGR of 9.9% during the forecast period 2023-2029.
Because of favorable government laws and a rise in the prevalence of rare diseases, the market for orphan drugs is growing.
Increasing R&D efforts will aid the growth of the orphan medication industry globally. Due to the significant development potential in undeveloped emerging nations and the rise in new indications for well-known orphan drugs, market expansion is predicted to be lucrative throughout the projection period.
Orphan pharmaceuticals are prescription medications that are used to diagnose and treat rare medical disorders. Since they are designed to treat a specific public health need and are intended for a small patient population, these medications frequently have a small market. They can be used to successfully treat a wide range of neurological, viral, chronic, chronically progressive, metabolic, hematologic, and oncological disorders. All of these life-threatening, degenerative, and crippling diseases lymphoma, glioma, leukemia, cystic fibrosis, ovarian cancer, immunologic, multiple myeloma, and renal cell carcinoma require specific treatment options that are effective for their individual symptoms. This element is anticipated to fuel the orphan drug market's expansion.
Governments from all around the world have implemented a range of incentives and regulations to encourage the development of orphan drugs. These consist of heightened market exclusivity, tax benefits, research subsidies, and expedited regulatory processes. These incentives have encouraged pharmaceutical companies to work on developing orphan medications. This element is anticipated to fuel the orphan drug market's expansion.
The advancement of diagnostic techniques and genetic studies has increased our understanding of rare diseases. This made it possible to identify specific molecular targets and pathways that orphan medicines can target, increasing the likelihood of successful drug development. This element is anticipated to fuel the orphan drug market's expansion.
Patient advocacy groups are crucial for advocating research funding, informing the public about rare diseases, and promoting the development of orphan drugs. Their campaigns have raised awareness of these diseases and boosted public and governmental support for the development of orphan medications. This element is anticipated to fuel the orphan drug market's expansion.
One of the main producers of orphan drugs worldwide, Bristol-Myers Squibb has a market share of about 10%. Roche and Novartis are two more top producers.
Over 40% of sales are made in North America, which is the largest market, followed by Asia-Pacific. The big patient population, the presence of significant market players, and the tremendous investment in orphan medicines have all led to North America's strong market share and the development of sophisticated products.
Oncology is the largest sector by type, accounting for more than 60% of the market.
Regarding applicability, the adult market accounts for about 40% of the market.
| Report Metric | Details |
| Report Name | Global Orphan Drugs Market |
| Base Year | 2022 |
| Forecasted years | 2023-2029 |
| By Company |
|
| Segment by Type |
|
| Segment by Application |
|
| By Region |
|
| Forecast units | USD million in value |
| Report coverage | Revenue and volume forecast, company share, competitive landscape, growth factors and trends |
Ans. The global Orphan Drugs market was valued at US$ 153130 million in 2022 and is anticipated to reach US$ 269210 million by 2029.
Ans. The global Orphan Drugs market is expected to grow at a compound annual growth rate of 9.9% from 2023 to 2029.
Ans. Some of the key players are Pfizer, Sanofi, AstraZeneca, Eisai, Daiichi Sankyo Company, Bayer, GlaxoSmithKline, Merck & Co, Johnson & Johnson, Biogen, Takeda, Amgen & Others.
1 Report Overview
1.1 Study Scope
1.2 Market Analysis by Type
1.2.1 Global Orphan Drugs Market Size Growth Rate by Type: 2018 VS 2022 VS 2029
1.2.2 Oncology
1.2.3 Pulmonary
1.2.4 Neurology
1.2.5 Hematology
1.2.6 Endocrinology
1.2.7 Cardio-vascular
1.2.8 Metabolic Disorders
1.2.9 Others
1.3 Market by Application
1.3.1 Global Orphan Drugs Market Growth by Application: 2018 VS 2022 VS 2029
1.3.2 Baby and Child
1.3.3 Teenager
1.3.4 Adult
1.3.5 Other
1.4 Study Objectives
1.5 Years Considered
1.6 Years Considered
2 Global Growth Trends
2.1 Global Orphan Drugs Market Perspective (2018-2029)
2.2 Orphan Drugs Growth Trends by Region
2.2.1 Global Orphan Drugs Market Size by Region: 2018 VS 2022 VS 2029
2.2.2 Orphan Drugs Historic Market Size by Region (2018-2023)
2.2.3 Orphan Drugs Forecasted Market Size by Region (2024-2029)
2.3 Orphan Drugs Market Dynamics
2.3.1 Orphan Drugs Industry Trends
2.3.2 Orphan Drugs Market Drivers
2.3.3 Orphan Drugs Market Challenges
2.3.4 Orphan Drugs Market Restraints
3 Competition Landscape by Key Players
3.1 Global Top Orphan Drugs Players by Revenue
3.1.1 Global Top Orphan Drugs Players by Revenue (2018-2023)
3.1.2 Global Orphan Drugs Revenue Market Share by Players (2018-2023)
3.2 Global Orphan Drugs Market Share by Company Type (Tier 1, Tier 2, and Tier 3)
3.3 Players Covered: Ranking by Orphan Drugs Revenue
3.4 Global Orphan Drugs Market Concentration Ratio
3.4.1 Global Orphan Drugs Market Concentration Ratio (CR5 and HHI)
3.4.2 Global Top 10 and Top 5 Companies by Orphan Drugs Revenue in 2022
3.5 Orphan Drugs Key Players Head office and Area Served
3.6 Key Players Orphan Drugs Product Solution and Service
3.7 Date of Enter into Orphan Drugs Market
3.8 Mergers & Acquisitions, Expansion Plans
4 Orphan Drugs Breakdown Data by Type
4.1 Global Orphan Drugs Historic Market Size by Type (2018-2023)
4.2 Global Orphan Drugs Forecasted Market Size by Type (2024-2029)
5 Orphan Drugs Breakdown Data by Application
5.1 Global Orphan Drugs Historic Market Size by Application (2018-2023)
5.2 Global Orphan Drugs Forecasted Market Size by Application (2024-2029)
6 North America
6.1 North America Orphan Drugs Market Size (2018-2029)
6.2 North America Orphan Drugs Market Growth Rate by Country: 2018 VS 2022 VS 2029
6.3 North America Orphan Drugs Market Size by Country (2018-2023)
6.4 North America Orphan Drugs Market Size by Country (2024-2029)
6.5 United States
6.6 Canada
7 Europe
7.1 Europe Orphan Drugs Market Size (2018-2029)
7.2 Europe Orphan Drugs Market Growth Rate by Country: 2018 VS 2022 VS 2029
7.3 Europe Orphan Drugs Market Size by Country (2018-2023)
7.4 Europe Orphan Drugs Market Size by Country (2024-2029)
7.5 Germany
7.6 France
7.7 U.K.
7.8 Italy
7.9 Russia
7.10 Nordic Countries
8 Asia-Pacific
8.1 Asia-Pacific Orphan Drugs Market Size (2018-2029)
8.2 Asia-Pacific Orphan Drugs Market Growth Rate by Region: 2018 VS 2022 VS 2029
8.3 Asia-Pacific Orphan Drugs Market Size by Region (2018-2023)
8.4 Asia-Pacific Orphan Drugs Market Size by Region (2024-2029)
8.5 China
8.6 Japan
8.7 South Korea
8.8 Southeast Asia
8.9 India
8.10 Australia
9 Latin America
9.1 Latin America Orphan Drugs Market Size (2018-2029)
9.2 Latin America Orphan Drugs Market Growth Rate by Country: 2018 VS 2022 VS 2029
9.3 Latin America Orphan Drugs Market Size by Country (2018-2023)
9.4 Latin America Orphan Drugs Market Size by Country (2024-2029)
9.5 Mexico
9.6 Brazil
10 Middle East & Africa
10.1 Middle East & Africa Orphan Drugs Market Size (2018-2029)
10.2 Middle East & Africa Orphan Drugs Market Growth Rate by Country: 2018 VS 2022 VS 2029
10.3 Middle East & Africa Orphan Drugs Market Size by Country (2018-2023)
10.4 Middle East & Africa Orphan Drugs Market Size by Country (2024-2029)
10.5 Turkey
10.6 Saudi Arabia
10.7 UAE
11 Key Players Profiles
11.1 Bristol-Myers Squibb
11.1.1 Bristol-Myers Squibb Company Detail
11.1.2 Bristol-Myers Squibb Business Overview
11.1.3 Bristol-Myers Squibb Orphan Drugs Introduction
11.1.4 Bristol-Myers Squibb Revenue in Orphan Drugs Business (2018-2023)
11.1.5 Bristol-Myers Squibb Recent Development
11.2 Roche
11.2.1 Roche Company Detail
11.2.2 Roche Business Overview
11.2.3 Roche Orphan Drugs Introduction
11.2.4 Roche Revenue in Orphan Drugs Business (2018-2023)
11.2.5 Roche Recent Development
11.3 Novartis
11.3.1 Novartis Company Detail
11.3.2 Novartis Business Overview
11.3.3 Novartis Orphan Drugs Introduction
11.3.4 Novartis Revenue in Orphan Drugs Business (2018-2023)
11.3.5 Novartis Recent Development
11.4 Johnson & Johnson
11.4.1 Johnson & Johnson Company Detail
11.4.2 Johnson & Johnson Business Overview
11.4.3 Johnson & Johnson Orphan Drugs Introduction
11.4.4 Johnson & Johnson Revenue in Orphan Drugs Business (2018-2023)
11.4.5 Johnson & Johnson Recent Development
11.5 Pfizer
11.5.1 Pfizer Company Detail
11.5.2 Pfizer Business Overview
11.5.3 Pfizer Orphan Drugs Introduction
11.5.4 Pfizer Revenue in Orphan Drugs Business (2018-2023)
11.5.5 Pfizer Recent Development
11.6 Amgen
11.6.1 Amgen Company Detail
11.6.2 Amgen Business Overview
11.6.3 Amgen Orphan Drugs Introduction
11.6.4 Amgen Revenue in Orphan Drugs Business (2018-2023)
11.6.5 Amgen Recent Development
11.7 Sanofi
11.7.1 Sanofi Company Detail
11.7.2 Sanofi Business Overview
11.7.3 Sanofi Orphan Drugs Introduction
11.7.4 Sanofi Revenue in Orphan Drugs Business (2018-2023)
11.7.5 Sanofi Recent Development
11.8 AstraZeneca
11.8.1 AstraZeneca Company Detail
11.8.2 AstraZeneca Business Overview
11.8.3 AstraZeneca Orphan Drugs Introduction
11.8.4 AstraZeneca Revenue in Orphan Drugs Business (2018-2023)
11.8.5 AstraZeneca Recent Development
11.9 Takeda
11.9.1 Takeda Company Detail
11.9.2 Takeda Business Overview
11.9.3 Takeda Orphan Drugs Introduction
11.9.4 Takeda Revenue in Orphan Drugs Business (2018-2023)
11.9.5 Takeda Recent Development
11.10 Vertex Pharmaceuticals
11.10.1 Vertex Pharmaceuticals Company Detail
11.10.2 Vertex Pharmaceuticals Business Overview
11.10.3 Vertex Pharmaceuticals Orphan Drugs Introduction
11.10.4 Vertex Pharmaceuticals Revenue in Orphan Drugs Business (2018-2023)
11.10.5 Vertex Pharmaceuticals Recent Development
11.11 AbbVie
11.11.1 AbbVie Company Detail
11.11.2 AbbVie Business Overview
11.11.3 AbbVie Orphan Drugs Introduction
11.11.4 AbbVie Revenue in Orphan Drugs Business (2018-2023)
11.11.5 AbbVie Recent Development
11.12 Biogen
11.12.1 Biogen Company Detail
11.12.2 Biogen Business Overview
11.12.3 Biogen Orphan Drugs Introduction
11.12.4 Biogen Revenue in Orphan Drugs Business (2018-2023)
11.12.5 Biogen Recent Development
11.13 Eli Lilly
11.13.1 Eli Lilly Company Detail
11.13.2 Eli Lilly Business Overview
11.13.3 Eli Lilly Orphan Drugs Introduction
11.13.4 Eli Lilly Revenue in Orphan Drugs Business (2018-2023)
11.13.5 Eli Lilly Recent Development
12 Analyst's Viewpoints/Conclusions
13 Appendix
13.1 Research Methodology
13.1.1 Methodology/Research Approach
13.1.2 Data Source
13.2 Disclaimer
13.3 Author Details
List of Tables
Table 1. Global Orphan Drugs Market Size Growth Rate by Type (US$ Million): 2018 VS 2022 VS 2029
Table 2. Key Players of Oncology
Table 3. Key Players of Pulmonary
Table 4. Key Players of Neurology
Table 5. Key Players of Hematology
Table 6. Key Players of Endocrinology
Table 7. Key Players of Cardio-vascular
Table 8. Key Players of Metabolic Disorders
Table 9. Key Players of Others
Table 10. Global Orphan Drugs Market Size Growth by Application (US$ Million): 2018 VS 2022 VS 2029
Table 11. Global Orphan Drugs Market Size by Region (US$ Million): 2018 VS 2022 VS 2029
Table 12. Global Orphan Drugs Market Size by Region (2018-2023) & (US$ Million)
Table 13. Global Orphan Drugs Market Share by Region (2018-2023)
Table 14. Global Orphan Drugs Forecasted Market Size by Region (2024-2029) & (US$ Million)
Table 15. Global Orphan Drugs Market Share by Region (2024-2029)
Table 16. Orphan Drugs Market Trends
Table 17. Orphan Drugs Market Drivers
Table 18. Orphan Drugs Market Challenges
Table 19. Orphan Drugs Market Restraints
Table 20. Global Orphan Drugs Revenue by Players (2018-2023) & (US$ Million)
Table 21. Global Orphan Drugs Market Share by Players (2018-2023)
Table 22. Global Top Orphan Drugs Players by Company Type (Tier 1, Tier 2, and Tier 3) & (based on the Revenue in Orphan Drugs as of 2022)
Table 23. Ranking of Global Top Orphan Drugs Companies by Revenue (US$ Million) in 2022
Table 24. Global 5 Largest Players Market Share by Orphan Drugs Revenue (CR5 and HHI) & (2018-2023)
Table 25. Key Players Headquarters and Area Served
Table 26. Key Players Orphan Drugs Product Solution and Service
Table 27. Date of Enter into Orphan Drugs Market
Table 28. Mergers & Acquisitions, Expansion Plans
Table 29. Global Orphan Drugs Market Size by Type (2018-2023) & (US$ Million)
Table 30. Global Orphan Drugs Revenue Market Share by Type (2018-2023)
Table 31. Global Orphan Drugs Forecasted Market Size by Type (2024-2029) & (US$ Million)
Table 32. Global Orphan Drugs Revenue Market Share by Type (2024-2029)
Table 33. Global Orphan Drugs Market Size by Application (2018-2023) & (US$ Million)
Table 34. Global Orphan Drugs Revenue Market Share by Application (2018-2023)
Table 35. Global Orphan Drugs Forecasted Market Size by Application (2024-2029) & (US$ Million)
Table 36. Global Orphan Drugs Revenue Market Share by Application (2024-2029)
Table 37. North America Orphan Drugs Market Size Growth Rate by Country (US$ Million): 2018 VS 2022 VS 2029
Table 38. North America Orphan Drugs Market Size by Country (2018-2023) & (US$ Million)
Table 39. North America Orphan Drugs Market Size by Country (2024-2029) & (US$ Million)
Table 40. Europe Orphan Drugs Market Size Growth Rate by Country (US$ Million): 2018 VS 2022 VS 2029
Table 41. Europe Orphan Drugs Market Size by Country (2018-2023) & (US$ Million)
Table 42. Europe Orphan Drugs Market Size by Country (2024-2029) & (US$ Million)
Table 43. Asia-Pacific Orphan Drugs Market Size Growth Rate by Region (US$ Million): 2018 VS 2022 VS 2029
Table 44. Asia-Pacific Orphan Drugs Market Size by Region (2018-2023) & (US$ Million)
Table 45. Asia-Pacific Orphan Drugs Market Size by Region (2024-2029) & (US$ Million)
Table 46. Latin America Orphan Drugs Market Size Growth Rate by Country (US$ Million): 2018 VS 2022 VS 2029
Table 47. Latin America Orphan Drugs Market Size by Country (2018-2023) & (US$ Million)
Table 48. Latin America Orphan Drugs Market Size by Country (2024-2029) & (US$ Million)
Table 49. Middle East & Africa Orphan Drugs Market Size Growth Rate by Country (US$ Million): 2018 VS 2022 VS 2029
Table 50. Middle East & Africa Orphan Drugs Market Size by Country (2018-2023) & (US$ Million)
Table 51. Middle East & Africa Orphan Drugs Market Size by Country (2024-2029) & (US$ Million)
Table 52. Bristol-Myers Squibb Company Detail
Table 53. Bristol-Myers Squibb Business Overview
Table 54. Bristol-Myers Squibb Orphan Drugs Product
Table 55. Bristol-Myers Squibb Revenue in Orphan Drugs Business (2018-2023) & (US$ Million)
Table 56. Bristol-Myers Squibb Recent Development
Table 57. Roche Company Detail
Table 58. Roche Business Overview
Table 59. Roche Orphan Drugs Product
Table 60. Roche Revenue in Orphan Drugs Business (2018-2023) & (US$ Million)
Table 61. Roche Recent Development
Table 62. Novartis Company Detail
Table 63. Novartis Business Overview
Table 64. Novartis Orphan Drugs Product
Table 65. Novartis Revenue in Orphan Drugs Business (2018-2023) & (US$ Million)
Table 66. Novartis Recent Development
Table 67. Johnson & Johnson Company Detail
Table 68. Johnson & Johnson Business Overview
Table 69. Johnson & Johnson Orphan Drugs Product
Table 70. Johnson & Johnson Revenue in Orphan Drugs Business (2018-2023) & (US$ Million)
Table 71. Johnson & Johnson Recent Development
Table 72. Pfizer Company Detail
Table 73. Pfizer Business Overview
Table 74. Pfizer Orphan Drugs Product
Table 75. Pfizer Revenue in Orphan Drugs Business (2018-2023) & (US$ Million)
Table 76. Pfizer Recent Development
Table 77. Amgen Company Detail
Table 78. Amgen Business Overview
Table 79. Amgen Orphan Drugs Product
Table 80. Amgen Revenue in Orphan Drugs Business (2018-2023) & (US$ Million)
Table 81. Amgen Recent Development
Table 82. Sanofi Company Detail
Table 83. Sanofi Business Overview
Table 84. Sanofi Orphan Drugs Product
Table 85. Sanofi Revenue in Orphan Drugs Business (2018-2023) & (US$ Million)
Table 86. Sanofi Recent Development
Table 87. AstraZeneca Company Detail
Table 88. AstraZeneca Business Overview
Table 89. AstraZeneca Orphan Drugs Product
Table 90. AstraZeneca Revenue in Orphan Drugs Business (2018-2023) & (US$ Million)
Table 91. AstraZeneca Recent Development
Table 92. Takeda Company Detail
Table 93. Takeda Business Overview
Table 94. Takeda Orphan Drugs Product
Table 95. Takeda Revenue in Orphan Drugs Business (2018-2023) & (US$ Million)
Table 96. Takeda Recent Development
Table 97. Vertex Pharmaceuticals Company Detail
Table 98. Vertex Pharmaceuticals Business Overview
Table 99. Vertex Pharmaceuticals Orphan Drugs Product
Table 100. Vertex Pharmaceuticals Revenue in Orphan Drugs Business (2018-2023) & (US$ Million)
Table 101. Vertex Pharmaceuticals Recent Development
Table 102. AbbVie Company Detail
Table 103. AbbVie Business Overview
Table 104. AbbVie Orphan Drugs Product
Table 105. AbbVie Revenue in Orphan Drugs Business (2018-2023) & (US$ Million)
Table 106. AbbVie Recent Development
Table 107. Biogen Company Detail
Table 108. Biogen Business Overview
Table 109. Biogen Orphan Drugs Product
Table 110. Biogen Revenue in Orphan Drugs Business (2018-2023) & (US$ Million)
Table 111. Biogen Recent Development
Table 112. Eli Lilly Company Detail
Table 113. Eli Lilly Business Overview
Table 114. Eli Lilly Orphan Drugs Product
Table 115. Eli Lilly Revenue in Orphan Drugs Business (2018-2023) & (US$ Million)
Table 116. Eli Lilly Recent Development
Table 117. Research Programs/Design for This Report
Table 118. Key Data Information from Secondary Sources
Table 119. Key Data Information from Primary Sources
List of Figures
Figure 1. Global Orphan Drugs Market Size Comparison by Type (2023-2029) & (US$ Million)
Figure 2. Global Orphan Drugs Market Share by Type: 2022 VS 2029
Figure 3. Oncology Features
Figure 4. Pulmonary Features
Figure 5. Neurology Features
Figure 6. Hematology Features
Figure 7. Endocrinology Features
Figure 8. Cardio-vascular Features
Figure 9. Metabolic Disorders Features
Figure 10. Others Features
Figure 11. Global Orphan Drugs Market Size Comparison by Application (2023-2029) & (US$ Million)
Figure 12. Global Orphan Drugs Market Share by Application: 2022 VS 2029
Figure 13. Baby and Child Case Studies
Figure 14. Teenager Case Studies
Figure 15. Adult Case Studies
Figure 16. Other Case Studies
Figure 17. Orphan Drugs Report Years Considered
Figure 18. Global Orphan Drugs Market Size (US$ Million), Year-over-Year: 2018-2029
Figure 19. Global Orphan Drugs Market Size, (US$ Million), 2018 VS 2022 VS 2029
Figure 20. Global Orphan Drugs Market Share by Region: 2022 VS 2029
Figure 21. Global Orphan Drugs Market Share by Players in 2022
Figure 22. Global Top Orphan Drugs Players by Company Type (Tier 1, Tier 2, and Tier 3) & (based on the Revenue in Orphan Drugs as of 2022)
Figure 23. The Top 10 and 5 Players Market Share by Orphan Drugs Revenue in 2022
Figure 24. North America Orphan Drugs Market Size YoY Growth (2018-2029) & (US$ Million)
Figure 25. North America Orphan Drugs Market Share by Country (2018-2029)
Figure 26. United States Orphan Drugs Market Size YoY Growth (2018-2029) & (US$ Million)
Figure 27. Canada Orphan Drugs Market Size YoY Growth (2018-2029) & (US$ Million)
Figure 28. Europe Orphan Drugs Market Size YoY Growth (2018-2029) & (US$ Million)
Figure 29. Europe Orphan Drugs Market Share by Country (2018-2029)
Figure 30. Germany Orphan Drugs Market Size YoY Growth (2018-2029) & (US$ Million)
Figure 31. France Orphan Drugs Market Size YoY Growth (2018-2029) & (US$ Million)
Figure 32. U.K. Orphan Drugs Market Size YoY Growth (2018-2029) & (US$ Million)
Figure 33. Italy Orphan Drugs Market Size YoY Growth (2018-2029) & (US$ Million)
Figure 34. Russia Orphan Drugs Market Size YoY Growth (2018-2029) & (US$ Million)
Figure 35. Nordic Countries Orphan Drugs Market Size YoY Growth (2018-2029) & (US$ Million)
Figure 36. Asia-Pacific Orphan Drugs Market Size YoY Growth (2018-2029) & (US$ Million)
Figure 37. Asia-Pacific Orphan Drugs Market Share by Region (2018-2029)
Figure 38. China Orphan Drugs Market Size YoY Growth (2018-2029) & (US$ Million)
Figure 39. Japan Orphan Drugs Market Size YoY Growth (2018-2029) & (US$ Million)
Figure 40. South Korea Orphan Drugs Market Size YoY Growth (2018-2029) & (US$ Million)
Figure 41. Southeast Asia Orphan Drugs Market Size YoY Growth (2018-2029) & (US$ Million)
Figure 42. India Orphan Drugs Market Size YoY Growth (2018-2029) & (US$ Million)
Figure 43. Australia Orphan Drugs Market Size YoY Growth (2018-2029) & (US$ Million)
Figure 44. Latin America Orphan Drugs Market Size YoY Growth (2018-2029) & (US$ Million)
Figure 45. Latin America Orphan Drugs Market Share by Country (2018-2029)
Figure 46. Mexico Orphan Drugs Market Size YoY Growth (2018-2029) & (US$ Million)
Figure 47. Brazil Orphan Drugs Market Size YoY Growth (2018-2029) & (US$ Million)
Figure 48. Middle East & Africa Orphan Drugs Market Size YoY Growth (2018-2029) & (US$ Million)
Figure 49. Middle East & Africa Orphan Drugs Market Share by Country (2018-2029)
Figure 50. Turkey Orphan Drugs Market Size YoY Growth (2018-2029) & (US$ Million)
Figure 51. Saudi Arabia Orphan Drugs Market Size YoY Growth (2018-2029) & (US$ Million)
Figure 52. Bristol-Myers Squibb Revenue Growth Rate in Orphan Drugs Business (2018-2023)
Figure 53. Roche Revenue Growth Rate in Orphan Drugs Business (2018-2023)
Figure 54. Novartis Revenue Growth Rate in Orphan Drugs Business (2018-2023)
Figure 55. Johnson & Johnson Revenue Growth Rate in Orphan Drugs Business (2018-2023)
Figure 56. Pfizer Revenue Growth Rate in Orphan Drugs Business (2018-2023)
Figure 57. Amgen Revenue Growth Rate in Orphan Drugs Business (2018-2023)
Figure 58. Sanofi Revenue Growth Rate in Orphan Drugs Business (2018-2023)
Figure 59. AstraZeneca Revenue Growth Rate in Orphan Drugs Business (2018-2023)
Figure 60. Takeda Revenue Growth Rate in Orphan Drugs Business (2018-2023)
Figure 61. Vertex Pharmaceuticals Revenue Growth Rate in Orphan Drugs Business (2018-2023)
Figure 62. AbbVie Revenue Growth Rate in Orphan Drugs Business (2018-2023)
Figure 63. Biogen Revenue Growth Rate in Orphan Drugs Business (2018-2023)
Figure 64. Eli Lilly Revenue Growth Rate in Orphan Drugs Business (2018-2023)
Figure 65. Bottom-up and Top-down Approaches for This Report
Figure 66. Data Triangulation
Figure 67. Key Executives Interviewed
$2900
$4350
$5800
HAVE A QUERY?
OUR CUSTOMER

SIMILAR REPORTS