
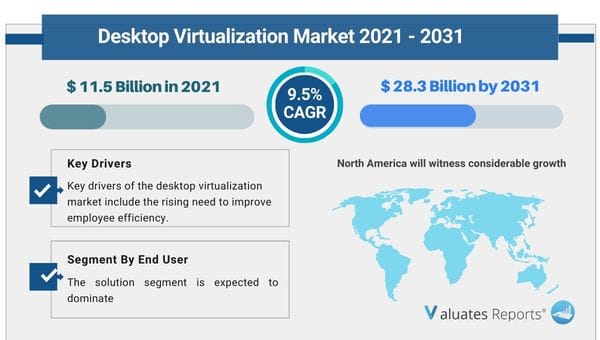
The global desktop virtualization market size was valued at $11.5 billion in 2021 and is projected to reach $28.3 billion by 2031, growing at a CAGR of 9.5% from 2022 to 2031. Key drivers of the desktop virtualization market include the rising need to improve employee efficiency.
The demand for extensive data security will push the growth of the desktop virtualization market during the forecast period.
The growing trend of workspace as a service model will fuel the growth of the market in the forthcoming years.
Need for employee efficiency
The sudden increase in remote working models of several companies has led to the need for employees to have seamless access to operations data round the clock. Organizations have to enable the same computing experience to anyone anytime in the world. A virtual network infrastructure generates, administers, and provides a network to each of its users which decreases the overall computing load and improves employee efficiency. This will drive the growth of the desktop virtualization market in the forthcoming years. VDI from a central server allows simple maintenance and quick rollouts. The support needed is minimum for updating security, software, policies, and operating systems. Thousands of laptops and computers can be set up in less time and the IT staff do not need to physically examine any maintenance issue. Employees get to securely access the VDI corporate data and play an important role in the enterprise’s BYOD program. One doesn't need to spend hours configuring the desktops for a new hire as they can be cloned from a server. The downtime is reduced drastically and no productivity is hampered. The IT infrastructure can be scaled up seamlessly with new equipment. This ensures the continuity of operations for big companies. Workers can start working at home or pick up the remaining work from anywhere in the world.
Importance of data security
Cyber threats are gaining ground with each passing day. Data breaches have become critical with attacks ranging from infection of malware, phishing, tampering with intellectual property, and targeted hacking. Desktop virtualization provides containerization of multiple applications run on several isolated spaces thereby blocking their view which in turn enhances protection. Server resources are masked effectively with smaller virtual chunks run by each admin. All these servers are rebooted independently thereby creating a layer of abstraction between the virtualized hardware and operating system. Compromised software is isolated completely. These will drive the demand for the desktop virtualization market in the subsequent years. The chances of unauthorized access or the introduction of malware are less as all the necessary permissions, configurations, and protections are adopted and updated in real-time. The data is saved on the server and not the disk reducing the chances of any critical breach.
Workspace as a service model
Flexible working hours have given rise to the growing workspace as a service model. It provides a high level of freedom to workers utilizing digital workspaces. It creates increased productivity, and peace of mind as everything is backed up on the cloud. It is a perfect solution for small enterprises as they are able to adopt the solution without getting into unwanted costs. Once users log into the digital workspace they have access to everything like apps, desktops, data, etc. This will push the growth of the desktop virtualization market in the forthcoming years. The flexibility to work from anywhere improves the overall productivity and motivation levels of employees whereas employers do on lose out on workers on any given day. An advanced WAAS solution provides an uptime guarantee and protection against data theft. The data is backed up at regular intervals for eliminating the chances of loss.
Performance, compatibility issues, and high cost
There is a recurring issue that is faced by companies adopting desktop virtualization. The initial cost is high as there are expenses related to servers, licenses, and storage infrastructure. The network needs to have the capacity to handle all the extra bandwidth due to the presence of a huge number of VDI users. This will hamper the growth prospects of the desktop virtualization market in the coming years. The licenses are different for different operating systems and the support for HD video is very low. Moreover, VDO works only with its corresponding server virtualization counterparts which creates further compatibility issues.
Based on the offering, the solution segment is expected to dominate the desktop virtualization market share during the forecast period.
Based on type, the desktop as a service segment will be the most lucrative due to the emerging popularity of cloud computing.
Based on the industry vertical, the IT and telecom segment is expected to dominate in the desktop virtualization market share due to the growing use of VDI solutions owing to the shift toward remote working models since the onset of the pandemic. While the healthcare segment will grow the fastest due to the rising need for virtualized solutions for better care management and data security.
Based on enterprise size, the large enterprise's segment will grow the highest due to the rapid adoption of data virtualization solutions after the covid 19 pandemic. However, the SMBs segment will grow the fastest as they are shifting toward VDI solutions for enhanced data security at low cost.
Based on region, North America will witness considerable growth due to rising investments in cloud and digital data security solutions. While the Asia-Pacific will be the fastest growing due to the rapid digitization of enterprises and continuous upgradation of IT infrastructure.
Desktop Virtualization Market Scope
|
Report Metric |
Details |
|
Report Name |
Desktop Virtualization Market |
|
The Market size value in 2021 |
11.5 Billion USD |
|
The Revenue forecast in 2031 |
28.3 Billion USD |
|
Growth Rate |
CAGR of 9.5% from 2021 to 2031 |
|
Base year considered |
2021 |
|
Forecast period |
2021- 2031 |
|
Forecast units |
Value (USD) |
|
Segments covered |
By Application, By Age Group, By Size, By End User, By Distribution Channel, By Product Type |
|
Report coverage |
Revenue & volume forecast, company share, competitive landscape, growth factors, and trends |
|
Geographic regions covered |
North America, Europe, Asia Pacific, Latin America, Middle East & Africa |
|
Companies covered |
Kampa, exxel outdoors, Bushtec Safari, Sawday’s Canopy and Stars Ltd., Huttopia, Wigwam Holidays Ltd, ArenaCampsites, Others. |
Ans. The global desktop virtualization market size was valued at $11.5 billion in 2021 and is projected to reach $28.3 billion by 2031.
Ans. The global desktop virtualization market is expected to grow at a compound annual growth rate of 9.5% from 2021 to 2031.
Ans. The key players are Ivanti, Kyndryl Inc. , Microsoft Corporation , Nasstar , NetApp , NTT DATA Corporation , Nutanix , Oracle Corporation , Pure storage, Inc. , Softchoice , VMware Inc.
CHAPTER 1:INTRODUCTION
1.1.Report description
1.2.Key market segments
1.3.Key benefits to the stakeholders
1.4.Research Methodology
1.4.1.Secondary research
1.4.2.Primary research
1.4.3.Analyst tools and models
CHAPTER 2:EXECUTIVE SUMMARY
2.1.Key findings of the study
2.2.CXO Perspective
CHAPTER 3:MARKET OVERVIEW
3.1.Market definition and scope
3.2.Key findings
3.2.1.Top investment pockets
3.3.Porter’s five forces analysis
3.4.Top player positioning
3.5.Market dynamics
3.5.1.Drivers
3.5.2.Restraints
3.5.3.Opportunities
3.6.COVID-19 Impact Analysis on the market
CHAPTER 4: DESKTOP VIRTUALIZATION MARKET, BY OFFERING
4.1 Overview
4.1.1 Market size and forecast
4.2 Solution
4.2.1 Key market trends, growth factors and opportunities
4.2.2 Market size and forecast, by region
4.2.3 Market analysis by country
4.3 Service
4.3.1 Key market trends, growth factors and opportunities
4.3.2 Market size and forecast, by region
4.3.3 Market analysis by country
CHAPTER 5: DESKTOP VIRTUALIZATION MARKET, BY TYPE
5.1 Overview
5.1.1 Market size and forecast
5.2 Virtual desktop infrastructure (VDI)
5.2.1 Key market trends, growth factors and opportunities
5.2.2 Market size and forecast, by region
5.2.3 Market analysis by country
5.3 Desktop-as-a-service (DaaS)
5.3.1 Key market trends, growth factors and opportunities
5.3.2 Market size and forecast, by region
5.3.3 Market analysis by country
5.4 Remote Desktop Services (RDS)
5.4.1 Key market trends, growth factors and opportunities
5.4.2 Market size and forecast, by region
5.4.3 Market analysis by country
CHAPTER 6: DESKTOP VIRTUALIZATION MARKET, BY ENTERPRISE SIZE
6.1 Overview
6.1.1 Market size and forecast
6.2 Large Enterprises
6.2.1 Key market trends, growth factors and opportunities
6.2.2 Market size and forecast, by region
6.2.3 Market analysis by country
6.3 SMBs
6.3.1 Key market trends, growth factors and opportunities
6.3.2 Market size and forecast, by region
6.3.3 Market analysis by country
CHAPTER 7: DESKTOP VIRTUALIZATION MARKET, BY INDUSTRY VERTICAL
7.1 Overview
7.1.1 Market size and forecast
7.2 IT & Telecom
7.2.1 Key market trends, growth factors and opportunities
7.2.2 Market size and forecast, by region
7.2.3 Market analysis by country
7.3 Construction & Manufacturing
7.3.1 Key market trends, growth factors and opportunities
7.3.2 Market size and forecast, by region
7.3.3 Market analysis by country
7.4 BFSI
7.4.1 Key market trends, growth factors and opportunities
7.4.2 Market size and forecast, by region
7.4.3 Market analysis by country
7.5 Healthcare
7.5.1 Key market trends, growth factors and opportunities
7.5.2 Market size and forecast, by region
7.5.3 Market analysis by country
7.6 Public Sector
7.6.1 Key market trends, growth factors and opportunities
7.6.2 Market size and forecast, by region
7.6.3 Market analysis by country
7.7 Retail
7.7.1 Key market trends, growth factors and opportunities
7.7.2 Market size and forecast, by region
7.7.3 Market analysis by country
7.8 Education
7.8.1 Key market trends, growth factors and opportunities
7.8.2 Market size and forecast, by region
7.8.3 Market analysis by country
7.8.4 Education Desktop Virtualization Market by Education
7.8.4.1 Academic Institutions Market size and forecast, by region
7.8.4.2 Academic Institutions Market size and forecast, by country
7.8.4.3 Enterprises Market size and forecast, by region
7.8.4.4 Enterprises Market size and forecast, by country
7.9 Others
7.9.1 Key market trends, growth factors and opportunities
7.9.2 Market size and forecast, by region
7.9.3 Market analysis by country
CHAPTER 8: DESKTOP VIRTUALIZATION MARKET, BY REGION
8.1 Overview
8.1.1 Market size and forecast
8.2 North America
8.2.1 Key trends and opportunities
8.2.2 North America Market size and forecast, by Offering
8.2.3 North America Market size and forecast, by Type
8.2.4 North America Market size and forecast, by Enterprise Size
8.2.5 North America Market size and forecast, by Industry Vertical
8.2.5.1 North America Education Desktop Virtualization Market by Education
8.2.6 North America Market size and forecast, by country
8.2.6.1 U.S.
8.2.6.1.1 Market size and forecast, by Offering
8.2.6.1.2 Market size and forecast, by Type
8.2.6.1.3 Market size and forecast, by Enterprise Size
8.2.6.1.4 Market size and forecast, by Industry Vertical
8.2.6.1.4.1 U.S. Education Desktop Virtualization Market by Education
8.2.6.2 Canada
8.2.6.2.1 Market size and forecast, by Offering
8.2.6.2.2 Market size and forecast, by Type
8.2.6.2.3 Market size and forecast, by Enterprise Size
8.2.6.2.4 Market size and forecast, by Industry Vertical
8.2.6.2.4.1 Canada Education Desktop Virtualization Market by Education
8.3 Europe
8.3.1 Key trends and opportunities
8.3.2 Europe Market size and forecast, by Offering
8.3.3 Europe Market size and forecast, by Type
8.3.4 Europe Market size and forecast, by Enterprise Size
8.3.5 Europe Market size and forecast, by Industry Vertical
8.3.5.1 Europe Education Desktop Virtualization Market by Education
8.3.6 Europe Market size and forecast, by country
8.3.6.1 United Kingdom
8.3.6.1.1 Market size and forecast, by Offering
8.3.6.1.2 Market size and forecast, by Type
8.3.6.1.3 Market size and forecast, by Enterprise Size
8.3.6.1.4 Market size and forecast, by Industry Vertical
8.3.6.1.4.1 United Kingdom Education Desktop Virtualization Market by Education
8.3.6.2 Germany
8.3.6.2.1 Market size and forecast, by Offering
8.3.6.2.2 Market size and forecast, by Type
8.3.6.2.3 Market size and forecast, by Enterprise Size
8.3.6.2.4 Market size and forecast, by Industry Vertical
8.3.6.2.4.1 Germany Education Desktop Virtualization Market by Education
8.3.6.3 France
8.3.6.3.1 Market size and forecast, by Offering
8.3.6.3.2 Market size and forecast, by Type
8.3.6.3.3 Market size and forecast, by Enterprise Size
8.3.6.3.4 Market size and forecast, by Industry Vertical
8.3.6.3.4.1 France Education Desktop Virtualization Market by Education
8.3.6.4 Italy
8.3.6.4.1 Market size and forecast, by Offering
8.3.6.4.2 Market size and forecast, by Type
8.3.6.4.3 Market size and forecast, by Enterprise Size
8.3.6.4.4 Market size and forecast, by Industry Vertical
8.3.6.4.4.1 Italy Education Desktop Virtualization Market by Education
8.3.6.5 Spain
8.3.6.5.1 Market size and forecast, by Offering
8.3.6.5.2 Market size and forecast, by Type
8.3.6.5.3 Market size and forecast, by Enterprise Size
8.3.6.5.4 Market size and forecast, by Industry Vertical
8.3.6.5.4.1 Spain Education Desktop Virtualization Market by Education
8.3.6.6 Netherlands
8.3.6.6.1 Market size and forecast, by Offering
8.3.6.6.2 Market size and forecast, by Type
8.3.6.6.3 Market size and forecast, by Enterprise Size
8.3.6.6.4 Market size and forecast, by Industry Vertical
8.3.6.6.4.1 Netherlands Education Desktop Virtualization Market by Education
8.3.6.7 Rest of Europe
8.3.6.7.1 Market size and forecast, by Offering
8.3.6.7.2 Market size and forecast, by Type
8.3.6.7.3 Market size and forecast, by Enterprise Size
8.3.6.7.4 Market size and forecast, by Industry Vertical
8.3.6.7.4.1 Rest of Europe Education Desktop Virtualization Market by Education
8.4 Asia-Pacific
8.4.1 Key trends and opportunities
8.4.2 Asia-Pacific Market size and forecast, by Offering
8.4.3 Asia-Pacific Market size and forecast, by Type
8.4.4 Asia-Pacific Market size and forecast, by Enterprise Size
8.4.5 Asia-Pacific Market size and forecast, by Industry Vertical
8.4.5.1 Asia-Pacific Education Desktop Virtualization Market by Education
8.4.6 Asia-Pacific Market size and forecast, by country
8.4.6.1 China
8.4.6.1.1 Market size and forecast, by Offering
8.4.6.1.2 Market size and forecast, by Type
8.4.6.1.3 Market size and forecast, by Enterprise Size
8.4.6.1.4 Market size and forecast, by Industry Vertical
8.4.6.1.4.1 China Education Desktop Virtualization Market by Education
8.4.6.2 Japan
8.4.6.2.1 Market size and forecast, by Offering
8.4.6.2.2 Market size and forecast, by Type
8.4.6.2.3 Market size and forecast, by Enterprise Size
8.4.6.2.4 Market size and forecast, by Industry Vertical
8.4.6.2.4.1 Japan Education Desktop Virtualization Market by Education
8.4.6.3 South Korea
8.4.6.3.1 Market size and forecast, by Offering
8.4.6.3.2 Market size and forecast, by Type
8.4.6.3.3 Market size and forecast, by Enterprise Size
8.4.6.3.4 Market size and forecast, by Industry Vertical
8.4.6.3.4.1 South Korea Education Desktop Virtualization Market by Education
8.4.6.4 India
8.4.6.4.1 Market size and forecast, by Offering
8.4.6.4.2 Market size and forecast, by Type
8.4.6.4.3 Market size and forecast, by Enterprise Size
8.4.6.4.4 Market size and forecast, by Industry Vertical
8.4.6.4.4.1 India Education Desktop Virtualization Market by Education
8.4.6.5 Australia
8.4.6.5.1 Market size and forecast, by Offering
8.4.6.5.2 Market size and forecast, by Type
8.4.6.5.3 Market size and forecast, by Enterprise Size
8.4.6.5.4 Market size and forecast, by Industry Vertical
8.4.6.5.4.1 Australia Education Desktop Virtualization Market by Education
8.4.6.6 Rest of Asia-Pacific
8.4.6.6.1 Market size and forecast, by Offering
8.4.6.6.2 Market size and forecast, by Type
8.4.6.6.3 Market size and forecast, by Enterprise Size
8.4.6.6.4 Market size and forecast, by Industry Vertical
8.4.6.6.4.1 Rest of Asia-Pacific Education Desktop Virtualization Market by Education
8.5 LAMEA
8.5.1 Key trends and opportunities
8.5.2 LAMEA Market size and forecast, by Offering
8.5.3 LAMEA Market size and forecast, by Type
8.5.4 LAMEA Market size and forecast, by Enterprise Size
8.5.5 LAMEA Market size and forecast, by Industry Vertical
8.5.5.1 LAMEA Education Desktop Virtualization Market by Education
8.5.6 LAMEA Market size and forecast, by country
8.5.6.1 Latin America
8.5.6.1.1 Market size and forecast, by Offering
8.5.6.1.2 Market size and forecast, by Type
8.5.6.1.3 Market size and forecast, by Enterprise Size
8.5.6.1.4 Market size and forecast, by Industry Vertical
8.5.6.1.4.1 Latin America Education Desktop Virtualization Market by Education
8.5.6.2 Middle East
8.5.6.2.1 Market size and forecast, by Offering
8.5.6.2.2 Market size and forecast, by Type
8.5.6.2.3 Market size and forecast, by Enterprise Size
8.5.6.2.4 Market size and forecast, by Industry Vertical
8.5.6.2.4.1 Middle East Education Desktop Virtualization Market by Education
8.5.6.3 Africa
8.5.6.3.1 Market size and forecast, by Offering
8.5.6.3.2 Market size and forecast, by Type
8.5.6.3.3 Market size and forecast, by Enterprise Size
8.5.6.3.4 Market size and forecast, by Industry Vertical
8.5.6.3.4.1 Africa Education Desktop Virtualization Market by Education
CHAPTER 9: COMPANY LANDSCAPE
9.1. Introduction
9.2. Top winning strategies
9.3. Product Mapping of Top 10 Player
9.4. Competitive Dashboard
9.5. Competitive Heatmap
9.6. Key developments
CHAPTER 10: COMPANY PROFILES
10.1 VMWare
10.1.1 Company overview
10.1.2 Company snapshot
10.1.3 Operating business segments
10.1.4 Product portfolio
10.1.5 Business performance
10.1.6 Key strategic moves and developments
LIST OF TABLES
TABLE 1. GLOBAL DESKTOP VIRTUALIZATION MARKET, BY OFFERING, 2021-2031 ($MILLION)
TABLE 2. DESKTOP VIRTUALIZATION MARKET SIZE, FOR SOLUTION, BY REGION, 2021-2031 ($MILLION)
TABLE 3. DESKTOP VIRTUALIZATION MARKET FOR SOLUTION, BY COUNTRY, 2021-2031 ($MILLION)
TABLE 4. DESKTOP VIRTUALIZATION MARKET SIZE, FOR SERVICE, BY REGION, 2021-2031 ($MILLION)
TABLE 5. DESKTOP VIRTUALIZATION MARKET FOR SERVICE, BY COUNTRY, 2021-2031 ($MILLION)
TABLE 6. GLOBAL DESKTOP VIRTUALIZATION MARKET, BY TYPE, 2021-2031 ($MILLION)
TABLE 7. DESKTOP VIRTUALIZATION MARKET SIZE, FOR VIRTUAL DESKTOP INFRASTRUCTURE (VDI), BY REGION, 2021-2031 ($MILLION)
TABLE 8. DESKTOP VIRTUALIZATION MARKET FOR VIRTUAL DESKTOP INFRASTRUCTURE (VDI), BY COUNTRY, 2021-2031 ($MILLION)
TABLE 9. DESKTOP VIRTUALIZATION MARKET SIZE, FOR DESKTOP-AS-A-SERVICE (DAAS), BY REGION, 2021-2031 ($MILLION)
TABLE 10. DESKTOP VIRTUALIZATION MARKET FOR DESKTOP-AS-A-SERVICE (DAAS), BY COUNTRY, 2021-2031 ($MILLION)
TABLE 11. DESKTOP VIRTUALIZATION MARKET SIZE, FOR REMOTE DESKTOP SERVICES (RDS), BY REGION, 2021-2031 ($MILLION)
TABLE 12. DESKTOP VIRTUALIZATION MARKET FOR REMOTE DESKTOP SERVICES (RDS), BY COUNTRY, 2021-2031 ($MILLION)
TABLE 13. GLOBAL DESKTOP VIRTUALIZATION MARKET, BY ENTERPRISE SIZE, 2021-2031 ($MILLION)
TABLE 14. DESKTOP VIRTUALIZATION MARKET SIZE, FOR LARGE ENTERPRISES, BY REGION, 2021-2031 ($MILLION)
TABLE 15. DESKTOP VIRTUALIZATION MARKET FOR LARGE ENTERPRISES, BY COUNTRY, 2021-2031 ($MILLION)
TABLE 16. DESKTOP VIRTUALIZATION MARKET SIZE, FOR SMBS, BY REGION, 2021-2031 ($MILLION)
TABLE 17. DESKTOP VIRTUALIZATION MARKET FOR SMBS, BY COUNTRY, 2021-2031 ($MILLION)
TABLE 18. GLOBAL DESKTOP VIRTUALIZATION MARKET, BY INDUSTRY VERTICAL, 2021-2031 ($MILLION)
TABLE 19. DESKTOP VIRTUALIZATION MARKET SIZE, FOR IT & TELECOM, BY REGION, 2021-2031 ($MILLION)
TABLE 20. DESKTOP VIRTUALIZATION MARKET FOR IT & TELECOM, BY COUNTRY, 2021-2031 ($MILLION)
TABLE 21. DESKTOP VIRTUALIZATION MARKET SIZE, FOR CONSTRUCTION & MANUFACTURING, BY REGION, 2021-2031 ($MILLION)
TABLE 22. DESKTOP VIRTUALIZATION MARKET FOR CONSTRUCTION & MANUFACTURING, BY COUNTRY, 2021-2031 ($MILLION)
TABLE 23. DESKTOP VIRTUALIZATION MARKET SIZE, FOR BFSI, BY REGION, 2021-2031 ($MILLION)
TABLE 24. DESKTOP VIRTUALIZATION MARKET FOR BFSI, BY COUNTRY, 2021-2031 ($MILLION)
TABLE 25. DESKTOP VIRTUALIZATION MARKET SIZE, FOR HEALTHCARE, BY REGION, 2021-2031 ($MILLION)
TABLE 26. DESKTOP VIRTUALIZATION MARKET FOR HEALTHCARE, BY COUNTRY, 2021-2031 ($MILLION)
TABLE 27. DESKTOP VIRTUALIZATION MARKET SIZE, FOR PUBLIC SECTOR, BY REGION, 2021-2031 ($MILLION)
TABLE 28. DESKTOP VIRTUALIZATION MARKET FOR PUBLIC SECTOR, BY COUNTRY, 2021-2031 ($MILLION)
TABLE 29. DESKTOP VIRTUALIZATION MARKET SIZE, FOR RETAIL, BY REGION, 2021-2031 ($MILLION)
TABLE 30. DESKTOP VIRTUALIZATION MARKET FOR RETAIL, BY COUNTRY, 2021-2031 ($MILLION)
TABLE 31. DESKTOP VIRTUALIZATION MARKET SIZE, FOR EDUCATION, BY REGION, 2021-2031 ($MILLION)
TABLE 32. DESKTOP VIRTUALIZATION MARKET FOR EDUCATION, BY COUNTRY, 2021-2031 ($MILLION)
TABLE 33. GLOBAL EDUCATION DESKTOP VIRTUALIZATION MARKET, BY EDUCATION, 2021-2031 ($MILLION)
TABLE 34. DESKTOP VIRTUALIZATION MARKET, FOR ACADEMIC INSTITUTIONS, BY REGION, 2021-2031 ($MILLION)
TABLE 35. DESKTOP VIRTUALIZATION MARKET, FOR ACADEMIC INSTITUTIONS, BY COUNTRY, 2021-2031 ($MILLION)
TABLE 36. DESKTOP VIRTUALIZATION MARKET, FOR ENTERPRISES, BY REGION, 2021-2031 ($MILLION)
TABLE 37. DESKTOP VIRTUALIZATION MARKET, FOR ENTERPRISES, BY COUNTRY, 2021-2031 ($MILLION)
TABLE 38. DESKTOP VIRTUALIZATION MARKET SIZE, FOR OTHERS, BY REGION, 2021-2031 ($MILLION)
TABLE 39. DESKTOP VIRTUALIZATION MARKET FOR OTHERS, BY COUNTRY, 2021-2031 ($MILLION)
TABLE 40. DESKTOP VIRTUALIZATION MARKET, BY REGION, 2021-2031 ($MILLION)
TABLE 41. NORTH AMERICA DESKTOP VIRTUALIZATION MARKET, BY OFFERING, 2021-2031 ($MILLION)
TABLE 42. NORTH AMERICA DESKTOP VIRTUALIZATION MARKET, BY TYPE, 2021-2031 ($MILLION)
TABLE 43. NORTH AMERICA DESKTOP VIRTUALIZATION MARKET, BY ENTERPRISE SIZE, 2021-2031 ($MILLION)
TABLE 44. NORTH AMERICA DESKTOP VIRTUALIZATION MARKET, BY INDUSTRY VERTICAL, 2021-2031 ($MILLION)
TABLE 45. NORTH AMERICA EDUCATION DESKTOP VIRTUALIZATION MARKET, BY EDUCATION, 2021-2031 ($MILLION)
TABLE 46. NORTH AMERICA DESKTOP VIRTUALIZATION MARKET, BY COUNTRY, 2021-2031 ($MILLION)
TABLE 47. U.S. DESKTOP VIRTUALIZATION MARKET, BY OFFERING, 2021-2031 ($MILLION)
TABLE 48. U.S. DESKTOP VIRTUALIZATION MARKET, BY TYPE, 2021-2031 ($MILLION)
TABLE 49. U.S. DESKTOP VIRTUALIZATION MARKET, BY ENTERPRISE SIZE, 2021-2031 ($MILLION)
TABLE 50. U.S. DESKTOP VIRTUALIZATION MARKET, BY INDUSTRY VERTICAL, 2021-2031 ($MILLION)
TABLE 51. U.S. EDUCATION DESKTOP VIRTUALIZATION MARKET, BY EDUCATION, 2021-2031 ($MILLION)
TABLE 52. CANADA DESKTOP VIRTUALIZATION MARKET, BY OFFERING, 2021-2031 ($MILLION)
TABLE 53. CANADA DESKTOP VIRTUALIZATION MARKET, BY TYPE, 2021-2031 ($MILLION)
TABLE 54. CANADA DESKTOP VIRTUALIZATION MARKET, BY ENTERPRISE SIZE, 2021-2031 ($MILLION)
TABLE 55. CANADA DESKTOP VIRTUALIZATION MARKET, BY INDUSTRY VERTICAL, 2021-2031 ($MILLION)
TABLE 56. CANADA EDUCATION DESKTOP VIRTUALIZATION MARKET, BY EDUCATION, 2021-2031 ($MILLION)
TABLE 57. EUROPE DESKTOP VIRTUALIZATION MARKET, BY OFFERING, 2021-2031 ($MILLION)
TABLE 58. EUROPE DESKTOP VIRTUALIZATION MARKET, BY TYPE, 2021-2031 ($MILLION)
TABLE 59. EUROPE DESKTOP VIRTUALIZATION MARKET, BY ENTERPRISE SIZE, 2021-2031 ($MILLION)
TABLE 60. EUROPE DESKTOP VIRTUALIZATION MARKET, BY INDUSTRY VERTICAL, 2021-2031 ($MILLION)
TABLE 61. EUROPE EDUCATION DESKTOP VIRTUALIZATION MARKET, BY EDUCATION, 2021-2031 ($MILLION)
TABLE 62. EUROPE DESKTOP VIRTUALIZATION MARKET, BY COUNTRY, 2021-2031 ($MILLION)
TABLE 63. UNITED KINGDOM DESKTOP VIRTUALIZATION MARKET, BY OFFERING, 2021-2031 ($MILLION)
TABLE 64. UNITED KINGDOM DESKTOP VIRTUALIZATION MARKET, BY TYPE, 2021-2031 ($MILLION)
TABLE 65. UNITED KINGDOM DESKTOP VIRTUALIZATION MARKET, BY ENTERPRISE SIZE, 2021-2031 ($MILLION)
TABLE 66. UNITED KINGDOM DESKTOP VIRTUALIZATION MARKET, BY INDUSTRY VERTICAL, 2021-2031 ($MILLION)
TABLE 67. UNITED KINGDOM EDUCATION DESKTOP VIRTUALIZATION MARKET, BY EDUCATION, 2021-2031 ($MILLION)
TABLE 68. GERMANY DESKTOP VIRTUALIZATION MARKET, BY OFFERING, 2021-2031 ($MILLION)
TABLE 69. GERMANY DESKTOP VIRTUALIZATION MARKET, BY TYPE, 2021-2031 ($MILLION)
TABLE 70. GERMANY DESKTOP VIRTUALIZATION MARKET, BY ENTERPRISE SIZE, 2021-2031 ($MILLION)
TABLE 71. GERMANY DESKTOP VIRTUALIZATION MARKET, BY INDUSTRY VERTICAL, 2021-2031 ($MILLION)
TABLE 72. GERMANY EDUCATION DESKTOP VIRTUALIZATION MARKET, BY EDUCATION, 2021-2031 ($MILLION)
TABLE 73. FRANCE DESKTOP VIRTUALIZATION MARKET, BY OFFERING, 2021-2031 ($MILLION)
TABLE 74. FRANCE DESKTOP VIRTUALIZATION MARKET, BY TYPE, 2021-2031 ($MILLION)
TABLE 75. FRANCE DESKTOP VIRTUALIZATION MARKET, BY ENTERPRISE SIZE, 2021-2031 ($MILLION)
TABLE 76. FRANCE DESKTOP VIRTUALIZATION MARKET, BY INDUSTRY VERTICAL, 2021-2031 ($MILLION)
TABLE 77. FRANCE EDUCATION DESKTOP VIRTUALIZATION MARKET, BY EDUCATION, 2021-2031 ($MILLION)
TABLE 78. ITALY DESKTOP VIRTUALIZATION MARKET, BY OFFERING, 2021-2031 ($MILLION)
TABLE 79. ITALY DESKTOP VIRTUALIZATION MARKET, BY TYPE, 2021-2031 ($MILLION)
TABLE 80. ITALY DESKTOP VIRTUALIZATION MARKET, BY ENTERPRISE SIZE, 2021-2031 ($MILLION)
TABLE 81. ITALY DESKTOP VIRTUALIZATION MARKET, BY INDUSTRY VERTICAL, 2021-2031 ($MILLION)
TABLE 82. ITALY EDUCATION DESKTOP VIRTUALIZATION MARKET, BY EDUCATION, 2021-2031 ($MILLION)
TABLE 83. SPAIN DESKTOP VIRTUALIZATION MARKET, BY OFFERING, 2021-2031 ($MILLION)
TABLE 84. SPAIN DESKTOP VIRTUALIZATION MARKET, BY TYPE, 2021-2031 ($MILLION)
TABLE 85. SPAIN DESKTOP VIRTUALIZATION MARKET, BY ENTERPRISE SIZE, 2021-2031 ($MILLION)
TABLE 86. SPAIN DESKTOP VIRTUALIZATION MARKET, BY INDUSTRY VERTICAL, 2021-2031 ($MILLION)
TABLE 87. SPAIN EDUCATION DESKTOP VIRTUALIZATION MARKET, BY EDUCATION, 2021-2031 ($MILLION)
TABLE 88. NETHERLANDS DESKTOP VIRTUALIZATION MARKET, BY OFFERING, 2021-2031 ($MILLION)
TABLE 89. NETHERLANDS DESKTOP VIRTUALIZATION MARKET, BY TYPE, 2021-2031 ($MILLION)
TABLE 90. NETHERLANDS DESKTOP VIRTUALIZATION MARKET, BY ENTERPRISE SIZE, 2021-2031 ($MILLION)
TABLE 91. NETHERLANDS DESKTOP VIRTUALIZATION MARKET, BY INDUSTRY VERTICAL, 2021-2031 ($MILLION)
TABLE 92. NETHERLANDS EDUCATION DESKTOP VIRTUALIZATION MARKET, BY EDUCATION, 2021-2031 ($MILLION)
TABLE 93. REST OF EUROPE DESKTOP VIRTUALIZATION MARKET, BY OFFERING, 2021-2031 ($MILLION)
TABLE 94. REST OF EUROPE DESKTOP VIRTUALIZATION MARKET, BY TYPE, 2021-2031 ($MILLION)
TABLE 95. REST OF EUROPE DESKTOP VIRTUALIZATION MARKET, BY ENTERPRISE SIZE, 2021-2031 ($MILLION)
TABLE 96. REST OF EUROPE DESKTOP VIRTUALIZATION MARKET, BY INDUSTRY VERTICAL, 2021-2031 ($MILLION)
TABLE 97. REST OF EUROPE EDUCATION DESKTOP VIRTUALIZATION MARKET, BY EDUCATION, 2021-2031 ($MILLION)
TABLE 98. ASIA-PACIFIC DESKTOP VIRTUALIZATION MARKET, BY OFFERING, 2021-2031 ($MILLION)
TABLE 99. ASIA-PACIFIC DESKTOP VIRTUALIZATION MARKET, BY TYPE, 2021-2031 ($MILLION)
TABLE 100. ASIA-PACIFIC DESKTOP VIRTUALIZATION MARKET, BY ENTERPRISE SIZE, 2021-2031 ($MILLION)
TABLE 101. ASIA-PACIFIC DESKTOP VIRTUALIZATION MARKET, BY INDUSTRY VERTICAL, 2021-2031 ($MILLION)
TABLE 102. ASIA-PACIFIC EDUCATION DESKTOP VIRTUALIZATION MARKET, BY EDUCATION, 2021-2031 ($MILLION)
TABLE 103. ASIA-PACIFIC DESKTOP VIRTUALIZATION MARKET, BY COUNTRY, 2021-2031 ($MILLION)
TABLE 104. CHINA DESKTOP VIRTUALIZATION MARKET, BY OFFERING, 2021-2031 ($MILLION)
TABLE 105. CHINA DESKTOP VIRTUALIZATION MARKET, BY TYPE, 2021-2031 ($MILLION)
TABLE 106. CHINA DESKTOP VIRTUALIZATION MARKET, BY ENTERPRISE SIZE, 2021-2031 ($MILLION)
TABLE 107. CHINA DESKTOP VIRTUALIZATION MARKET, BY INDUSTRY VERTICAL, 2021-2031 ($MILLION)
TABLE 108. CHINA EDUCATION DESKTOP VIRTUALIZATION MARKET, BY EDUCATION, 2021-2031 ($MILLION)
TABLE 109. JAPAN DESKTOP VIRTUALIZATION MARKET, BY OFFERING, 2021-2031 ($MILLION)
TABLE 110. JAPAN DESKTOP VIRTUALIZATION MARKET, BY TYPE, 2021-2031 ($MILLION)
TABLE 111. JAPAN DESKTOP VIRTUALIZATION MARKET, BY ENTERPRISE SIZE, 2021-2031 ($MILLION)
TABLE 112. JAPAN DESKTOP VIRTUALIZATION MARKET, BY INDUSTRY VERTICAL, 2021-2031 ($MILLION)
TABLE 113. JAPAN EDUCATION DESKTOP VIRTUALIZATION MARKET, BY EDUCATION, 2021-2031 ($MILLION)
TABLE 114. SOUTH KOREA DESKTOP VIRTUALIZATION MARKET, BY OFFERING, 2021-2031 ($MILLION)
TABLE 115. SOUTH KOREA DESKTOP VIRTUALIZATION MARKET, BY TYPE, 2021-2031 ($MILLION)
TABLE 116. SOUTH KOREA DESKTOP VIRTUALIZATION MARKET, BY ENTERPRISE SIZE, 2021-2031 ($MILLION)
TABLE 117. SOUTH KOREA DESKTOP VIRTUALIZATION MARKET, BY INDUSTRY VERTICAL, 2021-2031 ($MILLION)
TABLE 118. SOUTH KOREA EDUCATION DESKTOP VIRTUALIZATION MARKET, BY EDUCATION, 2021-2031 ($MILLION)
TABLE 119. INDIA DESKTOP VIRTUALIZATION MARKET, BY OFFERING, 2021-2031 ($MILLION)
TABLE 120. INDIA DESKTOP VIRTUALIZATION MARKET, BY TYPE, 2021-2031 ($MILLION)
TABLE 121. INDIA DESKTOP VIRTUALIZATION MARKET, BY ENTERPRISE SIZE, 2021-2031 ($MILLION)
TABLE 122. INDIA DESKTOP VIRTUALIZATION MARKET, BY INDUSTRY VERTICAL, 2021-2031 ($MILLION)
TABLE 123. INDIA EDUCATION DESKTOP VIRTUALIZATION MARKET, BY EDUCATION, 2021-2031 ($MILLION)
TABLE 124. AUSTRALIA DESKTOP VIRTUALIZATION MARKET, BY OFFERING, 2021-2031 ($MILLION)
TABLE 125. AUSTRALIA DESKTOP VIRTUALIZATION MARKET, BY TYPE, 2021-2031 ($MILLION)
TABLE 126. AUSTRALIA DESKTOP VIRTUALIZATION MARKET, BY ENTERPRISE SIZE, 2021-2031 ($MILLION)
TABLE 127. AUSTRALIA DESKTOP VIRTUALIZATION MARKET, BY INDUSTRY VERTICAL, 2021-2031 ($MILLION)
TABLE 128. AUSTRALIA EDUCATION DESKTOP VIRTUALIZATION MARKET, BY EDUCATION, 2021-2031 ($MILLION)
TABLE 129. REST OF ASIA-PACIFIC DESKTOP VIRTUALIZATION MARKET, BY OFFERING, 2021-2031 ($MILLION)
TABLE 130. REST OF ASIA-PACIFIC DESKTOP VIRTUALIZATION MARKET, BY TYPE, 2021-2031 ($MILLION)
TABLE 131. REST OF ASIA-PACIFIC DESKTOP VIRTUALIZATION MARKET, BY ENTERPRISE SIZE, 2021-2031 ($MILLION)
TABLE 132. REST OF ASIA-PACIFIC DESKTOP VIRTUALIZATION MARKET, BY INDUSTRY VERTICAL, 2021-2031 ($MILLION)
TABLE 133. REST OF ASIA-PACIFIC EDUCATION DESKTOP VIRTUALIZATION MARKET, BY EDUCATION, 2021-2031 ($MILLION)
TABLE 134. LAMEA DESKTOP VIRTUALIZATION MARKET, BY OFFERING, 2021-2031 ($MILLION)
TABLE 135. LAMEA DESKTOP VIRTUALIZATION MARKET, BY TYPE, 2021-2031 ($MILLION)
TABLE 136. LAMEA DESKTOP VIRTUALIZATION MARKET, BY ENTERPRISE SIZE, 2021-2031 ($MILLION)
TABLE 137. LAMEA DESKTOP VIRTUALIZATION MARKET, BY INDUSTRY VERTICAL, 2021-2031 ($MILLION)
TABLE 138. LAMEA EDUCATION DESKTOP VIRTUALIZATION MARKET, BY EDUCATION, 2021-2031 ($MILLION)
TABLE 139. LAMEA DESKTOP VIRTUALIZATION MARKET, BY COUNTRY, 2021-2031 ($MILLION)
TABLE 140. LATIN AMERICA DESKTOP VIRTUALIZATION MARKET, BY OFFERING, 2021-2031 ($MILLION)
TABLE 141. LATIN AMERICA DESKTOP VIRTUALIZATION MARKET, BY TYPE, 2021-2031 ($MILLION)
TABLE 142. LATIN AMERICA DESKTOP VIRTUALIZATION MARKET, BY ENTERPRISE SIZE, 2021-2031 ($MILLION)
TABLE 143. LATIN AMERICA DESKTOP VIRTUALIZATION MARKET, BY INDUSTRY VERTICAL, 2021-2031 ($MILLION)
TABLE 144. LATIN AMERICA EDUCATION DESKTOP VIRTUALIZATION MARKET, BY EDUCATION, 2021-2031 ($MILLION)
TABLE 145. MIDDLE EAST DESKTOP VIRTUALIZATION MARKET, BY OFFERING, 2021-2031 ($MILLION)
TABLE 146. MIDDLE EAST DESKTOP VIRTUALIZATION MARKET, BY TYPE, 2021-2031 ($MILLION)
TABLE 147. MIDDLE EAST DESKTOP VIRTUALIZATION MARKET, BY ENTERPRISE SIZE, 2021-2031 ($MILLION)
TABLE 148. MIDDLE EAST DESKTOP VIRTUALIZATION MARKET, BY INDUSTRY VERTICAL, 2021-2031 ($MILLION)
TABLE 149. MIDDLE EAST EDUCATION DESKTOP VIRTUALIZATION MARKET, BY EDUCATION, 2021-2031 ($MILLION)
TABLE 150. AFRICA DESKTOP VIRTUALIZATION MARKET, BY OFFERING, 2021-2031 ($MILLION)
TABLE 151. AFRICA DESKTOP VIRTUALIZATION MARKET, BY TYPE, 2021-2031 ($MILLION)
TABLE 152. AFRICA DESKTOP VIRTUALIZATION MARKET, BY ENTERPRISE SIZE, 2021-2031 ($MILLION)
TABLE 153. AFRICA DESKTOP VIRTUALIZATION MARKET, BY INDUSTRY VERTICAL, 2021-2031 ($MILLION)
TABLE 154. AFRICA EDUCATION DESKTOP VIRTUALIZATION MARKET, BY EDUCATION, 2021-2031 ($MILLION)
TABLE 155.VMWARE: COMPANY SNAPSHOT
TABLE 156.VMWARE: OPERATING SEGMENTS
TABLE 157.VMWARE: PRODUCT PORTFOLIO
TABLE 158.VMWARE: NET SALES,
TABLE 159.VMWARE: KEY STRATERGIES
LIST OF FIGURES
FIGURE 1.DESKTOP VIRTUALIZATION MARKET SEGMENTATION
FIGURE 2.DESKTOP VIRTUALIZATION MARKET,2021-2031
FIGURE 3.DESKTOP VIRTUALIZATION MARKET,2021-2031
FIGURE 4. TOP INVESTMENT POCKETS, BY REGION
FIGURE 5.PORTER FIVE-1
FIGURE 6.PORTER FIVE-2
FIGURE 7.PORTER FIVE-3
FIGURE 8.PORTER FIVE-4
FIGURE 9.PORTER FIVE-5
FIGURE 10.TOP PLAYER POSITIONING
FIGURE 11.DESKTOP VIRTUALIZATION MARKET:DRIVERS, RESTRAINTS AND OPPORTUNITIES
FIGURE 12.DESKTOP VIRTUALIZATION MARKET,BY OFFERING,2021(%)
FIGURE 13.COMPARATIVE SHARE ANALYSIS OF SOLUTION DESKTOP VIRTUALIZATION MARKET,2021-2031(%)
FIGURE 14.COMPARATIVE SHARE ANALYSIS OF SERVICE DESKTOP VIRTUALIZATION MARKET,2021-2031(%)
FIGURE 15.DESKTOP VIRTUALIZATION MARKET,BY TYPE,2021(%)
FIGURE 16.COMPARATIVE SHARE ANALYSIS OF VIRTUAL DESKTOP INFRASTRUCTURE (VDI) DESKTOP VIRTUALIZATION MARKET,2021-2031(%)
FIGURE 17.COMPARATIVE SHARE ANALYSIS OF DESKTOP-AS-A-SERVICE (DAAS) DESKTOP VIRTUALIZATION MARKET,2021-2031(%)
FIGURE 18.COMPARATIVE SHARE ANALYSIS OF REMOTE DESKTOP SERVICES (RDS) DESKTOP VIRTUALIZATION MARKET,2021-2031(%)
FIGURE 19.DESKTOP VIRTUALIZATION MARKET,BY ENTERPRISE SIZE,2021(%)
FIGURE 20.COMPARATIVE SHARE ANALYSIS OF LARGE ENTERPRISES DESKTOP VIRTUALIZATION MARKET,2021-2031(%)
FIGURE 21.COMPARATIVE SHARE ANALYSIS OF SMBS DESKTOP VIRTUALIZATION MARKET,2021-2031(%)
FIGURE 22.DESKTOP VIRTUALIZATION MARKET,BY INDUSTRY VERTICAL,2021(%)
FIGURE 23.COMPARATIVE SHARE ANALYSIS OF IT & TELECOM DESKTOP VIRTUALIZATION MARKET,2021-2031(%)
FIGURE 24.COMPARATIVE SHARE ANALYSIS OF CONSTRUCTION & MANUFACTURING DESKTOP VIRTUALIZATION MARKET,2021-2031(%)
FIGURE 25.COMPARATIVE SHARE ANALYSIS OF BFSI DESKTOP VIRTUALIZATION MARKET,2021-2031(%)
FIGURE 26.COMPARATIVE SHARE ANALYSIS OF HEALTHCARE DESKTOP VIRTUALIZATION MARKET,2021-2031(%)
FIGURE 27.COMPARATIVE SHARE ANALYSIS OF PUBLIC SECTOR DESKTOP VIRTUALIZATION MARKET,2021-2031(%)
FIGURE 28.COMPARATIVE SHARE ANALYSIS OF RETAIL DESKTOP VIRTUALIZATION MARKET,2021-2031(%)
FIGURE 29.COMPARATIVE SHARE ANALYSIS OF EDUCATION DESKTOP VIRTUALIZATION MARKET,2021-2031(%)
FIGURE 30.COMPARATIVE SHARE ANALYSIS OF OTHERS DESKTOP VIRTUALIZATION MARKET,2021-2031(%)
FIGURE 31.DESKTOP VIRTUALIZATION MARKET BY REGION,2021
FIGURE 32.U.S. DESKTOP VIRTUALIZATION MARKET,2021-2031($MILLION)
FIGURE 33.CANADA DESKTOP VIRTUALIZATION MARKET,2021-2031($MILLION)
FIGURE 34.UNITED KINGDOM DESKTOP VIRTUALIZATION MARKET,2021-2031($MILLION)
FIGURE 35.GERMANY DESKTOP VIRTUALIZATION MARKET,2021-2031($MILLION)
FIGURE 36.FRANCE DESKTOP VIRTUALIZATION MARKET,2021-2031($MILLION)
FIGURE 37.ITALY DESKTOP VIRTUALIZATION MARKET,2021-2031($MILLION)
FIGURE 38.SPAIN DESKTOP VIRTUALIZATION MARKET,2021-2031($MILLION)
FIGURE 39.NETHERLANDS DESKTOP VIRTUALIZATION MARKET,2021-2031($MILLION)
FIGURE 40.REST OF EUROPE DESKTOP VIRTUALIZATION MARKET,2021-2031($MILLION)
FIGURE 41.CHINA DESKTOP VIRTUALIZATION MARKET,2021-2031($MILLION)
FIGURE 42.JAPAN DESKTOP VIRTUALIZATION MARKET,2021-2031($MILLION)
FIGURE 43.SOUTH KOREA DESKTOP VIRTUALIZATION MARKET,2021-2031($MILLION)
FIGURE 44.INDIA DESKTOP VIRTUALIZATION MARKET,2021-2031($MILLION)
FIGURE 45.AUSTRALIA DESKTOP VIRTUALIZATION MARKET,2021-2031($MILLION)
FIGURE 46.REST OF ASIA-PACIFIC DESKTOP VIRTUALIZATION MARKET,2021-2031($MILLION)
FIGURE 47.LATIN AMERICA DESKTOP VIRTUALIZATION MARKET,2021-2031($MILLION)
FIGURE 48.MIDDLE EAST DESKTOP VIRTUALIZATION MARKET,2021-2031($MILLION)
FIGURE 49.AFRICA DESKTOP VIRTUALIZATION MARKET,2021-2031($MILLION)
FIGURE 50. TOP WINNING STRATEGIES, BY YEAR
FIGURE 51. TOP WINNING STRATEGIES, BY DEVELOPMENT
FIGURE 52. TOP WINNING STRATEGIES, BY COMPANY
FIGURE 53.PRODUCT MAPPING OF TOP 10 PLAYERS
FIGURE 54.COMPETITIVE DASHBOARD
FIGURE 55.COMPETITIVE HEATMAP OF TOP 10 KEY PLAYERS
FIGURE 56.VMWARE.: NET SALES ,($MILLION)
$5820
$6540
$9870
HAVE A QUERY?
OUR CUSTOMER

SIMILAR REPORTS