List of Tables
Table 1. Global Microporous Thermal Insulation Material Market Size Growth Rate by Type (US$ Million), 2019 VS 2023 VS 2030
Table 2. Key Players of Withstand Heats <1000°C
Table 3. Key Players of Withstand Heats 1000°C-1200°C
Table 4. Key Players of Withstand Heats 1300°C-1500°C
Table 5. Key Players of Withstand Heats 1600°C-1800°C
Table 6. Key Players of Withstand Heats >1800°C
Table 7. Global Microporous Thermal Insulation Material Market Size Growth Rate by Application (US$ Million), 2019 VS 2023 VS 2030
Table 8. Global Microporous Thermal Insulation Material Market Size Growth Rate (CAGR) by Region (US$ Million): 2019 VS 2023 VS 2030
Table 9. Global Microporous Thermal Insulation Material Market Size by Region (2019-2024) & (US$ Million)
Table 10. Global Microporous Thermal Insulation Material Market Share by Region (2019-2024)
Table 11. Global Microporous Thermal Insulation Material Forecasted Market Size by Region (2025-2030) & (US$ Million)
Table 12. Global Microporous Thermal Insulation Material Market Share by Region (2025-2030)
Table 13. Microporous Thermal Insulation Material Market Trends
Table 14. Microporous Thermal Insulation Material Market Drivers
Table 15. Microporous Thermal Insulation Material Market Challenges
Table 16. Microporous Thermal Insulation Material Market Restraints
Table 17. Global Microporous Thermal Insulation Material Revenue by Players (2019-2024) & (US$ Million)
Table 18. Global Microporous Thermal Insulation Material Revenue Share by Players (2019-2024)
Table 19. Global Top Microporous Thermal Insulation Material by Company Type (Tier 1, Tier 2, and Tier 3) & (based on the Revenue in Microporous Thermal Insulation Material as of 2023)
Table 20. Global Microporous Thermal Insulation Material Industry Ranking 2022 VS 2023 VS 2024
Table 21. Global 5 Largest Players Market Share by Microporous Thermal Insulation Material Revenue (CR5 and HHI) & (2019-2024)
Table 22. Global Key Players of Microporous Thermal Insulation Material, Headquarters and Area Served
Table 23. Global Key Players of Microporous Thermal Insulation Material, Product and Application
Table 24. Global Key Players of Microporous Thermal Insulation Material, Product and Application
Table 25. Mergers & Acquisitions, Expansion Plans
Table 26. Global Microporous Thermal Insulation Material Market Size by Type (2019-2024) & (US$ Million)
Table 27. Global Microporous Thermal Insulation Material Revenue Market Share by Type (2019-2024)
Table 28. Global Microporous Thermal Insulation Material Forecasted Market Size by Type (2025-2030) & (US$ Million)
Table 29. Global Microporous Thermal Insulation Material Revenue Market Share by Type (2025-2030)
Table 30. Global Microporous Thermal Insulation Material Market Size by Application (2019-2024) & (US$ Million)
Table 31. Global Microporous Thermal Insulation Material Revenue Share by Application (2019-2024)
Table 32. Global Microporous Thermal Insulation Material Forecasted Market Size by Application (2025-2030) & (US$ Million)
Table 33. Global Microporous Thermal Insulation Material Revenue Share by Application (2025-2030)
Table 34. North America Microporous Thermal Insulation Material Market Size by Type (2019-2024) & (US$ Million)
Table 35. North America Microporous Thermal Insulation Material Market Size by Type (2025-2030) & (US$ Million)
Table 36. North America Microporous Thermal Insulation Material Market Size by Application (2019-2024) & (US$ Million)
Table 37. North America Microporous Thermal Insulation Material Market Size by Application (2025-2030) & (US$ Million)
Table 38. North America Microporous Thermal Insulation Material Growth Rate (CAGR) by Country (US$ Million): 2019 VS 2023 VS 2030
Table 39. North America Microporous Thermal Insulation Material Market Size by Country (2019-2024) & (US$ Million)
Table 40. North America Microporous Thermal Insulation Material Market Size by Country (2025-2030) & (US$ Million)
Table 41. Europe Microporous Thermal Insulation Material Market Size by Type (2019-2024) & (US$ Million)
Table 42. Europe Microporous Thermal Insulation Material Market Size by Type (2025-2030) & (US$ Million)
Table 43. Europe Microporous Thermal Insulation Material Market Size by Application (2019-2024) & (US$ Million)
Table 44. Europe Microporous Thermal Insulation Material Market Size by Application (2025-2030) & (US$ Million)
Table 45. Europe Microporous Thermal Insulation Material Growth Rate (CAGR) by Country (US$ Million): 2019 VS 2023 VS 2030
Table 46. Europe Microporous Thermal Insulation Material Market Size by Country (2019-2024) & (US$ Million)
Table 47. Europe Microporous Thermal Insulation Material Market Size by Country (2025-2030) & (US$ Million)
Table 48. China Microporous Thermal Insulation Material Market Size by Type (2019-2024) & (US$ Million)
Table 49. China Microporous Thermal Insulation Material Market Size by Type (2025-2030) & (US$ Million)
Table 50. China Microporous Thermal Insulation Material Market Size by Application (2019-2024) & (US$ Million)
Table 51. China Microporous Thermal Insulation Material Market Size by Application (2025-2030) & (US$ Million)
Table 52. Asia Microporous Thermal Insulation Material Market Size by Type (2019-2024) & (US$ Million)
Table 53. Asia Microporous Thermal Insulation Material Market Size by Type (2025-2030) & (US$ Million)
Table 54. Asia Microporous Thermal Insulation Material Market Size by Application (2019-2024) & (US$ Million)
Table 55. Asia Microporous Thermal Insulation Material Market Size by Application (2025-2030) & (US$ Million)
Table 56. Asia Microporous Thermal Insulation Material Growth Rate (CAGR) by Region (US$ Million): 2019 VS 2023 VS 2030
Table 57. Asia Microporous Thermal Insulation Material Market Size by Region (2019-2024) & (US$ Million)
Table 58. Asia Microporous Thermal Insulation Material Market Size by Region (2025-2030) & (US$ Million)
Table 59. Middle East, Africa, and Latin America Microporous Thermal Insulation Material Market Size by Type (2019-2024) & (US$ Million)
Table 60. Middle East, Africa, and Latin America Microporous Thermal Insulation Material Market Size by Type (2025-2030) & (US$ Million)
Table 61. Middle East, Africa, and Latin America Microporous Thermal Insulation Material Market Size by Application (2019-2024) & (US$ Million)
Table 62. Middle East, Africa, and Latin America Microporous Thermal Insulation Material Market Size by Application (2025-2030) & (US$ Million)
Table 63. Middle East, Africa, and Latin America Microporous Thermal Insulation Material Growth Rate (CAGR) by Country (US$ Million): 2019 VS 2023 VS 2030
Table 64. Middle East, Africa, and Latin America Microporous Thermal Insulation Material Market Size by Country (2019-2024) & (US$ Million)
Table 65. Middle East, Africa, and Latin America Microporous Thermal Insulation Material Market Size by Country (2025-2030) & (US$ Million)
Table 66. Promat HPI Company Details
Table 67. Promat HPI Business Overview
Table 68. Promat HPI Microporous Thermal Insulation Material Product
Table 69. Promat HPI Revenue in Microporous Thermal Insulation Material Business (2019-2024) & (US$ Million)
Table 70. Promat HPI Recent Developments
Table 71. Morgan Advanced Materials Company Details
Table 72. Morgan Advanced Materials Business Overview
Table 73. Morgan Advanced Materials Microporous Thermal Insulation Material Product
Table 74. Morgan Advanced Materials Revenue in Microporous Thermal Insulation Material Business (2019-2024) & (US$ Million)
Table 75. Morgan Advanced Materials Recent Developments
Table 76. Isoleika S. Coop Company Details
Table 77. Isoleika S. Coop Business Overview
Table 78. Isoleika S. Coop Microporous Thermal Insulation Material Product
Table 79. Isoleika S. Coop Revenue in Microporous Thermal Insulation Material Business (2019-2024) & (US$ Million)
Table 80. Isoleika S. Coop Recent Developments
Table 81. Johns Manville Corporation Company Details
Table 82. Johns Manville Corporation Business Overview
Table 83. Johns Manville Corporation Microporous Thermal Insulation Material Product
Table 84. Johns Manville Corporation Revenue in Microporous Thermal Insulation Material Business (2019-2024) & (US$ Million)
Table 85. Johns Manville Corporation Recent Developments
Table 86. Unifrax LLC Company Details
Table 87. Unifrax LLC Business Overview
Table 88. Unifrax LLC Microporous Thermal Insulation Material Product
Table 89. Unifrax LLC Revenue in Microporous Thermal Insulation Material Business (2019-2024) & (US$ Million)
Table 90. Unifrax LLC Recent Developments
Table 91. Nichias Corporation Company Details
Table 92. Nichias Corporation Business Overview
Table 93. Nichias Corporation Microporous Thermal Insulation Material Product
Table 94. Nichias Corporation Revenue in Microporous Thermal Insulation Material Business (2019-2024) & (US$ Million)
Table 95. Nichias Corporation Recent Developments
Table 96. Techno Physik Engineering GmbH Company Details
Table 97. Techno Physik Engineering GmbH Business Overview
Table 98. Techno Physik Engineering GmbH Microporous Thermal Insulation Material Product
Table 99. Techno Physik Engineering GmbH Revenue in Microporous Thermal Insulation Material Business (2019-2024) & (US$ Million)
Table 100. Techno Physik Engineering GmbH Recent Developments
Table 101. Elmelin Ltd Company Details
Table 102. Elmelin Ltd Business Overview
Table 103. Elmelin Ltd Microporous Thermal Insulation Material Product
Table 104. Elmelin Ltd Revenue in Microporous Thermal Insulation Material Business (2019-2024) & (US$ Million)
Table 105. Elmelin Ltd Recent Developments
Table 106. Unicorn Insulations Ltd Company Details
Table 107. Unicorn Insulations Ltd Business Overview
Table 108. Unicorn Insulations Ltd Microporous Thermal Insulation Material Product
Table 109. Unicorn Insulations Ltd Revenue in Microporous Thermal Insulation Material Business (2019-2024) & (US$ Million)
Table 110. Unicorn Insulations Ltd Recent Developments
Table 111. Thermodyne Company Details
Table 112. Thermodyne Business Overview
Table 113. Thermodyne Microporous Thermal Insulation Material Product
Table 114. Thermodyne Revenue in Microporous Thermal Insulation Material Business (2019-2024) & (US$ Million)
Table 115. Thermodyne Recent Developments
Table 116. Kingspan Insulation LLC Company Details
Table 117. Kingspan Insulation LLC Business Overview
Table 118. Kingspan Insulation LLC Microporous Thermal Insulation Material Product
Table 119. Kingspan Insulation LLC Revenue in Microporous Thermal Insulation Material Business (2019-2024) & (US$ Million)
Table 120. Kingspan Insulation LLC Recent Developments
Table 121. Anhui Ningguo Hantai New Materials Limited Company Company Details
Table 122. Anhui Ningguo Hantai New Materials Limited Company Business Overview
Table 123. Anhui Ningguo Hantai New Materials Limited Company Microporous Thermal Insulation Material Product
Table 124. Anhui Ningguo Hantai New Materials Limited Company Revenue in Microporous Thermal Insulation Material Business (2019-2024) & (US$ Million)
Table 125. Anhui Ningguo Hantai New Materials Limited Company Recent Developments
Table 126. Laizhou Mingguang Thermal Insulation Material Co. Ltd. Company Details
Table 127. Laizhou Mingguang Thermal Insulation Material Co. Ltd. Business Overview
Table 128. Laizhou Mingguang Thermal Insulation Material Co. Ltd. Microporous Thermal Insulation Material Product
Table 129. Laizhou Mingguang Thermal Insulation Material Co. Ltd. Revenue in Microporous Thermal Insulation Material Business (2019-2024) & (US$ Million)
Table 130. Laizhou Mingguang Thermal Insulation Material Co. Ltd. Recent Developments
Table 131. Shandong Luyang Company Details
Table 132. Shandong Luyang Business Overview
Table 133. Shandong Luyang Microporous Thermal Insulation Material Product
Table 134. Shandong Luyang Revenue in Microporous Thermal Insulation Material Business (2019-2024) & (US$ Million)
Table 135. Shandong Luyang Recent Developments
Table 136. Shanghai Nanovix Thermal Insulation Co., Ltd. Company Details
Table 137. Shanghai Nanovix Thermal Insulation Co., Ltd. Business Overview
Table 138. Shanghai Nanovix Thermal Insulation Co., Ltd. Microporous Thermal Insulation Material Product
Table 139. Shanghai Nanovix Thermal Insulation Co., Ltd. Revenue in Microporous Thermal Insulation Material Business (2019-2024) & (US$ Million)
Table 140. Shanghai Nanovix Thermal Insulation Co., Ltd. Recent Developments
Table 141. Zhongheng New Material Technology Co., Ltd Company Details
Table 142. Zhongheng New Material Technology Co., Ltd Business Overview
Table 143. Zhongheng New Material Technology Co., Ltd Microporous Thermal Insulation Material Product
Table 144. Zhongheng New Material Technology Co., Ltd Revenue in Microporous Thermal Insulation Material Business (2019-2024) & (US$ Million)
Table 145. Zhongheng New Material Technology Co., Ltd Recent Developments
Table 146. Vitcas Company Details
Table 147. Vitcas Business Overview
Table 148. Vitcas Microporous Thermal Insulation Material Product
Table 149. Vitcas Revenue in Microporous Thermal Insulation Material Business (2019-2024) & (US$ Million)
Table 150. Vitcas Recent Developments
Table 151. Final Advanced Materials Sàrl Company Details
Table 152. Final Advanced Materials Sàrl Business Overview
Table 153. Final Advanced Materials Sàrl Microporous Thermal Insulation Material Product
Table 154. Final Advanced Materials Sàrl Revenue in Microporous Thermal Insulation Material Business (2019-2024) & (US$ Million)
Table 155. Final Advanced Materials Sàrl Recent Developments
Table 156. MAJUS Ltd Company Details
Table 157. MAJUS Ltd Business Overview
Table 158. MAJUS Ltd Microporous Thermal Insulation Material Product
Table 159. MAJUS Ltd Revenue in Microporous Thermal Insulation Material Business (2019-2024) & (US$ Million)
Table 160. MAJUS Ltd Recent Developments
Table 161. Research Programs/Design for This Report
Table 162. Key Data Information from Secondary Sources
Table 163. Key Data Information from Primary Sources
List of Figures
Figure 1. Global Microporous Thermal Insulation Material Market Size Growth Rate by Type, 2019 VS 2023 VS 2030 (US$ Million)
Figure 2. Global Microporous Thermal Insulation Material Market Share by Type: 2023 VS 2030
Figure 3. Withstand Heats <1000°C Features
Figure 4. Withstand Heats 1000°C-1200°C Features
Figure 5. Withstand Heats 1300°C-1500°C Features
Figure 6. Withstand Heats 1600°C-1800°C Features
Figure 7. Withstand Heats >1800°C Features
Figure 8. Global Microporous Thermal Insulation Material Market Size Growth Rate by Application, 2019 VS 2023 VS 2030 (US$ Million)
Figure 9. Global Microporous Thermal Insulation Material Market Share by Application: 2023 VS 2030
Figure 10. Foundry and Steel Case Studies
Figure 11. Petrochemical Case Studies
Figure 12. Cement Case Studies
Figure 13. Glass Case Studies
Figure 14. Aerospace Case Studies
Figure 15. Transportation Case Studies
Figure 16. Cryogenic and Refrigeration Applications Case Studies
Figure 17. Microporous Thermal Insulation Material Report Years Considered
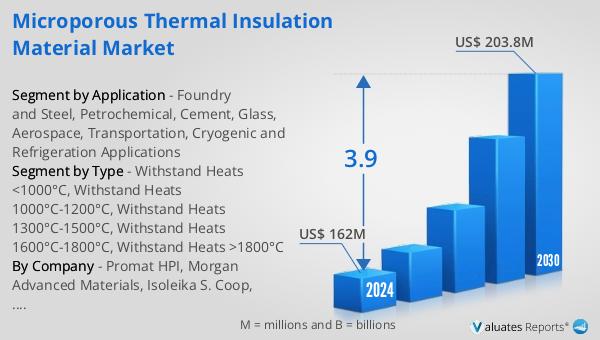
Figure 18. Global Microporous Thermal Insulation Material Market Size (US$ Million), Year-over-Year: 2019-2030
Figure 19. Global Microporous Thermal Insulation Material Market Size, (US$ Million), 2019 VS 2023 VS 2030
Figure 20. Global Microporous Thermal Insulation Material Market Share by Region: 2023 VS 2030
Figure 21. Global Microporous Thermal Insulation Material Market Share by Players in 2023
Figure 22. Global Top Microporous Thermal Insulation Material Players by Company Type (Tier 1, Tier 2, and Tier 3) & (based on the Revenue in Microporous Thermal Insulation Material as of 2023)
Figure 23. The Top 10 and 5 Players Market Share by Microporous Thermal Insulation Material Revenue in 2023
Figure 24. North America Microporous Thermal Insulation Material Market Size YoY Growth (2019-2030) & (US$ Million)
Figure 25. North America Microporous Thermal Insulation Material Market Share by Type (2019-2030)
Figure 26. North America Microporous Thermal Insulation Material Market Share by Application (2019-2030)
Figure 27. North America Microporous Thermal Insulation Material Market Share by Country (2019-2030)
Figure 28. United States Microporous Thermal Insulation Material Market Size YoY Growth (2019-2030) & (US$ Million)
Figure 29. Canada Microporous Thermal Insulation Material Market Size YoY Growth (2019-2030) & (US$ Million)
Figure 30. Europe Microporous Thermal Insulation Material Market Size YoY (2019-2030) & (US$ Million)
Figure 31. Europe Microporous Thermal Insulation Material Market Share by Type (2019-2030)
Figure 32. Europe Microporous Thermal Insulation Material Market Share by Application (2019-2030)
Figure 33. Europe Microporous Thermal Insulation Material Market Share by Country (2019-2030)
Figure 34. Germany Microporous Thermal Insulation Material Market Size YoY Growth (2019-2030) & (US$ Million)
Figure 35. France Microporous Thermal Insulation Material Market Size YoY Growth (2019-2030) & (US$ Million)
Figure 36. U.K. Microporous Thermal Insulation Material Market Size YoY Growth (2019-2030) & (US$ Million)
Figure 37. Italy Microporous Thermal Insulation Material Market Size YoY Growth (2019-2030) & (US$ Million)
Figure 38. Russia Microporous Thermal Insulation Material Market Size YoY Growth (2019-2030) & (US$ Million)
Figure 39. Nordic Countries Microporous Thermal Insulation Material Market Size YoY Growth (2019-2030) & (US$ Million)
Figure 40. China Microporous Thermal Insulation Material Market Size YoY (2019-2030) & (US$ Million)
Figure 41. China Microporous Thermal Insulation Material Market Share by Type (2019-2030)
Figure 42. China Microporous Thermal Insulation Material Market Share by Application (2019-2030)
Figure 43. Asia Microporous Thermal Insulation Material Market Size YoY (2019-2030) & (US$ Million)
Figure 44. Asia Microporous Thermal Insulation Material Market Share by Type (2019-2030)
Figure 45. Asia Microporous Thermal Insulation Material Market Share by Application (2019-2030)
Figure 46. Asia Microporous Thermal Insulation Material Market Share by Region (2019-2030)
Figure 47. Japan Microporous Thermal Insulation Material Market Size YoY Growth (2019-2030) & (US$ Million)
Figure 48. South Korea Microporous Thermal Insulation Material Market Size YoY Growth (2019-2030) & (US$ Million)
Figure 49. China Taiwan Microporous Thermal Insulation Material Market Size YoY Growth (2019-2030) & (US$ Million)
Figure 50. Southeast Asia Microporous Thermal Insulation Material Market Size YoY Growth (2019-2030) & (US$ Million)
Figure 51. India Microporous Thermal Insulation Material Market Size YoY Growth (2019-2030) & (US$ Million)
Figure 52. Australia Microporous Thermal Insulation Material Market Size YoY Growth (2019-2030) & (US$ Million)
Figure 53. Middle East, Africa, and Latin America Microporous Thermal Insulation Material Market Size YoY (2019-2030) & (US$ Million)
Figure 54. Middle East, Africa, and Latin America Microporous Thermal Insulation Material Market Share by Type (2019-2030)
Figure 55. Middle East, Africa, and Latin America Microporous Thermal Insulation Material Market Share by Application (2019-2030)
Figure 56. Middle East, Africa, and Latin America Microporous Thermal Insulation Material Market Share by Country (2019-2030)
Figure 57. Brazil Microporous Thermal Insulation Material Market Size YoY Growth (2019-2030) & (US$ Million)
Figure 58. Mexico Microporous Thermal Insulation Material Market Size YoY Growth (2019-2030) & (US$ Million)
Figure 59. Turkey Microporous Thermal Insulation Material Market Size YoY Growth (2019-2030) & (US$ Million)
Figure 60. Saudi Arabia Microporous Thermal Insulation Material Market Size YoY Growth (2019-2030) & (US$ Million)
Figure 61. Israel Microporous Thermal Insulation Material Market Size YoY Growth (2019-2030) & (US$ Million)
Figure 62. GCC Countries Microporous Thermal Insulation Material Market Size YoY Growth (2019-2030) & (US$ Million)
Figure 63. Promat HPI Revenue Growth Rate in Microporous Thermal Insulation Material Business (2019-2024)
Figure 64. Morgan Advanced Materials Revenue Growth Rate in Microporous Thermal Insulation Material Business (2019-2024)
Figure 65. Isoleika S. Coop Revenue Growth Rate in Microporous Thermal Insulation Material Business (2019-2024)
Figure 66. Johns Manville Corporation Revenue Growth Rate in Microporous Thermal Insulation Material Business (2019-2024)
Figure 67. Unifrax LLC Revenue Growth Rate in Microporous Thermal Insulation Material Business (2019-2024)
Figure 68. Nichias Corporation Revenue Growth Rate in Microporous Thermal Insulation Material Business (2019-2024)
Figure 69. Techno Physik Engineering GmbH Revenue Growth Rate in Microporous Thermal Insulation Material Business (2019-2024)
Figure 70. Elmelin Ltd Revenue Growth Rate in Microporous Thermal Insulation Material Business (2019-2024)
Figure 71. Unicorn Insulations Ltd Revenue Growth Rate in Microporous Thermal Insulation Material Business (2019-2024)
Figure 72. Thermodyne Revenue Growth Rate in Microporous Thermal Insulation Material Business (2019-2024)
Figure 73. Kingspan Insulation LLC Revenue Growth Rate in Microporous Thermal Insulation Material Business (2019-2024)
Figure 74. Anhui Ningguo Hantai New Materials Limited Company Revenue Growth Rate in Microporous Thermal Insulation Material Business (2019-2024)
Figure 75. Laizhou Mingguang Thermal Insulation Material Co. Ltd. Revenue Growth Rate in Microporous Thermal Insulation Material Business (2019-2024)
Figure 76. Shandong Luyang Revenue Growth Rate in Microporous Thermal Insulation Material Business (2019-2024)
Figure 77. Shanghai Nanovix Thermal Insulation Co., Ltd. Revenue Growth Rate in Microporous Thermal Insulation Material Business (2019-2024)
Figure 78. Zhongheng New Material Technology Co., Ltd Revenue Growth Rate in Microporous Thermal Insulation Material Business (2019-2024)
Figure 79. Vitcas Revenue Growth Rate in Microporous Thermal Insulation Material Business (2019-2024)
Figure 80. Final Advanced Materials Sàrl Revenue Growth Rate in Microporous Thermal Insulation Material Business (2019-2024)
Figure 81. MAJUS Ltd Revenue Growth Rate in Microporous Thermal Insulation Material Business (2019-2024)
Figure 82. Bottom-up and Top-down Approaches for This Report
Figure 83. Data Triangulation
Figure 84. Key Executives Interviewed