
Security Analytics Market Statistics 2027
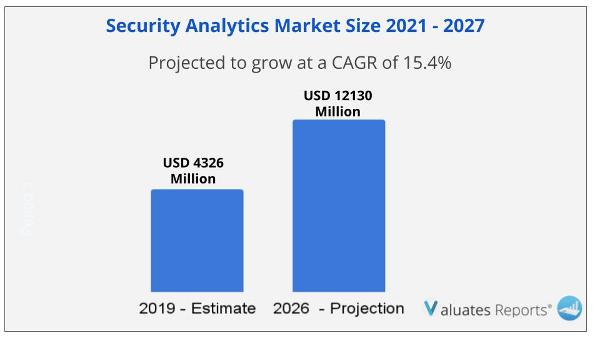
The global Security Analytics market size is projected to reach US$ 12130 million by 2026, from US$ 4326 million in 2019, at a CAGR of 15.4% during 2021-2026. Security analytics is the process of using data collection, aggregation, and analysis tools for security monitoring and threat detection. The North American region, followed by Europe, is expected to become the largest revenue generating region for security analytics vendors in 2018. This is mainly because in the developed economies of the U.S. and Canada, there is a high focus on innovations obtained from research and development and technology. The APAC region is expected to be the fastest-growing region in the security analytics market. The growth in this region is primarily driven by the growing adoption of web and mobile based business applications.
Security Analytics Market Trends
The increased demand for recognizing trends, prioritization of network-based risks with actionable information to reduce data losses, and avoidance of forwarding infiltration are projected to boost the security analytics market. Security analytics solutions have progressed beyond rule-based detection to data science approaches such as Machine Learning (ML) and Artificial Intelligence (AI). To effectively manage threats, security teams must integrate security analytics with the large amount of machine-generated data encountered in most organizational environments. Tools such as network traffic analysis, endpoint detection, SIEM, and User Behavior Analytics (UBA) harvest this data and reveal who is doing what in the IT environment, and when and how they are doing it.
Security intelligence that is actionable can substantially aid the IT department in controlling and responding to security events caused by the most recent threats. This has the attention of C-level executives, and it will become a critical component of overall risk management priorities for organizations seeking to protect themselves from harmful incidents and public disclosure of security incidents that could harm the organization's reputation and competitive positioning, as well as its bottom line. With the increased use by various companies, the security analytics market is expected to grow.
Banking and financial service providers are increasingly relying on cloud-based technology to provide shared banking services to third-party networks, vendors, and clients, putting them at risk of a number of security risks and data breaches. Banking and financial institutions are updating their security architecture with analytics-driven security solutions as a result of exposure to cyber risks from a variety of applications and the requirement to handle security audits effectively in real-time. As a result, the BFSI industry's expanding adoption is expected to propel the security analytics market even further.
The COVID-19 pandemic has pushed businesses to embrace remote working environments and regulations that allow employees to work from home. The use of third-party networks, digital platforms, and personal computing devices has increased as a result of these conventional security procedures. Cyberattacks and complex malware become more likely when such network connectivity methods are used. The security analytics market is likely to grow even faster as a result of this.
Security Analytics Market Share Analysis
During the projected period, North America is expected to be the most profitable segment. This is because the developed economies of the United States and Canada have placed a premium on protecting client data.
The network security analytics market is predicted to be the most profitable by type. The demand for behavioral-based security analytics to monitor network telemetry and firewall logs and comply with organizational norms is driving this market. Furthermore, the rising risk of undetected malware in network layers and encrypted network traffic is driving enterprises to develop solutions.
The BFSI market is likely to be the most profitable in terms of application. Phishing attempts and frauds in third-party payment interfaces are on the rise, as are the dangers of utilizing mobile banking apps, and regulatory requirements are tightening.
In the competitive analysis section of the report, leading as well as prominent players of the global Security Analytics market are broadly studied on the basis of key factors. The report offers comprehensive analysis and accurate statistics on revenue by the player for the period 2016-2021. It also offers detailed analysis supported by reliable statistics on price and revenue (global level) by players for the period 2016-2021.
Security Analytics Market Scope
|
Report Metric |
Details |
|
Report Name |
Security Analytics Market |
|
The Market size value in 2019 |
4326 Million USD |
|
The Revenue forecast in 2026 |
12130 Million USD |
|
Growth Rate |
CAGR of 15.4% from 2021 to 2026 |
|
Base year considered |
2019 |
|
Forecast period |
2021-2026 |
|
Forecast units |
Value (USD) |
|
Segments covered |
Type, End-User, Offerings, and Region |
|
Report coverage |
Revenue & volume forecast, company share, competitive landscape, growth factors, and trends |
|
Geographic regions covered |
North America, Europe, Asia Pacific, Latin America, Middle East & Africa |
|
Companies covered |
Cisco, IBM, HPE, Dell EMC, Fireeye, NETSCOUT Arbor, LogRhythm, Alert Logic, Symantec, AlienVault |
Ans. The global Security Analytics market size is projected to reach USD 12130 million by 2026, from USD 4326 million in 2019.
Ans. The global Security Analytics market is expected to grow at a compound annual growth rate of 15.4% from 2021 to 2026.
Ans. Cisco, IBM, HPE, Dell EMC, Fireeye, NETSCOUT Arbor, LogRhythm, Alert Logic, Symantec, AlienVault.
Table of Contents
1 Report Overview
1.1 Study Scope
1.2 Market Analysis by Type
1.2.1 Global Security Analytics Market Size Growth Rate by Type: 2016 VS 2021 VS 2027
1.2.2 Web Security Analytics
1.2.3 Network Security Analytics
1.2.4 Endpoint Security Analytics
1.2.5 Application Security Analytics
1.2.6 Others
1.3 Market by Application
1.3.1 Global Security Analytics Market Share by Application: 2016 VS 2021 VS 2027
1.3.2 Government & Defense
1.3.3 BFSI
1.3.4 Consumer Goods & Retail
1.3.5 IT & Telecom
1.3.6 Healthcare
1.3.7 Energy & Utilities
1.3.8 Manufacturing
1.3.9 Education
1.3.10 Transportation
1.4 Study Objectives
1.5 Years Considered
2 Global Growth Trends
2.1 Global Security Analytics Market Perspective (2016-2027)
2.2 Security Analytics Growth Trends by Regions
2.2.1 Security Analytics Market Size by Regions: 2016 VS 2021 VS 2027
2.2.2 Security Analytics Historic Market Share by Regions (2016-2021)
2.2.3 Security Analytics Forecasted Market Size by Regions (2022-2027)
2.3 Security Analytics Industry Dynamic
2.3.1 Security Analytics Market Trends
2.3.2 Security Analytics Market Drivers
2.3.3 Security Analytics Market Challenges
2.3.4 Security Analytics Market Restraints
3 Competition Landscape by Key Players
3.1 Global Top Security Analytics Players by Revenue
3.1.1 Global Top Security Analytics Players by Revenue (2016-2021)
3.1.2 Global Security Analytics Revenue Market Share by Players (2016-2021)
3.2 Global Security Analytics Market Share by Company Type (Tier 1, Tier 2 and Tier 3)
3.3 Players Covered: Ranking by Security Analytics Revenue
3.4 Global Security Analytics Market Concentration Ratio
3.4.1 Global Security Analytics Market Concentration Ratio (CR5 and HHI)
3.4.2 Global Top 10 and Top 5 Companies by Security Analytics Revenue in 2020
3.5 Security Analytics Key Players Head office and Area Served
3.6 Key Players Security Analytics Product Solution and Service
3.7 Date of Enter into Security Analytics Market
3.8 Mergers & Acquisitions, Expansion Plans
4 Security Analytics Breakdown Data by Type
4.1 Global Security Analytics Historic Market Size by Type (2016-2021)
4.2 Global Security Analytics Forecasted Market Size by Type (2022-2027)
5 Security Analytics Breakdown Data by Application
5.1 Global Security Analytics Historic Market Size by Application (2016-2021)
5.2 Global Security Analytics Forecasted Market Size by Application (2022-2027)
6 North America
6.1 North America Security Analytics Market Size (2016-2027)
6.2 North America Security Analytics Market Size by Type
6.2.1 North America Security Analytics Market Size by Type (2016-2021)
6.2.2 North America Security Analytics Market Size by Type (2022-2027)
6.2.3 North America Security Analytics Market Size by Type (2016-2027)
6.3 North America Security Analytics Market Size by Application
6.3.1 North America Security Analytics Market Size by Application (2016-2021)
6.3.2 North America Security Analytics Market Size by Application (2022-2027)
6.3.3 North America Security Analytics Market Size by Application (2016-2027)
6.4 North America Security Analytics Market Size by Country
6.4.1 North America Security Analytics Market Size by Country (2016-2021)
6.4.2 North America Security Analytics Market Size by Country (2022-2027)
6.4.3 United States
6.4.4 Canada
7 Europe
7.1 Europe Security Analytics Market Size (2016-2027)
7.2 Europe Security Analytics Market Size by Type
7.2.1 Europe Security Analytics Market Size by Type (2016-2021)
7.2.2 Europe Security Analytics Market Size by Type (2022-2027)
7.2.3 Europe Security Analytics Market Size by Type (2016-2027)
7.3 Europe Security Analytics Market Size by Application
7.3.1 Europe Security Analytics Market Size by Application (2016-2021)
7.3.2 Europe Security Analytics Market Size by Application (2022-2027)
7.3.3 Europe Security Analytics Market Size by Application (2016-2027)
7.4 Europe Security Analytics Market Size by Country
7.4.1 Europe Security Analytics Market Size by Country (2016-2021)
7.4.2 Europe Security Analytics Market Size by Country (2022-2027)
7.4.3 Germany
7.4.4 France
7.4.5 U.K.
7.4.6 Italy
7.4.7 Russia
7.4.8 Nordic
8 Asia-Pacific
8.1 Asia-Pacific Security Analytics Market Size (2016-2027)
8.2 Asia-Pacific Security Analytics Market Size by Type
8.2.1 Asia-Pacific Security Analytics Market Size by Type (2016-2021)
8.2.2 Asia-Pacific Security Analytics Market Size by Type (2022-2027)
8.2.3 Asia-Pacific Security Analytics Market Size by Type (2016-2027)
8.3 Asia-Pacific Security Analytics Market Size by Application
8.3.1 Asia-Pacific Security Analytics Market Size by Application (2016-2021)
8.3.2 Asia-Pacific Security Analytics Market Size by Application (2022-2027)
8.3.3 Asia-Pacific Security Analytics Market Size by Application (2016-2027)
8.4 Asia-Pacific Security Analytics Market Size by Region
8.4.1 Asia-Pacific Security Analytics Market Size by Region (2016-2021)
8.4.2 Asia-Pacific Security Analytics Market Size by Region (2022-2027)
8.4.3 China
8.4.4 Japan
8.4.5 South Korea
8.4.6 Southeast Asia
8.4.7 India
8.4.8 Australia
9 Latin America
9.1 Latin America Security Analytics Market Size (2016-2027)
9.2 Latin America Security Analytics Market Size by Type
9.2.1 Latin America Security Analytics Market Size by Type (2016-2021)
9.2.2 Latin America Security Analytics Market Size by Type (2022-2027)
9.2.3 Latin America Security Analytics Market Size by Type (2016-2027)
9.3 Latin America Security Analytics Market Size by Application
9.3.1 Latin America Security Analytics Market Size by Application (2016-2021)
9.3.2 Latin America Security Analytics Market Size by Application (2022-2027)
9.3.3 Latin America Security Analytics Market Size by Application (2016-2027)
9.4 Latin America Security Analytics Market Size by Country
9.4.1 Latin America Security Analytics Market Size by Country (2016-2021)
9.4.2 Latin America Security Analytics Market Size by Country (2022-2027)
9.4.3 Mexico
9.4.4 Brazil
10 Middle East & Africa
10.1 Middle East & Africa Security Analytics Market Size (2016-2027)
10.2 Middle East & Africa Security Analytics Market Size by Type
10.2.1 Middle East & Africa Security Analytics Market Size by Type (2016-2021)
10.2.2 Middle East & Africa Security Analytics Market Size by Type (2022-2027)
10.2.3 Middle East & Africa Security Analytics Market Size by Type (2016-2027)
10.3 Middle East & Africa Security Analytics Market Size by Application
10.3.1 Middle East & Africa Security Analytics Market Size by Application (2016-2021)
10.3.2 Middle East & Africa Security Analytics Market Size by Application (2022-2027)
10.3.3 Middle East & Africa Security Analytics Market Size by Application (2016-2027)
10.4 Middle East & Africa Security Analytics Market Size by Country
10.4.1 Middle East & Africa Security Analytics Market Size by Country (2016-2021)
10.4.2 Middle East & Africa Security Analytics Market Size by Country (2022-2027)
10.4.3 Turkey
10.4.4 Saudi Arabia
10.4.5 UAE
11 Key Players Profiles
11.1 Cisco
11.1.1 Cisco Company Details
11.1.2 Cisco Business Overview
11.1.3 Cisco Security Analytics Introduction
11.1.4 Cisco Revenue in Security Analytics Business (2016-2021)
11.1.5 Cisco Recent Development
11.2 IBM
11.2.1 IBM Company Details
11.2.2 IBM Business Overview
11.2.3 IBM Security Analytics Introduction
11.2.4 IBM Revenue in Security Analytics Business (2016-2021)
11.2.5 IBM Recent Development
11.3 HPE
11.3.1 HPE Company Details
11.3.2 HPE Business Overview
11.3.3 HPE Security Analytics Introduction
11.3.4 HPE Revenue in Security Analytics Business (2016-2021)
11.3.5 HPE Recent Development
11.4 Dell EMC
11.4.1 Dell EMC Company Details
11.4.2 Dell EMC Business Overview
11.4.3 Dell EMC Security Analytics Introduction
11.4.4 Dell EMC Revenue in Security Analytics Business (2016-2021)
11.4.5 Dell EMC Recent Development
11.5 Fireeye
11.5.1 Fireeye Company Details
11.5.2 Fireeye Business Overview
11.5.3 Fireeye Security Analytics Introduction
11.5.4 Fireeye Revenue in Security Analytics Business (2016-2021)
11.5.5 Fireeye Recent Development
11.6 NETSCOUT Arbor
11.6.1 NETSCOUT Arbor Company Details
11.6.2 NETSCOUT Arbor Business Overview
11.6.3 NETSCOUT Arbor Security Analytics Introduction
11.6.4 NETSCOUT Arbor Revenue in Security Analytics Business (2016-2021)
11.6.5 NETSCOUT Arbor Recent Development
11.7 LogRhythm
11.7.1 LogRhythm Company Details
11.7.2 LogRhythm Business Overview
11.7.3 LogRhythm Security Analytics Introduction
11.7.4 LogRhythm Revenue in Security Analytics Business (2016-2021)
11.7.5 LogRhythm Recent Development
11.8 Alert Logic
11.8.1 Alert Logic Company Details
11.8.2 Alert Logic Business Overview
11.8.3 Alert Logic Security Analytics Introduction
11.8.4 Alert Logic Revenue in Security Analytics Business (2016-2021)
11.8.5 Alert Logic Recent Development
11.9 Symantec
11.9.1 Symantec Company Details
11.9.2 Symantec Business Overview
11.9.3 Symantec Security Analytics Introduction
11.9.4 Symantec Revenue in Security Analytics Business (2016-2021)
11.9.5 Symantec Recent Development
11.10 AlienVault
11.10.1 AlienVault Company Details
11.10.2 AlienVault Business Overview
11.10.3 AlienVault Security Analytics Introduction
11.10.4 AlienVault Revenue in Security Analytics Business (2016-2021)
11.10.5 AlienVault Recent Development
12 Analyst's Viewpoints/Conclusions
13 Appendix
13.1 Research Methodology
13.1.1 Methodology/Research Approach
13.1.2 Data Source
13.2 Disclaimer
13.3 Author Details
List of Tables
Table 1. Global Security Analytics Market Size Growth Rate by Type (US$ Million):2016 VS 2021 VS 2027
Table 2. Key Players of Web Security Analytics
Table 3. Key Players of Network Security Analytics
Table 4. Key Players of Endpoint Security Analytics
Table 5. Key Players of Application Security Analytics
Table 6. Key Players of Others
Table 7. Global Security Analytics Market Size Growth by Application (US$ Million): 2016 VS 2021 VS 2027
Table 8. Global Security Analytics Market Size by Regions (US$ Million): 2016 VS 2021 VS 2027
Table 9. Global Security Analytics Market Size by Regions (2016-2021) & (US$ Million)
Table 10. Global Security Analytics Market Share by Regions (2016-2021)
Table 11. Global Security Analytics Forecasted Market Size by Regions (2022-2027) & (US$ Million)
Table 12. Global Security Analytics Market Share by Regions (2022-2027)
Table 13. Security Analytics Market Trends
Table 14. Security Analytics Market Drivers
Table 15. Security Analytics Market Challenges
Table 16. Security Analytics Market Restraints
Table 17. Global Security Analytics Revenue by Players (2016-2021) & (US$ Million)
Table 18. Global Security Analytics Market Share by Players (2016-2021)
Table 19. Global Top Security Analytics Players by Company Type (Tier 1, Tier 2 and Tier 3) (based on the Revenue in Security Analytics as of 2020)
Table 20. Ranking of Global Top Security Analytics Companies by Revenue (US$ Million) in 2020
Table 21. Global 5 Largest Players Market Share by Security Analytics Revenue (CR5 and HHI) & (2016-2021)
Table 22. Key Players Headquarters and Area Served
Table 23. Key Players Security Analytics Product Solution and Service
Table 24. Date of Enter into Security Analytics Market
Table 25. Mergers & Acquisitions, Expansion Plans
Table 26. Global Security Analytics Market Size by Type (2016-2021) (US$ Million)
Table 27. Global Security Analytics Revenue Market Share by Type (2016-2021)
Table 28. Global Security Analytics Forecasted Market Size by Type (2022-2027) (US$ Million)
Table 29. Global Security Analytics Revenue Market Share by Type (2022-2027) & (US$ Million)
Table 30. Global Security Analytics Market Size Share by Application (2016-2021) & (US$ Million)
Table 31. Global Security Analytics Revenue Market Share by Application (2016-2021)
Table 32. Global Security Analytics Forecasted Market Size by Application (2022-2027) (US$ Million)
Table 33. Global Security Analytics Revenue Market Share by Application (2022-2027) & (US$ Million)
Table 34. North America Security Analytics Market Size by Type (2016-2021) (US$ Million)
Table 35. North America Security Analytics Market Size by Type (2022-2027) & (US$ Million)
Table 36. North America Security Analytics Market Size by Application (2016-2021) (US$ Million)
Table 37. North America Security Analytics Market Size by Application (2022-2027) & (US$ Million)
Table 38. North America Security Analytics Market Size by Country (2016-2021) & (US$ Million)
Table 39. North America Security Analytics Market Size by Country (2022-2027) & (US$ Million)
Table 40. Europe Security Analytics Market Size by Type (2016-2021) (US$ Million)
Table 41. Europe Security Analytics Market Size by Type (2022-2027) & (US$ Million)
Table 42. Europe Security Analytics Market Size by Application (2016-2021) (US$ Million)
Table 43. Europe Security Analytics Market Size by Application (2022-2027) & (US$ Million)
Table 44. Europe Security Analytics Market Size by Country (2016-2021) & (US$ Million)
Table 45. Europe Security Analytics Market Size by Country (2022-2027) & (US$ Million)
Table 46. Asia-Pacific Security Analytics Market Size by Type (2016-2021) (US$ Million)
Table 47. Asia-Pacific Security Analytics Market Size by Type (2022-2027) & (US$ Million)
Table 48. Asia-Pacific Security Analytics Market Size by Application (2016-2021) (US$ Million)
Table 49. Asia-Pacific Security Analytics Market Size by Application (2022-2027) & (US$ Million)
Table 50. Asia-Pacific Security Analytics Market Size by Region (2016-2021) & (US$ Million)
Table 51. Asia-Pacific Security Analytics Market Size by Region (2022-2027) & (US$ Million)
Table 52. Latin America Security Analytics Market Size by Type (2016-2021) (US$ Million)
Table 53. Latin America Security Analytics Market Size by Type (2022-2027) & (US$ Million)
Table 54. Latin America Security Analytics Market Size by Application (2016-2021) (US$ Million)
Table 55. Latin America Security Analytics Market Size by Application (2022-2027) & (US$ Million)
Table 56. Latin America Security Analytics Market Size by Country (2016-2021) & (US$ Million)
Table 57. Latin America Security Analytics Market Size by Country (2022-2027) & (US$ Million)
Table 58. Middle East & Africa Security Analytics Market Size by Type (2016-2021) (US$ Million)
Table 59. Middle East & Africa Security Analytics Market Size by Type (2022-2027) & (US$ Million)
Table 60. Middle East & Africa Security Analytics Market Size by Application (2016-2021) (US$ Million)
Table 61. Middle East & Africa Security Analytics Market Size by Application (2022-2027) & (US$ Million)
Table 62. Middle East & Africa Security Analytics Market Size by Country (2016-2021) & (US$ Million)
Table 63. Middle East & Africa Security Analytics Market Size by Country (2022-2027) & (US$ Million)
Table 64. Cisco Company Details
Table 65. Cisco Business Overview
Table 66. Cisco Security Analytics Product
Table 67. Cisco Revenue in Security Analytics Business (2016-2021) & (US$ Million)
Table 68. Cisco Recent Development
Table 69. IBM Company Details
Table 70. IBM Business Overview
Table 71. IBM Security Analytics Product
Table 72. IBM Revenue in Security Analytics Business (2016-2021) & (US$ Million)
Table 73. IBM Recent Development
Table 74. HPE Company Details
Table 75. HPE Business Overview
Table 76. HPE Security Analytics Product
Table 77. HPE Revenue in Security Analytics Business (2016-2021) & (US$ Million)
Table 78. HPE Recent Development
Table 79. Dell EMC Company Details
Table 80. Dell EMC Business Overview
Table 81. Dell EMC Security Analytics Product
Table 82. Dell EMC Revenue in Security Analytics Business (2016-2021) & (US$ Million)
Table 83. Dell EMC Recent Development
Table 84. Fireeye Company Details
Table 85. Fireeye Business Overview
Table 86. Fireeye Security Analytics Product
Table 87. Fireeye Revenue in Security Analytics Business (2016-2021) & (US$ Million)
Table 88. Fireeye Recent Development
Table 89. NETSCOUT Arbor Company Details
Table 90. NETSCOUT Arbor Business Overview
Table 91. NETSCOUT Arbor Security Analytics Product
Table 92. NETSCOUT Arbor Revenue in Security Analytics Business (2016-2021) & (US$ Million)
Table 93. NETSCOUT Arbor Recent Development
Table 94. LogRhythm Company Details
Table 95. LogRhythm Business Overview
Table 96. LogRhythm Security Analytics Product
Table 97. LogRhythm Revenue in Security Analytics Business (2016-2021) & (US$ Million)
Table 98. LogRhythm Recent Development
Table 99. Alert Logic Company Details
Table 100. Alert Logic Business Overview
Table 101. Alert Logic Revenue in Security Analytics Business (2016-2021) & (US$ Million)
Table 102. Alert Logic Recent Development
Table 103. Symantec Company Details
Table 104. Symantec Business Overview
Table 105. Symantec Security Analytics Product
Table 106. Symantec Revenue in Security Analytics Business (2016-2021) & (US$ Million)
Table 107. Symantec Recent Development
Table 108. AlienVault Company Details
Table 109. AlienVault Business Overview
Table 110. AlienVault Security Analytics Product
Table 111. AlienVault Revenue in Security Analytics Business (2016-2021) & (US$ Million)
Table 112. AlienVault Recent Development
Table 113. Research Programs/Design for This Report
Table 114. Key Data Information from Secondary Sources
Table 115. Key Data Information from Primary Sources
List of Figures
Figure 1. Global Security Analytics Market Share by Type: 2020 VS 2027
Figure 2. Web Security Analytics Features
Figure 3. Network Security Analytics Features
Figure 4. Endpoint Security Analytics Features
Figure 5. Application Security Analytics Features
Figure 6. Others Features
Figure 7. Global Security Analytics Market Share by Application: 2020 VS 2027
Figure 8. Government & Defense Case Studies
Figure 9. BFSI Case Studies
Figure 10. Consumer Goods & Retail Case Studies
Figure 11. IT & Telecom Case Studies
Figure 12. Healthcare Case Studies
Figure 13. Energy & Utilities Case Studies
Figure 14. Manufacturing Case Studies
Figure 15. Education Case Studies
Figure 16. Transportation Case Studies
Figure 17. Security Analytics Report Years Considered
Figure 18. Global Security Analytics Market Size (US$ Million), Year-over-Year: 2016-2027
Figure 19. Global Security Analytics Market Size (US$ Million), 2016 VS 2021 VS 2027
Figure 20. Global Security Analytics Market Share by Regions: 2020 VS 2027
Figure 21. Global Security Analytics Market Share by Regions (2022-2027)
Figure 22. Global Security Analytics Market Share by Players in 2020
Figure 23. Global Top Security Analytics Players by Company Type (Tier 1, Tier 2 and Tier 3) (based on the Revenue in Security Analytics as of 2020
Figure 24. The Top 10 and 5 Players Market Share by Security Analytics Revenue in 2020
Figure 25. Global Security Analytics Revenue Market Share by Type (2016-2021)
Figure 26. Global Security Analytics Revenue Market Share by Type (2022-2027)
Figure 27. North America Security Analytics Market Size YoY Growth (2016-2027) & (US$ Million)
Figure 28. North America Security Analytics Market Share by Type (2016-2027)
Figure 29. North America Security Analytics Market Share by Application (2016-2027)
Figure 30. North America Security Analytics Market Share by Country (2016-2027)
Figure 31. United States Security Analytics Market Size YoY Growth (2016-2027) & (US$ Million)
Figure 32. Canada Security Analytics Market Size YoY Growth (2016-2027) & (US$ Million)
Figure 33. Europe Security Analytics Market Size YoY Growth (2016-2027) & (US$ Million)
Figure 34. Europe Security Analytics Market Share by Type (2016-2027)
Figure 35. Europe Security Analytics Market Share by Application (2016-2027)
Figure 36. Europe Security Analytics Market Share by Country (2016-2027)
Figure 37. Germany Security Analytics Market Size YoY Growth (2016-2027) & (US$ Million)
Figure 38. France Security Analytics Market Size YoY Growth (2016-2027) & (US$ Million)
Figure 39. U.K. Security Analytics Market Size YoY Growth (2016-2027) & (US$ Million)
Figure 40. Italy Security Analytics Market Size YoY Growth (2016-2027) & (US$ Million)
Figure 41. Russia Security Analytics Market Size YoY Growth (2016-2027) & (US$ Million)
Figure 42. Nordic Security Analytics Market Size YoY Growth (2016-2027) & (US$ Million)
Figure 43. Asia-Pacific Security Analytics Market Size YoY Growth (2016-2027) & (US$ Million)
Figure 44. Asia-Pacific Security Analytics Market Share by Type (2016-2027)
Figure 45. Asia-Pacific Security Analytics Market Share by Application (2016-2027)
Figure 46. Asia-Pacific Security Analytics Market Share by Region (2016-2027)
Figure 47. China Security Analytics Market Size YoY Growth (2016-2027) & (US$ Million)
Figure 48. Japan Security Analytics Market Size YoY Growth (2016-2027) & (US$ Million)
Figure 49. South Korea Security Analytics Market Size YoY Growth (2016-2027) & (US$ Million)
Figure 50. Southeast Asia Security Analytics Market Size YoY Growth (2016-2027) & (US$ Million)
Figure 51. India Security Analytics Market Size YoY Growth (2016-2027) & (US$ Million)
Figure 52. Australia Security Analytics Market Size YoY Growth (2016-2027) & (US$ Million)
Figure 53. Latin America Security Analytics Market Size YoY Growth (2016-2027) & (US$ Million)
Figure 54. Latin America Security Analytics Market Share by Type (2016-2027)
Figure 55. Latin America Security Analytics Market Share by Application (2016-2027)
Figure 56. Latin America Security Analytics Market Share by Country (2016-2027)
Figure 57. Mexico Security Analytics Market Size YoY Growth (2016-2027) & (US$ Million)
Figure 58. Brazil Security Analytics Market Size YoY Growth (2016-2027) & (US$ Million)
Figure 59. Middle East & Africa Security Analytics Market Size YoY Growth (2016-2027) & (US$ Million)
Figure 60. Middle East & Africa Security Analytics Market Share by Type (2016-2027)
Figure 61. Middle East & Africa Security Analytics Market Share by Application (2016-2027)
Figure 62. Middle East & Africa Security Analytics Market Share by Country (2016-2027)
Figure 63. Turkey Security Analytics Market Size YoY Growth (2016-2027) & (US$ Million)
Figure 64. Saudi Arabia Security Analytics Market Size YoY Growth (2016-2027) & (US$ Million)
Figure 65. UAE Security Analytics Market Size YoY Growth (2016-2027) & (US$ Million)
Figure 66. Cisco Revenue Growth Rate in Security Analytics Business (2016-2021)
Figure 67. IBM Revenue Growth Rate in Security Analytics Business (2016-2021)
Figure 68. HPE Revenue Growth Rate in Security Analytics Business (2016-2021)
Figure 69. Dell EMC Revenue Growth Rate in Security Analytics Business (2016-2021)
Figure 70. Fireeye Revenue Growth Rate in Security Analytics Business (2016-2021)
Figure 71. NETSCOUT Arbor Revenue Growth Rate in Security Analytics Business (2016-2021)
Figure 72. LogRhythm Revenue Growth Rate in Security Analytics Business (2016-2021)
Figure 73. Alert Logic Revenue Growth Rate in Security Analytics Business (2016-2021)
Figure 74. Symantec Revenue Growth Rate in Security Analytics Business (2016-2021)
Figure 75. AlienVault Revenue Growth Rate in Security Analytics Business (2016-2021)
Figure 76. Bottom-up and Top-down Approaches for This Report
Figure 77. Data Triangulation
Figure 78. Key Executives Interviewed
$3900
$5850
$7800
HAVE A QUERY?
OUR CUSTOMER
SIMILAR REPORTS