1
U.S. (TOLL FREE)
+1 (315) 215-3225
Automative

1
U.S. (TOLL FREE)
+1 (315) 215-3225
Global and India Accounts Receivable & Accounts Payable Automation Market Report & Forecast 2023-2029
Published Date: December 2023
|
Report Code: QYRE-Auto-10R16134
Home | Market Reports | Computers & Electronics| Enterprise Technology
Global and India Accounts Receivable Accounts Payable Automation Market Report Forecast 2023 2029
BUY CHAPTERS

Global and India Accounts Receivable & Accounts Payable Automation Market Report & Forecast 2023-2029

Code: QYRE-Auto-10R16134
Report
December 2023
Pages:121
QYResearch
Buy Now with 15% Discount
DESCRIPTION
TABLE OF CONTENT
TABLES & FIGURES

and India Accounts Receivable & Accounts Payable Automation Market Size

The global Accounts Receivable & Accounts Payable Automation revenue was US$ 2548 million in 2022 and is forecast to a readjusted size of US$ 4939.7 million by 2029 with a CAGR of 9.8% during the review period (2023-2029).

and India Accounts Receivable & Accounts Payable Automation Market

and India Accounts Receivable & Accounts Payable Automation Market

Accounts Receivable Automation (AR Automation) is the modernisation of accounts receivable processes through automated, electronic systems to reduce repetitive and time-consuming tasks.
Accounts Payable Automation (AP Automation) refers to technology that is used to streamline and automate accounts payable processes, removing manual tasks and providing better visibility and control over important financial data.
In India, the Accounts Receivable & Accounts Payable Automation revenue is expected to grow from US$ million in 2022 to US$ million by 2029, at a CAGR of % during the forecast period 2023-2029.
Global Accounts Receivable & Accounts Payable Automation key players include Sage, AvidXchange, Bill.com, etc. Global top three manufacturers hold a share about 20%.
Americas is the largest market, with a share about 50%, followed by Asia-Pacific and Europe, both have a share over 45 percent.
In terms of product, Cloud-based is the largest segment, with a share over 80%. And in terms of application, the largest application is SMEs, followed by Large Enterprises.
This report focuses on global and India Accounts Receivable & Accounts Payable Automation market, also covers the segmentation data of other regions in regional level and county level.
India is now the world’s most populous country. According to IMF (its July update to its World Economic Outlook), India’s GDP growth is projected at 6.1% in 2023, powered by domestic investment. First and foremost, the key factor in India's rapid economic growth is the huge supply and demand from a large population base. Demand and supply sides working in both directions to support India's economic stability.
India is a market full of opportunities, and the demand for Accounts Receivable & Accounts Payable Automation will continue to grow rapidly in the future.
Global Accounts Receivable & Accounts Payable Automation Scope and Market Size
Accounts Receivable & Accounts Payable Automation market is segmented in regional and country level, by players, by Type and by Application. Companies, stakeholders, and other participants in the global Accounts Receivable & Accounts Payable Automation market will be able to gain the upper hand as they use the report as a powerful resource. The segmental analysis focuses on revenue and forecast by Type and by Application for the period 2018-2029.
For India market, this report focuses on the Accounts Receivable & Accounts Payable Automation market size by players, by Type and by Application, for the period 2018-2029. The key players include the global and local players, which play important roles in India.

Scope of and India Accounts Receivable & Accounts Payable Automation Market Report

Report Metric Details
Report Name and India Accounts Receivable & Accounts Payable Automation Market
Forecasted market size in 2029 US$ 4939.7 million
CAGR 9.8%
Forecasted years 2023 - 2029
Segment by Type
  • Cloud-based
  • On-premises
Segment by Application
  • SMEs
  • Large Enterprises
By Region
  • North America (United States, Canada)
  • Europe (Germany, France, UK, Italy, Russia) Rest of Europe
  • Nordic Countries
  • Asia-Pacific (China, Japan, South Korea)
  • Southeast Asia (India, Australia)
  • Rest of Asia
  • Latin America (Mexico, Brazil)
  • Rest of Latin America
  • Middle East & Africa (Turkey, Saudi Arabia, UAE, Rest of MEA)
By Company SAP Ariba, Beanworks, Sage, Xero, Tipalti, Freshbooks, Stampli, MineralTree, AvidXchange, FinancialForce, Bill.com, PaySimple, BlueSnap (Armatic), Oracle, Nvoicepay, Esker, SutiSoft, Emburse (Chrome River), Zycus, FIS, Bottomline Technologies, Coupa Software, Comarch, Vanguard Systems, Procurify
Forecast units USD million in value
Report coverage Revenue and volume forecast, company share, competitive landscape, growth factors and trends

FAQ for this report

What is the and India Accounts Receivable & Accounts Payable Automation Market size in 2029?

Ans: The and India Accounts Receivable & Accounts Payable Automation Market size in 2029 will be US$ 4939.7 million.

What is the market share of major companies in and India Accounts Receivable & Accounts Payable Automation Market?

Ans: Global top three manufacturers hold a share about 20%.

What is the and India Accounts Receivable & Accounts Payable Automation Market share by type?

Ans: In terms of product, Cloud-based is the largest segment, with a share over 80%.

What is the and India Accounts Receivable & Accounts Payable Automation Market share by region?

Ans: According to IMF (its July update to its World Economic Outlook), India’s GDP growth is projected at 6.1% in 2023, powered by domestic investment.

Who are the main players in the and India Accounts Receivable & Accounts Payable Automation Market report?

Ans: The main players in the and India Accounts Receivable & Accounts Payable Automation Market are SAP Ariba, Beanworks, Sage, Xero, Tipalti, Freshbooks, Stampli, MineralTree, AvidXchange, FinancialForce, Bill.com, PaySimple, BlueSnap (Armatic), Oracle, Nvoicepay, Esker, SutiSoft, Emburse (Chrome River), Zycus, FIS, Bottomline Technologies, Coupa Software, Comarch, Vanguard Systems, Procurify

What are the Application segmentation covered in the and India Accounts Receivable & Accounts Payable Automation Market report?

Ans: The Applications covered in the and India Accounts Receivable & Accounts Payable Automation Market report are SMEs, Large Enterprises

What are the Type segmentation covered in the and India Accounts Receivable & Accounts Payable Automation Market report?

Ans: The Types covered in the and India Accounts Receivable & Accounts Payable Automation Market report are Cloud-based, On-premises

Recommended Reports

Finance Automation

Process Automation

Marketing Automation

1 Study Coverage
1.1 Accounts Receivable & Accounts Payable Automation Product Introduction
1.2 Global Accounts Receivable & Accounts Payable Automation Outlook 2018 VS 2022 VS 2029
1.2.1 Global Accounts Receivable & Accounts Payable Automation Market Size for the Year 2018-2029
1.2.2 India Accounts Receivable & Accounts Payable Automation Market Size for the Year 2018-2029
1.3 Accounts Receivable & Accounts Payable Automation Market Size, India VS Global, 2018 VS 2022 VS 2029
1.3.1 The Market Share of India Accounts Receivable & Accounts Payable Automation in Global, 2018 VS 2022 VS 2029
1.3.2 The Growth Rate of Accounts Receivable & Accounts Payable Automation Market Size, India VS Global, 2018 VS 2022 VS 2029
1.4 Accounts Receivable & Accounts Payable Automation Market Dynamics
1.4.1 Accounts Receivable & Accounts Payable Automation Industry Trends
1.4.2 Accounts Receivable & Accounts Payable Automation Market Drivers
1.4.3 Accounts Receivable & Accounts Payable Automation Market Challenges
1.4.4 Accounts Receivable & Accounts Payable Automation Market Restraints
1.5 Assumptions and Limitations
1.6 Study Objectives
1.7 Years Considered
2 Accounts Receivable & Accounts Payable Automation by Type
2.1 Accounts Receivable & Accounts Payable Automation Market Segment by Type
2.1.1 Cloud-based
2.1.2 On-premises
2.2 Global Accounts Receivable & Accounts Payable Automation Market Size by Type (2018, 2022 & 2029)
2.3 Global Accounts Receivable & Accounts Payable Automation Market Size by Type (2018-2029)
2.4 India Accounts Receivable & Accounts Payable Automation Market Size by Type (2018, 2022 & 2029)
2.5 India Accounts Receivable & Accounts Payable Automation Market Size by Type (2018-2029)
3 Accounts Receivable & Accounts Payable Automation by Application
3.1 Accounts Receivable & Accounts Payable Automation Market Segment by Application
3.1.1 SMEs
3.1.2 Large Enterprises
3.2 Global Accounts Receivable & Accounts Payable Automation Market Size by Application (2018, 2022 & 2029)
3.3 Global Accounts Receivable & Accounts Payable Automation Market Size by Application (2018-2029)
3.4 India Accounts Receivable & Accounts Payable Automation Market Size by Application (2018, 2022 & 2029)
3.5 India Accounts Receivable & Accounts Payable Automation Market Size by Application (2018-2029)
4 Global Accounts Receivable & Accounts Payable Automation Competitor Landscape by Company
4.1 Global Accounts Receivable & Accounts Payable Automation Market Size by Company
4.1.1 Global Key Companies of Accounts Receivable & Accounts Payable Automation, Ranked by Revenue (2022)
4.1.2 Global Accounts Receivable & Accounts Payable Automation Revenue by Player (2018-2023)
4.2 Global Accounts Receivable & Accounts Payable Automation Concentration Ratio (CR)
4.2.1 Accounts Receivable & Accounts Payable Automation Market Concentration Ratio (CR) (2018-2023)
4.2.2 Global Top 5 and Top 10 Largest Companies of Accounts Receivable & Accounts Payable Automation in 2022
4.2.3 Global Accounts Receivable & Accounts Payable Automation Market Share by Company Type (Tier 1, Tier 2, and Tier 3)
4.3 Global Key Players of Accounts Receivable & Accounts Payable Automation Head office and Area Served
4.4 Global Key Players of Accounts Receivable & Accounts Payable Automation, Product and Application
4.5 Global Key Players of Accounts Receivable & Accounts Payable Automation, Date of Enter into This Industry
4.6 Companies Mergers & Acquisitions, Expansion Plans
4.7 India Accounts Receivable & Accounts Payable Automation Market Size by Company
4.7.1 Key Players of Accounts Receivable & Accounts Payable Automation in India, Ranked by Revenue (2022)
4.7.2 India Accounts Receivable & Accounts Payable Automation Revenue by Players (2021, 2022 & 2023)
5 Global Accounts Receivable & Accounts Payable Automation Market Size by Region
5.1 Global Accounts Receivable & Accounts Payable Automation Market Size by Region: 2018 VS 2022 VS 2029
5.2 Global Accounts Receivable & Accounts Payable Automation Market Size by Region (2018-2029)
5.2.1 Global Accounts Receivable & Accounts Payable Automation Market Size by Region: 2018-2023
5.2.2 Global Accounts Receivable & Accounts Payable Automation Market Size by Region (2024-2029)
6 Americas
6.1 Americas Accounts Receivable & Accounts Payable Automation Market Size YoY Growth 2018-2029
6.2 Americas Accounts Receivable & Accounts Payable Automation Market Size by Type
6.2.1 Americas Accounts Receivable & Accounts Payable Automation Market Size by Type (2018-2023)
6.2.2 Americas Accounts Receivable & Accounts Payable Automation Market Size by Type (2024-2029)
6.2.3 Americas Accounts Receivable & Accounts Payable Automation Market Share by Type (2018-2029)
6.3 Americas Accounts Receivable & Accounts Payable Automation Market Size by Application
6.3.1 Americas Accounts Receivable & Accounts Payable Automation Market Size by Application (2018-2023)
6.3.2 Americas Accounts Receivable & Accounts Payable Automation Market Size by Application (2024-2029)
6.3.3 Americas Accounts Receivable & Accounts Payable Automation Market Share by Application (2018-2029)
6.4 Americas Accounts Receivable & Accounts Payable Automation Market Facts & Figures by Country (2018, 2022 & 2029)
6.4.1 United States
6.4.2 Canada
6.4.3 Mexico
6.4.4 Brazil
7 EMEA
7.1 EMEA Accounts Receivable & Accounts Payable Automation Market Size YoY Growth 2018-2029
7.2 EMEA Accounts Receivable & Accounts Payable Automation Market Size by Type
7.2.1 EMEA Accounts Receivable & Accounts Payable Automation Market Size by Type (2018-2023)
7.2.2 EMEA Accounts Receivable & Accounts Payable Automation Market Size by Type (2024-2029)
7.2.3 EMEA Accounts Receivable & Accounts Payable Automation Market Share by Type (2018-2029)
7.3 EMEA Accounts Receivable & Accounts Payable Automation Market Size by Application
7.3.1 EMEA Accounts Receivable & Accounts Payable Automation Market Size by Application (2018-2023)
7.3.2 EMEA Accounts Receivable & Accounts Payable Automation Market Size by Application (2024-2029)
7.3.3 EMEA Accounts Receivable & Accounts Payable Automation Market Share by Application (2018-2029)
7.4 EMEA Accounts Receivable & Accounts Payable Automation Market Facts & Figures by Country (2018, 2022 & 2029)
7.4.1 Europe
7.4.2 Middle East
7.4.3 Africa
8 China
8.1 China Accounts Receivable & Accounts Payable Automation Market Size YoY Growth 2018-2029
8.2 China Accounts Receivable & Accounts Payable Automation Market Size by Type
8.2.1 China Accounts Receivable & Accounts Payable Automation Market Size by Type (2018-2023)
8.2.2 China Accounts Receivable & Accounts Payable Automation Market Size by Type (2024-2029)
8.2.3 China Accounts Receivable & Accounts Payable Automation Market Share by Type (2018-2029)
8.3 China Accounts Receivable & Accounts Payable Automation Market Size by Application
8.3.1 China Accounts Receivable & Accounts Payable Automation Market Size by Application (2018-2023)
8.3.2 China Accounts Receivable & Accounts Payable Automation Market Size by Application (2024-2029)
8.3.3 China Accounts Receivable & Accounts Payable Automation Market Share by Application (2018-2029)
9 APAC (excluding China)
9.1 APAC Accounts Receivable & Accounts Payable Automation Market Size YoY Growth 2018-2029
9.2 APAC Accounts Receivable & Accounts Payable Automation Market Size by Type
9.2.1 APAC Accounts Receivable & Accounts Payable Automation Market Size by Type (2018-2023)
9.2.2 APAC Accounts Receivable & Accounts Payable Automation Market Size by Type (2024-2029)
9.2.3 APAC Accounts Receivable & Accounts Payable Automation Market Share by Type (2018-2029)
9.3 APAC Accounts Receivable & Accounts Payable Automation Market Size by Application
9.3.1 APAC Accounts Receivable & Accounts Payable Automation Market Size by Application (2018-2023)
9.3.2 APAC Accounts Receivable & Accounts Payable Automation Market Size by Application (2024-2029)
9.3.3 APAC Accounts Receivable & Accounts Payable Automation Market Share by Application (2018-2029)
9.4 APAC Accounts Receivable & Accounts Payable Automation Market Facts & Figures by Country (2018, 2022 & 2029)
9.4.1 Japan
9.4.2 South Korea
9.4.3 China Taiwan
9.4.4 Southeast Asia
9.4.5 India
10 Key Players Profiles
10.1 SAP Ariba
10.1.1 SAP Ariba Company Details
10.1.2 SAP Ariba Business Overview
10.1.3 SAP Ariba Accounts Receivable & Accounts Payable Automation Introduction
10.1.4 SAP Ariba Revenue in Accounts Receivable & Accounts Payable Automation Business (2018-2023)
10.1.5 SAP Ariba Recent Development
10.2 Beanworks
10.2.1 Beanworks Company Details
10.2.2 Beanworks Business Overview
10.2.3 Beanworks Accounts Receivable & Accounts Payable Automation Introduction
10.2.4 Beanworks Revenue in Accounts Receivable & Accounts Payable Automation Business (2018-2023)
10.2.5 Beanworks Recent Development
10.3 Sage
10.3.1 Sage Company Details
10.3.2 Sage Business Overview
10.3.3 Sage Accounts Receivable & Accounts Payable Automation Introduction
10.3.4 Sage Revenue in Accounts Receivable & Accounts Payable Automation Business (2018-2023)
10.3.5 Sage Recent Development
10.4 Xero
10.4.1 Xero Company Details
10.4.2 Xero Business Overview
10.4.3 Xero Accounts Receivable & Accounts Payable Automation Introduction
10.4.4 Xero Revenue in Accounts Receivable & Accounts Payable Automation Business (2018-2023)
10.4.5 Xero Recent Development
10.5 Tipalti
10.5.1 Tipalti Company Details
10.5.2 Tipalti Business Overview
10.5.3 Tipalti Accounts Receivable & Accounts Payable Automation Introduction
10.5.4 Tipalti Revenue in Accounts Receivable & Accounts Payable Automation Business (2018-2023)
10.5.5 Tipalti Recent Development
10.6 Freshbooks
10.6.1 Freshbooks Company Details
10.6.2 Freshbooks Business Overview
10.6.3 Freshbooks Accounts Receivable & Accounts Payable Automation Introduction
10.6.4 Freshbooks Revenue in Accounts Receivable & Accounts Payable Automation Business (2018-2023)
10.6.5 Freshbooks Recent Development
10.7 Stampli
10.7.1 Stampli Company Details
10.7.2 Stampli Business Overview
10.7.3 Stampli Accounts Receivable & Accounts Payable Automation Introduction
10.7.4 Stampli Revenue in Accounts Receivable & Accounts Payable Automation Business (2018-2023)
10.7.5 Stampli Recent Development
10.8 MineralTree
10.8.1 MineralTree Company Details
10.8.2 MineralTree Business Overview
10.8.3 MineralTree Accounts Receivable & Accounts Payable Automation Introduction
10.8.4 MineralTree Revenue in Accounts Receivable & Accounts Payable Automation Business (2018-2023)
10.8.5 MineralTree Recent Development
10.9 AvidXchange
10.9.1 AvidXchange Company Details
10.9.2 AvidXchange Business Overview
10.9.3 AvidXchange Accounts Receivable & Accounts Payable Automation Introduction
10.9.4 AvidXchange Revenue in Accounts Receivable & Accounts Payable Automation Business (2018-2023)
10.9.5 AvidXchange Recent Development
10.10 FinancialForce
10.10.1 FinancialForce Company Details
10.10.2 FinancialForce Business Overview
10.10.3 FinancialForce Accounts Receivable & Accounts Payable Automation Introduction
10.10.4 FinancialForce Revenue in Accounts Receivable & Accounts Payable Automation Business (2018-2023)
10.10.5 FinancialForce Recent Development
10.11 Bill.com
10.11.1 Bill.com Company Details
10.11.2 Bill.com Business Overview
10.11.3 Bill.com Accounts Receivable & Accounts Payable Automation Introduction
10.11.4 Bill.com Revenue in Accounts Receivable & Accounts Payable Automation Business (2018-2023)
10.11.5 Bill.com Recent Development
10.12 PaySimple
10.12.1 PaySimple Company Details
10.12.2 PaySimple Business Overview
10.12.3 PaySimple Accounts Receivable & Accounts Payable Automation Introduction
10.12.4 PaySimple Revenue in Accounts Receivable & Accounts Payable Automation Business (2018-2023)
10.12.5 PaySimple Recent Development
10.13 BlueSnap (Armatic)
10.13.1 BlueSnap (Armatic) Company Details
10.13.2 BlueSnap (Armatic) Business Overview
10.13.3 BlueSnap (Armatic) Accounts Receivable & Accounts Payable Automation Introduction
10.13.4 BlueSnap (Armatic) Revenue in Accounts Receivable & Accounts Payable Automation Business (2018-2023)
10.13.5 BlueSnap (Armatic) Recent Development
10.14 Oracle
10.14.1 Oracle Company Details
10.14.2 Oracle Business Overview
10.14.3 Oracle Accounts Receivable & Accounts Payable Automation Introduction
10.14.4 Oracle Revenue in Accounts Receivable & Accounts Payable Automation Business (2018-2023)
10.14.5 Oracle Recent Development
10.15 Nvoicepay
10.15.1 Nvoicepay Company Details
10.15.2 Nvoicepay Business Overview
10.15.3 Nvoicepay Accounts Receivable & Accounts Payable Automation Introduction
10.15.4 Nvoicepay Revenue in Accounts Receivable & Accounts Payable Automation Business (2018-2023)
10.15.5 Nvoicepay Recent Development
10.16 Esker
10.16.1 Esker Company Details
10.16.2 Esker Business Overview
10.16.3 Esker Accounts Receivable & Accounts Payable Automation Introduction
10.16.4 Esker Revenue in Accounts Receivable & Accounts Payable Automation Business (2018-2023)
10.16.5 Esker Recent Development
10.17 SutiSoft
10.17.1 SutiSoft Company Details
10.17.2 SutiSoft Business Overview
10.17.3 SutiSoft Accounts Receivable & Accounts Payable Automation Introduction
10.17.4 SutiSoft Revenue in Accounts Receivable & Accounts Payable Automation Business (2018-2023)
10.17.5 SutiSoft Recent Development
10.18 Emburse (Chrome River)
10.18.1 Emburse (Chrome River) Company Details
10.18.2 Emburse (Chrome River) Business Overview
10.18.3 Emburse (Chrome River) Accounts Receivable & Accounts Payable Automation Introduction
10.18.4 Emburse (Chrome River) Revenue in Accounts Receivable & Accounts Payable Automation Business (2018-2023)
10.18.5 Emburse (Chrome River) Recent Development
10.19 Zycus
10.19.1 Zycus Company Details
10.19.2 Zycus Business Overview
10.19.3 Zycus Accounts Receivable & Accounts Payable Automation Introduction
10.19.4 Zycus Revenue in Accounts Receivable & Accounts Payable Automation Business (2018-2023)
10.19.5 Zycus Recent Development
10.20 FIS
10.20.1 FIS Company Details
10.20.2 FIS Business Overview
10.20.3 FIS Accounts Receivable & Accounts Payable Automation Introduction
10.20.4 FIS Revenue in Accounts Receivable & Accounts Payable Automation Business (2018-2023)
10.20.5 FIS Recent Development
10.21 Bottomline Technologies
10.21.1 Bottomline Technologies Company Details
10.21.2 Bottomline Technologies Business Overview
10.21.3 Bottomline Technologies Accounts Receivable & Accounts Payable Automation Introduction
10.21.4 Bottomline Technologies Revenue in Accounts Receivable & Accounts Payable Automation Business (2018-2023)
10.21.5 Bottomline Technologies Recent Development
10.22 Coupa Software
10.22.1 Coupa Software Company Details
10.22.2 Coupa Software Business Overview
10.22.3 Coupa Software Accounts Receivable & Accounts Payable Automation Introduction
10.22.4 Coupa Software Revenue in Accounts Receivable & Accounts Payable Automation Business (2018-2023)
10.22.5 Coupa Software Recent Development
10.23 Comarch
10.23.1 Comarch Company Details
10.23.2 Comarch Business Overview
10.23.3 Comarch Accounts Receivable & Accounts Payable Automation Introduction
10.23.4 Comarch Revenue in Accounts Receivable & Accounts Payable Automation Business (2018-2023)
10.23.5 Comarch Recent Development
10.24 Vanguard Systems
10.24.1 Vanguard Systems Company Details
10.24.2 Vanguard Systems Business Overview
10.24.3 Vanguard Systems Accounts Receivable & Accounts Payable Automation Introduction
10.24.4 Vanguard Systems Revenue in Accounts Receivable & Accounts Payable Automation Business (2018-2023)
10.24.5 Vanguard Systems Recent Development
10.25 Procurify
10.25.1 Procurify Company Details
10.25.2 Procurify Business Overview
10.25.3 Procurify Accounts Receivable & Accounts Payable Automation Introduction
10.25.4 Procurify Revenue in Accounts Receivable & Accounts Payable Automation Business (2018-2023)
10.25.5 Procurify Recent Development
11 Research Findings and Conclusion
12 Appendix
12.1 Research Methodology
12.1.1 Methodology/Research Approach
12.1.2 Data Source
12.2 Disclaimer
12.3 Author Details
List of Tables
    Table 1. Accounts Receivable & Accounts Payable Automation Market Size India VS Global, CAGR (2018 VS 2022 VS 2029)
    Table 2. Accounts Receivable & Accounts Payable Automation Market Trends
    Table 3. Accounts Receivable & Accounts Payable Automation Market Drivers
    Table 4. Accounts Receivable & Accounts Payable Automation Market Challenges
    Table 5. Accounts Receivable & Accounts Payable Automation Market Restraints
    Table 6. Global Accounts Receivable & Accounts Payable Automation Market Size by Type: 2018 VS 2022 VS 2029 (US$ Million)
    Table 7. India Accounts Receivable & Accounts Payable Automation Market Size by Type: 2018 VS 2022 VS 2029 (US$ Million)
    Table 8. Global Accounts Receivable & Accounts Payable Automation Market Size by Application: 2018 VS 2022 VS 2029 (US$ Million)
    Table 9. India Accounts Receivable & Accounts Payable Automation Market Size by Application: 2018 VS 2022 VS 2029 (US$ Million)
    Table 10. Global Key Companies of Accounts Receivable & Accounts Payable Automation, Ranked by Revenue (2022) & (US$ Million)
    Table 11. Global Accounts Receivable & Accounts Payable Automation Revenue by Player, (US$ Million), 2018-2023
    Table 12. Global Accounts Receivable & Accounts Payable Automation Revenue Share by Player, 2018-2023
    Table 13. Global Accounts Receivable & Accounts Payable Automation Companies Market Concentration Ratio (CR5 and HHI)
    Table 14. Global Accounts Receivable & Accounts Payable Automation by Company Type (Tier 1, Tier 2, and Tier 3) & (based on the Revenue in Accounts Receivable & Accounts Payable Automation as of 2022)
    Table 15. Global Key Players of Accounts Receivable & Accounts Payable Automation, Headquarters and Area Served
    Table 16. Global Key Players of Accounts Receivable & Accounts Payable Automation, Product and Application
    Table 17. Global Key Players of Accounts Receivable & Accounts Payable Automation, Date of Enter into This Industry
    Table 18. Companies Mergers & Acquisitions, Expansion Plans
    Table 19. Key Players of Accounts Receivable & Accounts Payable Automation in India, Ranked by Revenue (2022) & (US$ Million)
    Table 20. India Accounts Receivable & Accounts Payable Automation Revenue by Players, (US$ Million), 2021, 2022 & 2023
    Table 21. India Accounts Receivable & Accounts Payable Automation Revenue Share by Players, 2021, 2022 & 2023
    Table 22. Global Accounts Receivable & Accounts Payable Automation Market Size Growth Rate (CAGR) by Region (US$ Million): 2018 VS 2022 VS 2029
    Table 23. Global Accounts Receivable & Accounts Payable Automation Market Size by Region (2018-2023) & (US$ Million)
    Table 24. Global Accounts Receivable & Accounts Payable Automation Market Size Forecast by Region (2024-2029) & (US$ Million)
    Table 25. Americas Accounts Receivable & Accounts Payable Automation Market Size by Type (2018-2023) & (US$ Million)
    Table 26. Americas Accounts Receivable & Accounts Payable Automation Market Size by Type (2024-2029) & (US$ Million)
    Table 27. Americas Accounts Receivable & Accounts Payable Automation Market Size by Application (2018-2023) & (US$ Million)
    Table 28. Americas Accounts Receivable & Accounts Payable Automation Market Size by Application (2024-2029) & (US$ Million)
    Table 29. Americas Accounts Receivable & Accounts Payable Automation Market Size Growth Rate (CAGR) by Country (US$ Million): 2018 VS 2022 VS 2029
    Table 30. Americas Accounts Receivable & Accounts Payable Automation Market Size by Country (2018-2023) & (US$ Million)
    Table 31. Americas Accounts Receivable & Accounts Payable Automation Market Size by Country (2024-2029) & (US$ Million)
    Table 32. EMEA Accounts Receivable & Accounts Payable Automation Market Size by Type (2018-2023) & (US$ Million)
    Table 33. EMEA Accounts Receivable & Accounts Payable Automation Market Size by Type (2024-2029) & (US$ Million)
    Table 34. EMEA Accounts Receivable & Accounts Payable Automation Market Size by Application (2018-2023) & (US$ Million)
    Table 35. EMEA Accounts Receivable & Accounts Payable Automation Market Size by Application (2024-2029) & (US$ Million)
    Table 36. EMEA Accounts Receivable & Accounts Payable Automation Market Size Growth Rate (CAGR) by Country (US$ Million): 2018 VS 2022 VS 2029
    Table 37. EMEA Accounts Receivable & Accounts Payable Automation Market Size by Country (2018-2023) & (US$ Million)
    Table 38. EMEA Accounts Receivable & Accounts Payable Automation Market Size by Country (2024-2029) & (US$ Million)
    Table 39. China Accounts Receivable & Accounts Payable Automation Market Size by Type (2018-2023) & (US$ Million)
    Table 40. China Accounts Receivable & Accounts Payable Automation Market Size by Type (2024-2029) & (US$ Million)
    Table 41. China Accounts Receivable & Accounts Payable Automation Market Size by Application (2018-2023) & (US$ Million)
    Table 42. China Accounts Receivable & Accounts Payable Automation Market Size by Application (2024-2029) & (US$ Million)
    Table 43. China Accounts Receivable & Accounts Payable Automation Market Size Growth Rate (CAGR) by Country (US$ Million): 2018 VS 2022 VS 2029
    Table 44. APAC Accounts Receivable & Accounts Payable Automation Market Size by Type (2018-2023) & (US$ Million)
    Table 45. APAC Accounts Receivable & Accounts Payable Automation Market Size by Type (2024-2029) & (US$ Million)
    Table 46. APAC Accounts Receivable & Accounts Payable Automation Market Size by Application (2018-2023) & (US$ Million)
    Table 47. APAC Accounts Receivable & Accounts Payable Automation Market Size by Application (2024-2029) & (US$ Million)
    Table 48. APAC Accounts Receivable & Accounts Payable Automation Market Size Growth Rate (CAGR) by Country (US$ Million): 2018 VS 2022 VS 2029
    Table 49. APAC Accounts Receivable & Accounts Payable Automation Market Size by Region (2018-2023) & (US$ Million)
    Table 50. APAC Accounts Receivable & Accounts Payable Automation Market Size by Region (2024-2029) & (US$ Million)
    Table 51. SAP Ariba Company Details
    Table 52. SAP Ariba Business Overview
    Table 53. SAP Ariba Accounts Receivable & Accounts Payable Automation Product
    Table 54. SAP Ariba Revenue in Accounts Receivable & Accounts Payable Automation Business (2018-2023) & (US$ Million)
    Table 55. SAP Ariba Recent Development
    Table 56. Beanworks Company Details
    Table 57. Beanworks Business Overview
    Table 58. Beanworks Accounts Receivable & Accounts Payable Automation Product
    Table 59. Beanworks Revenue in Accounts Receivable & Accounts Payable Automation Business (2018-2023) & (US$ Million)
    Table 60. Beanworks Recent Development
    Table 61. Sage Company Details
    Table 62. Sage Business Overview
    Table 63. Sage Accounts Receivable & Accounts Payable Automation Product
    Table 64. Sage Revenue in Accounts Receivable & Accounts Payable Automation Business (2018-2023) & (US$ Million)
    Table 65. Sage Recent Development
    Table 66. Xero Company Details
    Table 67. Xero Business Overview
    Table 68. Xero Accounts Receivable & Accounts Payable Automation Product
    Table 69. Xero Revenue in Accounts Receivable & Accounts Payable Automation Business (2018-2023) & (US$ Million)
    Table 70. Xero Recent Development
    Table 71. Tipalti Company Details
    Table 72. Tipalti Business Overview
    Table 73. Tipalti Accounts Receivable & Accounts Payable Automation Product
    Table 74. Tipalti Revenue in Accounts Receivable & Accounts Payable Automation Business (2018-2023) & (US$ Million)
    Table 75. Tipalti Recent Development
    Table 76. Freshbooks Company Details
    Table 77. Freshbooks Business Overview
    Table 78. Freshbooks Accounts Receivable & Accounts Payable Automation Product
    Table 79. Freshbooks Revenue in Accounts Receivable & Accounts Payable Automation Business (2018-2023) & (US$ Million)
    Table 80. Freshbooks Recent Development
    Table 81. Stampli Company Details
    Table 82. Stampli Business Overview
    Table 83. Stampli Accounts Receivable & Accounts Payable Automation Product
    Table 84. Stampli Revenue in Accounts Receivable & Accounts Payable Automation Business (2018-2023) & (US$ Million)
    Table 85. Stampli Recent Development
    Table 86. MineralTree Company Details
    Table 87. MineralTree Business Overview
    Table 88. MineralTree Accounts Receivable & Accounts Payable Automation Product
    Table 89. MineralTree Revenue in Accounts Receivable & Accounts Payable Automation Business (2018-2023) & (US$ Million)
    Table 90. MineralTree Recent Development
    Table 91. AvidXchange Company Details
    Table 92. AvidXchange Business Overview
    Table 93. AvidXchange Accounts Receivable & Accounts Payable Automation Product
    Table 94. AvidXchange Revenue in Accounts Receivable & Accounts Payable Automation Business (2018-2023) & (US$ Million)
    Table 95. AvidXchange Recent Development
    Table 96. FinancialForce Company Details
    Table 97. FinancialForce Business Overview
    Table 98. FinancialForce Accounts Receivable & Accounts Payable Automation Product
    Table 99. FinancialForce Revenue in Accounts Receivable & Accounts Payable Automation Business (2018-2023) & (US$ Million)
    Table 100. FinancialForce Recent Development
    Table 101. Bill.com Company Details
    Table 102. Bill.com Business Overview
    Table 103. Bill.com Accounts Receivable & Accounts Payable Automation Product
    Table 104. Bill.com Revenue in Accounts Receivable & Accounts Payable Automation Business (2018-2023) & (US$ Million)
    Table 105. Bill.com Recent Development
    Table 106. PaySimple Company Details
    Table 107. PaySimple Business Overview
    Table 108. PaySimple Accounts Receivable & Accounts Payable Automation Product
    Table 109. PaySimple Revenue in Accounts Receivable & Accounts Payable Automation Business (2018-2023) & (US$ Million)
    Table 110. PaySimple Recent Development
    Table 111. BlueSnap (Armatic) Company Details
    Table 112. BlueSnap (Armatic) Business Overview
    Table 113. BlueSnap (Armatic) Accounts Receivable & Accounts Payable Automation Product
    Table 114. BlueSnap (Armatic) Revenue in Accounts Receivable & Accounts Payable Automation Business (2018-2023) & (US$ Million)
    Table 115. BlueSnap (Armatic) Recent Development
    Table 116. Oracle Company Details
    Table 117. Oracle Business Overview
    Table 118. Oracle Accounts Receivable & Accounts Payable Automation Product
    Table 119. Oracle Revenue in Accounts Receivable & Accounts Payable Automation Business (2018-2023) & (US$ Million)
    Table 120. Oracle Recent Development
    Table 121. Nvoicepay Company Details
    Table 122. Nvoicepay Business Overview
    Table 123. Nvoicepay Accounts Receivable & Accounts Payable Automation Product
    Table 124. Nvoicepay Revenue in Accounts Receivable & Accounts Payable Automation Business (2018-2023) & (US$ Million)
    Table 125. Nvoicepay Recent Development
    Table 126. Esker Company Details
    Table 127. Esker Business Overview
    Table 128. Esker Accounts Receivable & Accounts Payable Automation Product
    Table 129. Esker Revenue in Accounts Receivable & Accounts Payable Automation Business (2018-2023) & (US$ Million)
    Table 130. Esker Recent Development
    Table 131. SutiSoft Company Details
    Table 132. SutiSoft Business Overview
    Table 133. SutiSoft Accounts Receivable & Accounts Payable Automation Product
    Table 134. SutiSoft Revenue in Accounts Receivable & Accounts Payable Automation Business (2018-2023) & (US$ Million)
    Table 135. SutiSoft Recent Development
    Table 136. Emburse (Chrome River) Company Details
    Table 137. Emburse (Chrome River) Business Overview
    Table 138. Emburse (Chrome River) Accounts Receivable & Accounts Payable Automation Product
    Table 139. Emburse (Chrome River) Revenue in Accounts Receivable & Accounts Payable Automation Business (2018-2023) & (US$ Million)
    Table 140. Emburse (Chrome River) Recent Development
    Table 141. Zycus Company Details
    Table 142. Zycus Business Overview
    Table 143. Zycus Accounts Receivable & Accounts Payable Automation Product
    Table 144. Zycus Revenue in Accounts Receivable & Accounts Payable Automation Business (2018-2023) & (US$ Million)
    Table 145. Zycus Recent Development
    Table 146. FIS Company Details
    Table 147. FIS Business Overview
    Table 148. FIS Accounts Receivable & Accounts Payable Automation Product
    Table 149. FIS Revenue in Accounts Receivable & Accounts Payable Automation Business (2018-2023) & (US$ Million)
    Table 150. FIS Recent Development
    Table 151. Bottomline Technologies Company Details
    Table 152. Bottomline Technologies Business Overview
    Table 153. Bottomline Technologies Accounts Receivable & Accounts Payable Automation Product
    Table 154. Bottomline Technologies Revenue in Accounts Receivable & Accounts Payable Automation Business (2018-2023) & (US$ Million)
    Table 155. Bottomline Technologies Recent Development
    Table 156. Coupa Software Company Details
    Table 157. Coupa Software Business Overview
    Table 158. Coupa Software Accounts Receivable & Accounts Payable Automation Product
    Table 159. Coupa Software Revenue in Accounts Receivable & Accounts Payable Automation Business (2018-2023) & (US$ Million)
    Table 160. Coupa Software Recent Development
    Table 161. Comarch Company Details
    Table 162. Comarch Business Overview
    Table 163. Comarch Accounts Receivable & Accounts Payable Automation Product
    Table 164. Comarch Revenue in Accounts Receivable & Accounts Payable Automation Business (2018-2023) & (US$ Million)
    Table 165. Comarch Recent Development
    Table 166. Vanguard Systems Company Details
    Table 167. Vanguard Systems Business Overview
    Table 168. Vanguard Systems Accounts Receivable & Accounts Payable Automation Product
    Table 169. Vanguard Systems Revenue in Accounts Receivable & Accounts Payable Automation Business (2018-2023) & (US$ Million)
    Table 170. Vanguard Systems Recent Development
    Table 171. Procurify Company Details
    Table 172. Procurify Business Overview
    Table 173. Procurify Accounts Receivable & Accounts Payable Automation Product
    Table 174. Procurify Revenue in Accounts Receivable & Accounts Payable Automation Business (2018-2023) & (US$ Million)
    Table 175. Procurify Recent Development
    Table 176. Research Programs/Design for This Report
    Table 177. Key Data Information from Secondary Sources
    Table 178. Key Data Information from Primary Sources
List of Figures
    Figure 1. Accounts Receivable & Accounts Payable Automation Product Picture
    Figure 2. Global Accounts Receivable & Accounts Payable Automation Market Size, (US$ Million), 2018 VS 2022 VS 2029
    Figure 3. Global Accounts Receivable & Accounts Payable Automation Market Size 2018-2029 (US$ Million)
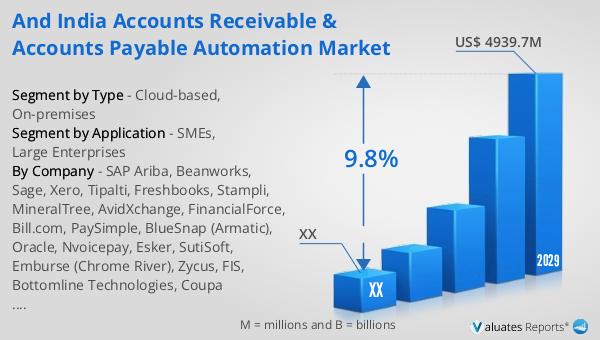
    Figure 4. India Accounts Receivable & Accounts Payable Automation Market Size, (US$ Million), 2018 VS 2022 VS 2029
    Figure 5. India Accounts Receivable & Accounts Payable Automation Market Size 2018-2029 (US$ Million)
    Figure 6. India Accounts Receivable & Accounts Payable Automation Market Share in Global 2018-2029
    Figure 7. Accounts Receivable & Accounts Payable Automation Report Years Considered
    Figure 8. Product Picture of Cloud-based
    Figure 9. Product Picture of On-premises
    Figure 10. Global Accounts Receivable & Accounts Payable Automation Market Share by Type in 2022 & 2029
    Figure 11. Global Accounts Receivable & Accounts Payable Automation Market Size by Type (2018-2029) & (US$ Million)
    Figure 12. Global Accounts Receivable & Accounts Payable Automation Market Share by Type (2018-2029)
    Figure 13. India Accounts Receivable & Accounts Payable Automation Market Share by Type in 2022 & 2029
    Figure 14. India Accounts Receivable & Accounts Payable Automation Market Size by Type (2018-2029) & (US$ Million)
    Figure 15. India Accounts Receivable & Accounts Payable Automation Market Share by Type (2018-2029)
    Figure 16. Product Picture of SMEs
    Figure 17. Product Picture of Large Enterprises
    Figure 18. Global Accounts Receivable & Accounts Payable Automation Market Share by Application in 2022 & 2029
    Figure 19. Global Accounts Receivable & Accounts Payable Automation Market Size by Application (2018-2029) & (US$ Million)
    Figure 20. Global Accounts Receivable & Accounts Payable Automation Market Share by Application (2018-2029)
    Figure 21. India Accounts Receivable & Accounts Payable Automation Market Share by Application in 2022 & 2029
    Figure 22. India Accounts Receivable & Accounts Payable Automation Market Size by Application (2018-2029) & (US$ Million)
    Figure 23. India Accounts Receivable & Accounts Payable Automation Market Share by Application (2018-2029)
    Figure 24. The Top 5 and 10 Largest Companies of Accounts Receivable & Accounts Payable Automation in the World: Market Share by Accounts Receivable & Accounts Payable Automation Revenue in 2022
    Figure 25. Global Accounts Receivable & Accounts Payable Automation Market Size Market Share by Region: 2018 VS 2022 VS 2029
    Figure 26. Global Accounts Receivable & Accounts Payable Automation Market Share by Region (2018-2029)
    Figure 27. Americas Accounts Receivable & Accounts Payable Automation Market Size Growth Rate 2018-2029 (US$ Million)
    Figure 28. Americas Accounts Receivable & Accounts Payable Automation Market Share by Type (2018-2029)
    Figure 29. Americas Accounts Receivable & Accounts Payable Automation Market Share by Application (2018-2029)
    Figure 30. United States Accounts Receivable & Accounts Payable Automation Market Size Growth Rate (2018-2029) & (US$ Million)
    Figure 31. Canada Accounts Receivable & Accounts Payable Automation Market Size Growth Rate (2018-2029) & (US$ Million)
    Figure 32. Mexico Accounts Receivable & Accounts Payable Automation Market Size Growth Rate (2018-2029) & (US$ Million)
    Figure 33. Brazil Accounts Receivable & Accounts Payable Automation Market Size Growth Rate (2018-2029) & (US$ Million)
    Figure 34. EMEA Accounts Receivable & Accounts Payable Automation Market Size Growth Rate 2018-2029 (US$ Million)
    Figure 35. EMEA Accounts Receivable & Accounts Payable Automation Market Share by Type (2018-2029)
    Figure 36. EMEA Accounts Receivable & Accounts Payable Automation Market Share by Application (2018-2029)
    Figure 37. Europe Accounts Receivable & Accounts Payable Automation Market Size Growth Rate (2018-2029) & (US$ Million)
    Figure 38. Middle East Accounts Receivable & Accounts Payable Automation Market Size Growth Rate (2018-2029) & (US$ Million)
    Figure 39. Africa Accounts Receivable & Accounts Payable Automation Market Size Growth Rate (2018-2029) & (US$ Million)
    Figure 40. China Accounts Receivable & Accounts Payable Automation Market Size Growth Rate 2018-2029 (US$ Million)
    Figure 41. China Accounts Receivable & Accounts Payable Automation Market Share by Type (2018-2029)
    Figure 42. China Accounts Receivable & Accounts Payable Automation Market Share by Application (2018-2029)
    Figure 43. APAC Accounts Receivable & Accounts Payable Automation Market Size Growth Rate 2018-2029 (US$ Million)
    Figure 44. APAC Accounts Receivable & Accounts Payable Automation Market Share by Type (2018-2029)
    Figure 45. APAC Accounts Receivable & Accounts Payable Automation Market Share by Application (2018-2029)
    Figure 46. Japan Accounts Receivable & Accounts Payable Automation Market Size Growth Rate (2018-2029) & (US$ Million)
    Figure 47. South Korea Accounts Receivable & Accounts Payable Automation Market Size Growth Rate (2018-2029) & (US$ Million)
    Figure 48. China Taiwan Accounts Receivable & Accounts Payable Automation Market Size Growth Rate (2018-2029) & (US$ Million)
    Figure 49. Southeast Asia Accounts Receivable & Accounts Payable Automation Market Size Growth Rate (2018-2029) & (US$ Million)
    Figure 50. India Accounts Receivable & Accounts Payable Automation Market Size Growth Rate (2018-2029) & (US$ Million)
    Figure 51. SAP Ariba Revenue Growth Rate in Accounts Receivable & Accounts Payable Automation Business (2018-2023)
    Figure 52. Beanworks Revenue Growth Rate in Accounts Receivable & Accounts Payable Automation Business (2018-2023)
    Figure 53. Sage Revenue Growth Rate in Accounts Receivable & Accounts Payable Automation Business (2018-2023)
    Figure 54. Xero Revenue Growth Rate in Accounts Receivable & Accounts Payable Automation Business (2018-2023)
    Figure 55. Tipalti Revenue Growth Rate in Accounts Receivable & Accounts Payable Automation Business (2018-2023)
    Figure 56. Freshbooks Revenue Growth Rate in Accounts Receivable & Accounts Payable Automation Business (2018-2023)
    Figure 57. Stampli Revenue Growth Rate in Accounts Receivable & Accounts Payable Automation Business (2018-2023)
    Figure 58. MineralTree Revenue Growth Rate in Accounts Receivable & Accounts Payable Automation Business (2018-2023)
    Figure 59. AvidXchange Revenue Growth Rate in Accounts Receivable & Accounts Payable Automation Business (2018-2023)
    Figure 60. FinancialForce Revenue Growth Rate in Accounts Receivable & Accounts Payable Automation Business (2018-2023)
    Figure 61. Bill.com Revenue Growth Rate in Accounts Receivable & Accounts Payable Automation Business (2018-2023)
    Figure 62. PaySimple Revenue Growth Rate in Accounts Receivable & Accounts Payable Automation Business (2018-2023)
    Figure 63. BlueSnap (Armatic) Revenue Growth Rate in Accounts Receivable & Accounts Payable Automation Business (2018-2023)
    Figure 64. Oracle Revenue Growth Rate in Accounts Receivable & Accounts Payable Automation Business (2018-2023)
    Figure 65. Nvoicepay Revenue Growth Rate in Accounts Receivable & Accounts Payable Automation Business (2018-2023)
    Figure 66. Esker Revenue Growth Rate in Accounts Receivable & Accounts Payable Automation Business (2018-2023)
    Figure 67. SutiSoft Revenue Growth Rate in Accounts Receivable & Accounts Payable Automation Business (2018-2023)
    Figure 68. Emburse (Chrome River) Revenue Growth Rate in Accounts Receivable & Accounts Payable Automation Business (2018-2023)
    Figure 69. Zycus Revenue Growth Rate in Accounts Receivable & Accounts Payable Automation Business (2018-2023)
    Figure 70. FIS Revenue Growth Rate in Accounts Receivable & Accounts Payable Automation Business (2018-2023)
    Figure 71. Bottomline Technologies Revenue Growth Rate in Accounts Receivable & Accounts Payable Automation Business (2018-2023)
    Figure 72. Coupa Software Revenue Growth Rate in Accounts Receivable & Accounts Payable Automation Business (2018-2023)
    Figure 73. Comarch Revenue Growth Rate in Accounts Receivable & Accounts Payable Automation Business (2018-2023)
    Figure 74. Vanguard Systems Revenue Growth Rate in Accounts Receivable & Accounts Payable Automation Business (2018-2023)
    Figure 75. Procurify Revenue Growth Rate in Accounts Receivable & Accounts Payable Automation Business (2018-2023)
    Figure 76. Bottom-up and Top-down Approaches for This Report
    Figure 77. Data Triangulation
    Figure 78. Key Executives Interviewed
SELECT A FORMAT
Added to Cart
Electronic (PDF)

$4350

This license allows only one user to access the PDF.
Electronic (PDF)

$6525

This license allows 1 - 5 user to access the PDF, license is suitable for small groups of 5 users working together
Electronic (PDF)

$8700

This license allows users/teams in a same Enterprise to use this report, various departments within an enterpise can use this report
Add to Cart
Buy Now (15% Discount)

OUR CUSTOMER

Leap India

SIMILAR REPORTS