FEATURED COMPANIES
Sony
Canon Inc
GalaxyCore
OmniVision
SAMSUNG
SK Hynix
Panasonic
Backside-illuminated (BSI) CMOS Sensor Market Size
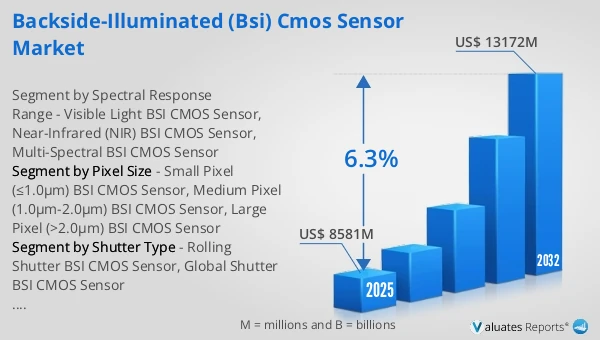
The global Backside-illuminated (BSI) CMOS Sensor market was valued at US$ 8581 million in 2025 and is anticipated to reach US$ 13172 million by 2032, at a CAGR of 6.3% from 2026 to 2032.
Backside-illuminated (BSI) CMOS Sensor Market
The 2025 U.S. tariff policies introduce profound uncertainty into the global economic landscape. This report critically examines the implications of recent tariff adjustments and international strategic countermeasures on Backside-illuminated (BSI) CMOS Sensor competitive dynamics, regional economic interdependencies, and supply chain reconfigurations.
In 2025, global Backside-illuminated (BSI) CMOS Sensor production reached approximately 2,681.5 M units, with an average global market price of around 3,200 USD/K units.
Backside-illuminated (BSI) CMOS Sensor is an advanced image sensor optimized for light utilization, upgraded from front-illuminated (FI) technology. It reverses the traditional sensor structure, removing the metal wiring and circuit layer from the light-receiving side—light directly irradiates the back of the photodiode after passing through microlenses and color filters, eliminating light blocking and reflection caused by front-side circuits. This design significantly improves light sensitivity (up to 90%+ light utilization), enhances low-light imaging performance and signal-to-noise ratio, while supporting smaller pixel sizes without compromising image quality. It follows the same classification dimensions as FI sensors (by pixel size, shutter type, spectral response range) but with structural advantages that make it suitable for high-end imaging scenarios, though its manufacturing process is more complex and cost higher than FI sensors.
The demand for BSI CMOS Sensors is driven by the upgrading of high-end imaging scenarios across industries, such as flagship consumer electronics, professional security monitoring, and high-precision medical imaging, with small and medium pixel models dominating consumer markets and large pixel models in professional fields. The booming demand for automotive imaging (ADAS, in-cabin monitoring) and industrial machine vision also boosts consumption of BSI sensors with global shutter and NIR capabilities. Business opportunities lie in optimizing small pixel (≤1.0μm) technology for flagship smartphones to balance resolution and low-light performance, developing large pixel (>2.0μm) models for professional medical and security equipment, upgrading global/electronic global shutter BSI sensors for industrial automation, and expanding multi-spectral and NIR BSI solutions to meet emerging smart mobility and IoT high-end imaging needs, while reducing production costs through process iteration to penetrate mid-range markets.
This report delivers a comprehensive overview of the global Backside-illuminated (BSI) CMOS Sensor market, with both quantitative and qualitative analyses, to help readers develop growth strategies, assess the competitive landscape, evaluate their position in the current market, and make informed business decisions regarding Backside-illuminated (BSI) CMOS Sensor. The Backside-illuminated (BSI) CMOS Sensor market size, estimates, and forecasts are provided in terms of output/shipments (Million Units) and revenue (US$ millions), with 2025 as the base year and historical and forecast data for 2021–2032.
The report segments the global Backside-illuminated (BSI) CMOS Sensor market comprehensively. Regional market sizes by Pixel Size, by Application, by Shutter Type, and by company are also provided. For deeper insight, the report profiles the competitive landscape, key competitors, and their respective market rankings, and discusses technological trends and new product developments.
This report will assist Backside-illuminated (BSI) CMOS Sensor manufacturers, new entrants, and companies across the industry value chain with information on revenues, production, and average prices for the overall market and its sub-segments, by company, by Pixel Size, by Application, and by region.
Market Segmentation
Scope of Backside-illuminated (BSI) CMOS Sensor Market Report
| Report Metric |
Details |
| Report Name |
Backside-illuminated (BSI) CMOS Sensor Market |
| Accounted market size in 2025 |
US$ 8581 million |
| Forecasted market size in 2032 |
US$ 13172 million |
| CAGR |
6.3% |
| Base Year |
2025 |
| Forecasted years |
2026 - 2032 |
| Segment by Pixel Size |
- Small Pixel (≤1.0μm) BSI CMOS Sensor
- Medium Pixel (1.0μm-2.0μm) BSI CMOS Sensor
- Large Pixel (>2.0μm) BSI CMOS Sensor
|
| Segment by Shutter Type |
- Rolling Shutter BSI CMOS Sensor
- Global Shutter BSI CMOS Sensor
|
| Segment by Spectral Response Range |
- Visible Light BSI CMOS Sensor
- Near-Infrared (NIR) BSI CMOS Sensor
- Multi-Spectral BSI CMOS Sensor
|
| by Application |
- Consumer Electronics
- Industrial Automation
- Security Monitoring
- Medical Imaging
- Others
|
| Production by Region |
- North America
- Europe
- China
- Japan
- South Korea
|
| Consumption by Region |
- North America (United States, Canada)
- Europe (Germany, France, UK, Italy, Russia)
- Asia-Pacific (China, Japan, South Korea, Taiwan)
- Southeast Asia (India)
- Latin America (Mexico, Brazil)
|
| By Company |
SONY, Samsung, OmniVision, STMicroelectronics, Onsemi, SK Hynix, GalaxyCore, Panasonic, SmartSens Technology, Canon, Silicon Optronics |
| Forecast units |
USD million in value |
| Report coverage |
Revenue and volume forecast, company share, competitive landscape, growth factors and trends |
Chapter Outline
- Chapter 1: Defines the scope of the report and presents an executive summary of market segments (by Pixel Size, by Application, by Shutter Type, etc.), including the size of each segment and its future growth potential. It offers a high-level view of the current market and its likely evolution in the short, medium, and long term.
- Chapter 2: Provides a detailed analysis of the competitive landscape for Backside-illuminated (BSI) CMOS Sensor manufacturers, including prices, production, value-based market shares, latest development plans, and information on mergers and acquisitions.
- Chapter 3: Examines Backside-illuminated (BSI) CMOS Sensor production/output and value by region and country, providing a quantitative assessment of market size and growth potential for each region over the next six years.
- Chapter 4: Analyzes Backside-illuminated (BSI) CMOS Sensor consumption at the regional and country levels. It quantifies market size and growth potential for each region and its key countries, and outlines market development, outlook, addressable space, and national production.
- Chapter 5: Analyzes market segments by Pixel Size, covering the size and growth potential of each segment to help readers identify “blue ocean” opportunities.
- Chapter 6: Analyzes market segments by Application, covering the size and growth potential of each segment to help readers identify “blue ocean” opportunities in downstream markets.
- Chapter 7: Profiles key players, detailing the fundamentals of major companies, including product production/output, value, price, gross margin, product portfolio/introductions, and recent developments.
- Chapter 8: Reviews the industry value chain, including upstream and downstream segments.
- Chapter 9: Discusses market dynamics and recent developments, including drivers, restraints, challenges and risks for manufacturers, U.S. Tariffs and relevant policy analysis.
- Chapter 10: Summarizes the key findings and conclusions of the report.
FAQ for this report
How fast is Backside-illuminated (BSI) CMOS Sensor Market growing?
Ans: The Backside-illuminated (BSI) CMOS Sensor Market witnessing a CAGR of 6.3% during the forecast period 2026-2032.
What is the Backside-illuminated (BSI) CMOS Sensor Market size in 2032?
Ans: The Backside-illuminated (BSI) CMOS Sensor Market size in 2032 will be US$ 13172 million.
Who are the main players in the Backside-illuminated (BSI) CMOS Sensor Market report?
Ans: The main players in the Backside-illuminated (BSI) CMOS Sensor Market are SONY, Samsung, OmniVision, STMicroelectronics, Onsemi, SK Hynix, GalaxyCore, Panasonic, SmartSens Technology, Canon, Silicon Optronics
What are the Application segmentation covered in the Backside-illuminated (BSI) CMOS Sensor Market report?
Ans: The Applications covered in the Backside-illuminated (BSI) CMOS Sensor Market report are Consumer Electronics, Industrial Automation, Security Monitoring, Medical Imaging, Others
What are the Type segmentation covered in the Backside-illuminated (BSI) CMOS Sensor Market report?
Ans: The Types covered in the Backside-illuminated (BSI) CMOS Sensor Market report are Rolling Shutter BSI CMOS Sensor, Global Shutter BSI CMOS Sensor

