FEATURED COMPANIES
Sony
Canon Inc
GalaxyCore
OmniVision
SAMSUNG
SK Hynix
Panasonic
Front-illuminated (FI) CMOS Sensor Market Size
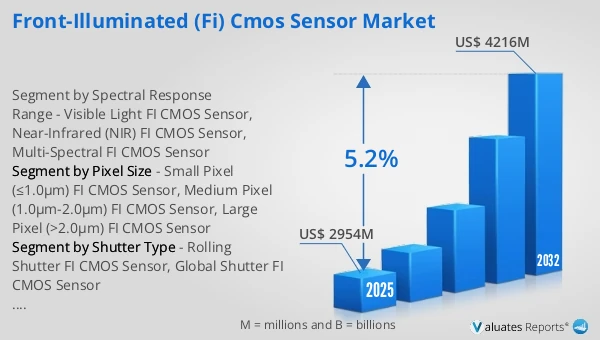
The global Front-illuminated (FI) CMOS Sensor market was valued at US$ 2954 million in 2025 and is anticipated to reach US$ 4216 million by 2032, at a CAGR of 5.2% from 2026 to 2032.
Front-illuminated (FI) CMOS Sensor Market
The 2025 U.S. tariff policies introduce profound uncertainty into the global economic landscape. This report critically examines the implications of recent tariff adjustments and international strategic countermeasures on Front-illuminated (FI) CMOS Sensor competitive dynamics, regional economic interdependencies, and supply chain reconfigurations.
In 2025, global Front-illuminated (FI) CMOS Sensor production reached approximately 1,640.9 M units, with an average global market price of around 1,800 USD/K units.
Front-illuminated (FI) CMOS Sensor, also known as Front-side Illuminated (FSI) CMOS Sensor, is a classic type of image sensor that converts light signals into electrical signals for digital imaging. It adopts a "top-down" structural design where light passes through microlenses and color filters sequentially, then penetrates the metal wiring and circuit layer on the front before reaching the underlying photodiodes—the core photosensitive component. As the foundational technology of CMOS sensors, it features simple manufacturing processes, high yield rates, and low production costs, though the front metal circuit layer may block and reflect part of the light, resulting in relatively limited light utilization (around 70%) and inferior low-light performance compared to back-illuminated (BSI) sensors. It is widely used in scenarios with moderate imaging requirements and cost sensitivity.
The demand for FI CMOS Sensors is driven by the steady growth of cost-sensitive application fields such as entry-level consumer electronics, IoT devices, and basic security monitoring, as well as the stable demand for global shutter architectures in industrial automation and machine vision. The medical field also contributes incremental demand for certified FI sensors that meet clinical standards. Business opportunities lie in optimizing manufacturing processes to enhance light sensitivity and reduce noise while maintaining cost advantages, expanding applications in emerging low-power IoT and entry-level automotive imaging scenarios, leveraging its cost-effectiveness to occupy the mass-market share, and developing customized products for industrial machine vision that prioritize global shutter performance over extreme low-light capability.
This report delivers a comprehensive overview of the global Front-illuminated (FI) CMOS Sensor market, with both quantitative and qualitative analyses, to help readers develop growth strategies, assess the competitive landscape, evaluate their position in the current market, and make informed business decisions regarding Front-illuminated (FI) CMOS Sensor. The Front-illuminated (FI) CMOS Sensor market size, estimates, and forecasts are provided in terms of output/shipments (Million Units) and revenue (US$ millions), with 2025 as the base year and historical and forecast data for 2021–2032.
The report segments the global Front-illuminated (FI) CMOS Sensor market comprehensively. Regional market sizes by Pixel Size, by Application, by Shutter Type, and by company are also provided. For deeper insight, the report profiles the competitive landscape, key competitors, and their respective market rankings, and discusses technological trends and new product developments.
This report will assist Front-illuminated (FI) CMOS Sensor manufacturers, new entrants, and companies across the industry value chain with information on revenues, production, and average prices for the overall market and its sub-segments, by company, by Pixel Size, by Application, and by region.
Market Segmentation
Scope of Front-illuminated (FI) CMOS Sensor Market Report
| Report Metric |
Details |
| Report Name |
Front-illuminated (FI) CMOS Sensor Market |
| Accounted market size in 2025 |
US$ 2954 million |
| Forecasted market size in 2032 |
US$ 4216 million |
| CAGR |
5.2% |
| Base Year |
2025 |
| Forecasted years |
2026 - 2032 |
| Segment by Pixel Size |
- Small Pixel (≤1.0μm) FI CMOS Sensor
- Medium Pixel (1.0μm-2.0μm) FI CMOS Sensor
- Large Pixel (>2.0μm) FI CMOS Sensor
|
| Segment by Shutter Type |
- Rolling Shutter FI CMOS Sensor
- Global Shutter FI CMOS Sensor
|
| Segment by Spectral Response Range |
- Visible Light FI CMOS Sensor
- Near-Infrared (NIR) FI CMOS Sensor
- Multi-Spectral FI CMOS Sensor
|
| by Application |
- Consumer Electronics
- Industrial Automation
- Security Monitoring
- Medical Imaging
- Others
|
| Production by Region |
- North America
- Europe
- China
- Japan
- South Korea
|
| Consumption by Region |
- North America (United States, Canada)
- Europe (Germany, France, UK, Italy, Russia)
- Asia-Pacific (China, Japan, South Korea, Taiwan)
- Southeast Asia (India)
- Latin America (Mexico, Brazil)
|
| By Company |
SONY, Samsung, OmniVision, STMicroelectronics, Onsemi, SK Hynix, GalaxyCore, Panasonic, SmartSens Technology, Canon, Silicon Optronics |
| Forecast units |
USD million in value |
| Report coverage |
Revenue and volume forecast, company share, competitive landscape, growth factors and trends |
Chapter Outline
- Chapter 1: Defines the scope of the report and presents an executive summary of market segments (by Pixel Size, by Application, by Shutter Type, etc.), including the size of each segment and its future growth potential. It offers a high-level view of the current market and its likely evolution in the short, medium, and long term.
- Chapter 2: Provides a detailed analysis of the competitive landscape for Front-illuminated (FI) CMOS Sensor manufacturers, including prices, production, value-based market shares, latest development plans, and information on mergers and acquisitions.
- Chapter 3: Examines Front-illuminated (FI) CMOS Sensor production/output and value by region and country, providing a quantitative assessment of market size and growth potential for each region over the next six years.
- Chapter 4: Analyzes Front-illuminated (FI) CMOS Sensor consumption at the regional and country levels. It quantifies market size and growth potential for each region and its key countries, and outlines market development, outlook, addressable space, and national production.
- Chapter 5: Analyzes market segments by Pixel Size, covering the size and growth potential of each segment to help readers identify “blue ocean” opportunities.
- Chapter 6: Analyzes market segments by Application, covering the size and growth potential of each segment to help readers identify “blue ocean” opportunities in downstream markets.
- Chapter 7: Profiles key players, detailing the fundamentals of major companies, including product production/output, value, price, gross margin, product portfolio/introductions, and recent developments.
- Chapter 8: Reviews the industry value chain, including upstream and downstream segments.
- Chapter 9: Discusses market dynamics and recent developments, including drivers, restraints, challenges and risks for manufacturers, U.S. Tariffs and relevant policy analysis.
- Chapter 10: Summarizes the key findings and conclusions of the report.
FAQ for this report
How fast is Front-illuminated (FI) CMOS Sensor Market growing?
Ans: The Front-illuminated (FI) CMOS Sensor Market witnessing a CAGR of 5.2% during the forecast period 2026-2032.
What is the Front-illuminated (FI) CMOS Sensor Market size in 2032?
Ans: The Front-illuminated (FI) CMOS Sensor Market size in 2032 will be US$ 4216 million.
Who are the main players in the Front-illuminated (FI) CMOS Sensor Market report?
Ans: The main players in the Front-illuminated (FI) CMOS Sensor Market are SONY, Samsung, OmniVision, STMicroelectronics, Onsemi, SK Hynix, GalaxyCore, Panasonic, SmartSens Technology, Canon, Silicon Optronics
What are the Application segmentation covered in the Front-illuminated (FI) CMOS Sensor Market report?
Ans: The Applications covered in the Front-illuminated (FI) CMOS Sensor Market report are Consumer Electronics, Industrial Automation, Security Monitoring, Medical Imaging, Others
What are the Type segmentation covered in the Front-illuminated (FI) CMOS Sensor Market report?
Ans: The Types covered in the Front-illuminated (FI) CMOS Sensor Market report are Rolling Shutter FI CMOS Sensor, Global Shutter FI CMOS Sensor

