0
U.S. (TOLL FREE)
+1 (315) 215-3225
Automative

0
U.S. (TOLL FREE)
+1 (315) 215-3225
Global Cement Boards Market Outlook 2022
Published Date: December 2021
|
Report Code: QYRE-Auto-17S9024
Home | Market Reports | Business & Industrial| Construction & Maintenance| Building Materials & Supplies
Global Cement Boards Market Outlook 2022
BUY CHAPTERS

Global Cement Boards Market Outlook 2022

Code: QYRE-Auto-17S9024
Report
December 2021
Pages:133
QYResearch
Buy Now with 15% Discount
DESCRIPTION
TABLE OF CONTENT
TABLES & FIGURES

Cement Boards Market Outlook - 2028

The global Cement Boards market was valued at US$ 12550 million in 2020 and it is expected to reach US$ 17770 million by the end of 2027, growing at a CAGR of 5.1% during 2021-2027.

Cement Boards Market

Cement Boards

Cement boards are made of mixtures of cement, water and either reinforcing fibres or particles. The resulting mix is formed into sheets or continuous mats, stacked (and/or pressed), dried and trimmed to size.

Cement Boards Market Size and share

Global Cement Boards key players include James Hardie, Etex Group, etc. Global top two manufacturers hold a share over 20%.

Europe is the largest market, with a share over 30%, followed by China and North America, both have a share over 40 percent.

In terms of product, Fibre Cement Board is the largest segment, with a share over 45%. And in terms of application, the largest application is Commercial Buildings, followed by Residential Buildings, etc.

Cement Boards Market Drivers and Restrains

The research report has incorporated the analysis of different factors that augment the market’s growth. It constitutes trends, restraints, and drivers that transform the market in either a positive or negative manner. This section also provides the scope of different segments and applications that can potentially influence the market in the future. The detailed information is based on current trends and historic milestones. This section also provides an analysis of the volume of production about the global market and about each type from 2016 to 2027. This section mentions the volume of production by region from 2016 to 2027. Pricing analysis is included in the report according to each type from the year 2016 to 2027, manufacturer from 2016 to 2021, region from 2016 to 2021, and global price from 2016 to 2027.

A thorough evaluation of the restrains included in the report portrays the contrast to drivers and gives room for strategic planning. Factors that overshadow the market growth are pivotal as they can be understood to devise different bends for getting hold of the lucrative opportunities that are present in the ever-growing market. Additionally, insights into market expert’s opinions have been taken to understand the market better.

Cement Boards Market Segment Analysis

The research report includes specific segments by region (country), by manufacturers, by Type and by Application. Each type provides information about the production during the forecast period of 2016 to 2027. by Application segment also provides consumption during the forecast period of 2016 to 2027. Understanding the segments helps in identifying the importance of different factors that aid the market growth.

Cement Boards Market Segment By Type

Fiber Cement Board
Cement Bonded Particle Board
Wood Based Cement Board
Others

Cement Boards Market Segment By Application

  • Commercial Buildings
  • Residential Buildings
  • Other

By Company

  • James Hardie
  • Etex Group
  • Cembrit
  • Mahaphant
  • Elementia
  • Everest Industries
  • Saint-Gobain
  • Hume Cemboard Industries
  • Taisyou
  • Soben board
  • SCG Building Materials
  • Kmew
  • PENNY PANEL
  • Nichiha
  • Lato JSC
  • FRAMECAD
  • LTM LLC
  • TEPE Betopan
  • HEKIM YAPI
  • Atermit
  • GAF
  • China Conch Venture holdings
  • HeaderBoard Building Materials
  • Sanle Group
  • Guangdong Soben Green

Production by Region

  • North America
  • Europe
  • China
  • Japan
  • India
  • Australia

Consumption by Region

  • North America
  • U.S.
  • Canada
  • Europe
  • Germany
  • France
  • U.K.
  • Italy
  • Russia
  • Asia-Pacific
  • China
  • Japan
  • South Korea
  • India
  • Australia
  • Taiwan
  • Indonesia
  • Thailand
  • Malaysia
  • Philippines
  • Vietnam
  • Latin America
  • Mexico
  • Brazil
  • Argentina
  • Middle East & Africa
  • Turkey
  • Saudi Arabia
  • U.A.E
1 Cement Boards Market Overview
1.1 Product Overview and Scope of Cement Boards
1.2 Cement Boards Segment by Type
1.2.1 Global Cement Boards Market Size Growth Rate Analysis by Type 2021 VS 2027
1.2.2 Fiber Cement Board
1.2.3 Cement Bonded Particle Board
1.2.4 Wood Based Cement Board
1.2.5 Others
1.3 Cement Boards Segment by Application
1.3.1 Global Cement Boards Consumption Comparison by Application: 2016 VS 2021 VS 2027
1.3.2 Commercial Buildings
1.3.3 Residential Buildings
1.3.4 Other
1.4 Global Market Growth Prospects
1.4.1 Global Cement Boards Revenue Estimates and Forecasts (2016-2027)
1.4.2 Global Cement Boards Production Capacity Estimates and Forecasts (2016-2027)
1.4.3 Global Cement Boards Production Estimates and Forecasts (2016-2027)
1.5 Global Market Size by Region
1.5.1 Global Cement Boards Market Size Estimates and Forecasts by Region: 2016 VS 2021 VS 2027
1.5.2 North America Cement Boards Estimates and Forecasts (2016-2027)
1.5.3 Europe Cement Boards Estimates and Forecasts (2016-2027)
1.5.4 China Cement Boards Estimates and Forecasts (2016-2027)
1.5.5 Japan Cement Boards Estimates and Forecasts (2016-2027)
1.5.6 India Cement Boards Estimates and Forecasts (2016-2027)
1.5.7 Australia Cement Boards Estimates and Forecasts (2016-2027)
1.5.8 Southeast Asia Cement Boards Estimates and Forecasts (2016-2027)
2 Market Competition by Manufacturers
2.1 Global Cement Boards Production Capacity Market Share by Manufacturers (2016-2021)
2.2 Global Cement Boards Revenue Market Share by Manufacturers (2016-2021)
2.3 Cement Boards Market Share by Company Type (Tier 1, Tier 2 and Tier 3)
2.4 Global Cement Boards Average Price by Manufacturers (2016-2021)
2.5 Manufacturers Cement Boards Production Sites, Area Served, Product Types
2.6 Cement Boards Market Competitive Situation and Trends
2.6.1 Cement Boards Market Concentration Rate
2.6.2 Global 5 and 10 Largest Cement Boards Players Market Share by Revenue
2.6.3 Mergers & Acquisitions, Expansion
3 Production and Capacity by Region
3.1 Global Production Capacity of Cement Boards Market Share by Region (2016-2021)
3.2 Global Cement Boards Revenue Market Share by Region (2016-2021)
3.3 Global Cement Boards Production Capacity, Revenue, Price and Gross Margin (2016-2021)
3.4 North America Cement Boards Production
3.4.1 North America Cement Boards Production Growth Rate (2016-2021)
3.4.2 North America Cement Boards Production Capacity, Revenue, Price and Gross Margin (2016-2021)
3.5 Europe Cement Boards Production
3.5.1 Europe Cement Boards Production Growth Rate (2016-2021)
3.5.2 Europe Cement Boards Production Capacity, Revenue, Price and Gross Margin (2016-2021)
3.6 China Cement Boards Production
3.6.1 China Cement Boards Production Growth Rate (2016-2021)
3.6.2 China Cement Boards Production Capacity, Revenue, Price and Gross Margin (2016-2021)
3.7 Japan Cement Boards Production
3.7.1 Japan Cement Boards Production Growth Rate (2016-2021)
3.7.2 Japan Cement Boards Production Capacity, Revenue, Price and Gross Margin (2016-2021)
3.8 India Cement Boards Production
3.8.1 India Cement Boards Production Growth Rate (2016-2021)
3.8.2 India Cement Boards Production Capacity, Revenue, Price and Gross Margin (2016-2021)
3.9 Australia Cement Boards Production
3.9.1 Australia Cement Boards Production Growth Rate (2016-2021)
3.9.2 Australia Cement Boards Production Capacity, Revenue, Price and Gross Margin (2016-2021)
3.10 Southeast Asia Cement Boards Production
3.10.1 Southeast Asia Cement Boards Production Growth Rate (2016-2021)
3.10.2 Southeast Asia Cement Boards Production Capacity, Revenue, Price and Gross Margin (2016-2021)
4 Global Cement Boards Consumption by Region
4.1 Global Cement Boards Consumption by Region
4.1.1 Global Cement Boards Consumption by Region
4.1.2 Global Cement Boards Consumption Market Share by Region
4.2 North America
4.2.1 North America Cement Boards Consumption by Country
4.2.2 U.S.
4.2.3 Canada
4.3 Europe
4.3.1 Europe Cement Boards Consumption by Country
4.3.2 Germany
4.3.3 France
4.3.4 U.K.
4.3.5 Italy
4.3.6 Russia
4.4 Asia Pacific
4.4.1 Asia Pacific Cement Boards Consumption by Region
4.4.2 China
4.4.3 Japan
4.4.4 South Korea
4.4.5 Taiwan
4.4.6 Southeast Asia
4.4.7 India
4.4.8 Australia
4.5 Latin America
4.5.1 Latin America Cement Boards Consumption by Country
4.5.2 Mexico
4.5.3 Brazil
5 Production, Revenue, Price Trend by Type
5.1 Global Cement Boards Production Market Share by Type (2016-2021)
5.2 Global Cement Boards Revenue Market Share by Type (2016-2021)
5.3 Global Cement Boards Price by Type (2016-2021)
6 Consumption Analysis by Application
6.1 Global Cement Boards Consumption Market Share by Application (2016-2021)
6.2 Global Cement Boards Consumption Growth Rate by Application (2016-2021)
7 Key Companies Profiled
7.1 James Hardie
7.1.1 James Hardie Cement Boards Corporation Information
7.1.2 James Hardie Cement Boards Product Portfolio
7.1.3 James Hardie Cement Boards Production Capacity, Revenue, Price and Gross Margin (2016-2021)
7.1.4 James Hardie Main Business and Markets Served
7.1.5 James Hardie Recent Developments/Updates
7.2 Etex Group
7.2.1 Etex Group Cement Boards Corporation Information
7.2.2 Etex Group Cement Boards Product Portfolio
7.2.3 Etex Group Cement Boards Production Capacity, Revenue, Price and Gross Margin (2016-2021)
7.2.4 Etex Group Main Business and Markets Served
7.2.5 Etex Group Recent Developments/Updates
7.3 Cembrit
7.3.1 Cembrit Cement Boards Corporation Information
7.3.2 Cembrit Cement Boards Product Portfolio
7.3.3 Cembrit Cement Boards Production Capacity, Revenue, Price and Gross Margin (2016-2021)
7.3.4 Cembrit Main Business and Markets Served
7.3.5 Cembrit Recent Developments/Updates
7.4 Mahaphant
7.4.1 Mahaphant Cement Boards Corporation Information
7.4.2 Mahaphant Cement Boards Product Portfolio
7.4.3 Mahaphant Cement Boards Production Capacity, Revenue, Price and Gross Margin (2016-2021)
7.4.4 Mahaphant Main Business and Markets Served
7.4.5 Mahaphant Recent Developments/Updates
7.5 Elementia
7.5.1 Elementia Cement Boards Corporation Information
7.5.2 Elementia Cement Boards Product Portfolio
7.5.3 Elementia Cement Boards Production Capacity, Revenue, Price and Gross Margin (2016-2021)
7.5.4 Elementia Main Business and Markets Served
7.5.5 Elementia Recent Developments/Updates
7.6 Everest Industries
7.6.1 Everest Industries Cement Boards Corporation Information
7.6.2 Everest Industries Cement Boards Product Portfolio
7.6.3 Everest Industries Cement Boards Production Capacity, Revenue, Price and Gross Margin (2016-2021)
7.6.4 Everest Industries Main Business and Markets Served
7.6.5 Everest Industries Recent Developments/Updates
7.7 Saint-Gobain
7.7.1 Saint-Gobain Cement Boards Corporation Information
7.7.2 Saint-Gobain Cement Boards Product Portfolio
7.7.3 Saint-Gobain Cement Boards Production Capacity, Revenue, Price and Gross Margin (2016-2021)
7.7.4 Saint-Gobain Main Business and Markets Served
7.7.5 Saint-Gobain Recent Developments/Updates
7.8 Hume Cemboard Industries
7.8.1 Hume Cemboard Industries Cement Boards Corporation Information
7.8.2 Hume Cemboard Industries Cement Boards Product Portfolio
7.8.3 Hume Cemboard Industries Cement Boards Production Capacity, Revenue, Price and Gross Margin (2016-2021)
7.8.4 Hume Cemboard Industries Main Business and Markets Served
7.7.5 Hume Cemboard Industries Recent Developments/Updates
7.9 Taisyou
7.9.1 Taisyou Cement Boards Corporation Information
7.9.2 Taisyou Cement Boards Product Portfolio
7.9.3 Taisyou Cement Boards Production Capacity, Revenue, Price and Gross Margin (2016-2021)
7.9.4 Taisyou Main Business and Markets Served
7.9.5 Taisyou Recent Developments/Updates
7.10 Soben board
7.10.1 Soben board Cement Boards Corporation Information
7.10.2 Soben board Cement Boards Product Portfolio
7.10.3 Soben board Cement Boards Production Capacity, Revenue, Price and Gross Margin (2016-2021)
7.10.4 Soben board Main Business and Markets Served
7.10.5 Soben board Recent Developments/Updates
7.11 SCG Building Materials
7.11.1 SCG Building Materials Cement Boards Corporation Information
7.11.2 SCG Building Materials Cement Boards Product Portfolio
7.11.3 SCG Building Materials Cement Boards Production Capacity, Revenue, Price and Gross Margin (2016-2021)
7.11.4 SCG Building Materials Main Business and Markets Served
7.11.5 SCG Building Materials Recent Developments/Updates
7.12 Kmew
7.12.1 Kmew Cement Boards Corporation Information
7.12.2 Kmew Cement Boards Product Portfolio
7.12.3 Kmew Cement Boards Production Capacity, Revenue, Price and Gross Margin (2016-2021)
7.12.4 Kmew Main Business and Markets Served
7.12.5 Kmew Recent Developments/Updates
7.13 PENNY PANEL
7.13.1 PENNY PANEL Cement Boards Corporation Information
7.13.2 PENNY PANEL Cement Boards Product Portfolio
7.13.3 PENNY PANEL Cement Boards Production Capacity, Revenue, Price and Gross Margin (2016-2021)
7.13.4 PENNY PANEL Main Business and Markets Served
7.13.5 PENNY PANEL Recent Developments/Updates
7.14 Nichiha
7.14.1 Nichiha Cement Boards Corporation Information
7.14.2 Nichiha Cement Boards Product Portfolio
7.14.3 Nichiha Cement Boards Production Capacity, Revenue, Price and Gross Margin (2016-2021)
7.14.4 Nichiha Main Business and Markets Served
7.14.5 Nichiha Recent Developments/Updates
7.15 Lato JSC
7.15.1 Lato JSC Cement Boards Corporation Information
7.15.2 Lato JSC Cement Boards Product Portfolio
7.15.3 Lato JSC Cement Boards Production Capacity, Revenue, Price and Gross Margin (2016-2021)
7.15.4 Lato JSC Main Business and Markets Served
7.15.5 Lato JSC Recent Developments/Updates
7.16 FRAMECAD
7.16.1 FRAMECAD Cement Boards Corporation Information
7.16.2 FRAMECAD Cement Boards Product Portfolio
7.16.3 FRAMECAD Cement Boards Production Capacity, Revenue, Price and Gross Margin (2016-2021)
7.16.4 FRAMECAD Main Business and Markets Served
7.16.5 FRAMECAD Recent Developments/Updates
7.17 LTM LLC
7.17.1 LTM LLC Cement Boards Corporation Information
7.17.2 LTM LLC Cement Boards Product Portfolio
7.17.3 LTM LLC Cement Boards Production Capacity, Revenue, Price and Gross Margin (2016-2021)
7.17.4 LTM LLC Main Business and Markets Served
7.17.5 LTM LLC Recent Developments/Updates
7.18 TEPE Betopan
7.18.1 TEPE Betopan Cement Boards Corporation Information
7.18.2 TEPE Betopan Cement Boards Product Portfolio
7.18.3 TEPE Betopan Cement Boards Production Capacity, Revenue, Price and Gross Margin (2016-2021)
7.18.4 TEPE Betopan Main Business and Markets Served
7.18.5 TEPE Betopan Recent Developments/Updates
7.19 HEKIM YAPI
7.19.1 HEKIM YAPI Cement Boards Corporation Information
7.19.2 HEKIM YAPI Cement Boards Product Portfolio
7.19.3 HEKIM YAPI Cement Boards Production Capacity, Revenue, Price and Gross Margin (2016-2021)
7.19.4 HEKIM YAPI Main Business and Markets Served
7.19.5 HEKIM YAPI Recent Developments/Updates
7.20 Atermit
7.20.1 Atermit Cement Boards Corporation Information
7.20.2 Atermit Cement Boards Product Portfolio
7.20.3 Atermit Cement Boards Production Capacity, Revenue, Price and Gross Margin (2016-2021)
7.20.4 Atermit Main Business and Markets Served
7.20.5 Atermit Recent Developments/Updates
7.21 GAF
7.21.1 GAF Cement Boards Corporation Information
7.21.2 GAF Cement Boards Product Portfolio
7.21.3 GAF Cement Boards Production Capacity, Revenue, Price and Gross Margin (2016-2021)
7.21.4 GAF Main Business and Markets Served
7.21.5 GAF Recent Developments/Updates
7.22 China Conch Venture holdings
7.22.1 China Conch Venture holdings Cement Boards Corporation Information
7.22.2 China Conch Venture holdings Cement Boards Product Portfolio
7.22.3 China Conch Venture holdings Cement Boards Production Capacity, Revenue, Price and Gross Margin (2016-2021)
7.22.4 China Conch Venture holdings Main Business and Markets Served
7.22.5 China Conch Venture holdings Recent Developments/Updates
7.23 HeaderBoard Building Materials
7.23.1 HeaderBoard Building Materials Cement Boards Corporation Information
7.23.2 HeaderBoard Building Materials Cement Boards Product Portfolio
7.23.3 HeaderBoard Building Materials Cement Boards Production Capacity, Revenue, Price and Gross Margin (2016-2021)
7.23.4 HeaderBoard Building Materials Main Business and Markets Served
7.23.5 HeaderBoard Building Materials Recent Developments/Updates
7.24 Sanle Group
7.24.1 Sanle Group Cement Boards Corporation Information
7.24.2 Sanle Group Cement Boards Product Portfolio
7.24.3 Sanle Group Cement Boards Production Capacity, Revenue, Price and Gross Margin (2016-2021)
7.24.4 Sanle Group Main Business and Markets Served
7.24.5 Sanle Group Recent Developments/Updates
7.25 Guangdong Soben Green
7.25.1 Guangdong Soben Green Cement Boards Corporation Information
7.25.2 Guangdong Soben Green Cement Boards Product Portfolio
7.25.3 Guangdong Soben Green Cement Boards Production Capacity, Revenue, Price and Gross Margin (2016-2021)
7.25.4 Guangdong Soben Green Main Business and Markets Served
7.25.5 Guangdong Soben Green Recent Developments/Updates
8 Cement Boards Manufacturing Cost Analysis
8.1 Cement Boards Key Raw Materials Analysis
8.1.1 Key Raw Materials
8.1.2 Key Raw Materials Price Trend
8.1.3 Key Suppliers of Raw Materials
8.2 Proportion of Manufacturing Cost Structure
8.3 Manufacturing Process Analysis of Cement Boards
8.4 Cement Boards Industrial Chain Analysis
9 Marketing Channel, Distributors and Customers
9.1 Marketing Channel
9.2 Cement Boards Distributors List
9.3 Cement Boards Customers
10 Market Dynamics
10.1 Cement Boards Industry Trends
10.2 Cement Boards Growth Drivers
10.3 Cement Boards Market Challenges
10.4 Cement Boards Market Restraints
11 Production and Supply Forecast
11.1 Global Forecasted Production of Cement Boards by Region (2022-2027)
11.2 North America Cement Boards Production, Revenue Forecast (2022-2027)
11.3 Europe Cement Boards Production, Revenue Forecast (2022-2027)
11.4 China Cement Boards Production, Revenue Forecast (2022-2027)
11.5 Japan Cement Boards Production, Revenue Forecast (2022-2027)
11.6 India Cement Boards Production, Revenue Forecast (2022-2027)
11.7 Australia Cement Boards Production, Revenue Forecast (2022-2027)
11.8 Southeast Asia Cement Boards Production, Revenue Forecast (2022-2027)
12 Consumption and Demand Forecast
12.1 Global Forecasted Demand Analysis of Cement Boards
12.2 North America Forecasted Consumption of Cement Boards by Country
12.3 Europe Market Forecasted Consumption of Cement Boards by Country
12.4 Asia Pacific Market Forecasted Consumption of Cement Boards by Region
12.5 Latin America Forecasted Consumption of Cement Boards by Country
13 Forecast by Type and by Application (2022-2027)
13.1 Global Production, Revenue and Price Forecast by Type (2022-2027)
13.1.1 Global Forecasted Production of Cement Boards by Type (2022-2027)
13.1.2 Global Forecasted Revenue of Cement Boards by Type (2022-2027)
13.1.3 Global Forecasted Price of Cement Boards by Type (2022-2027)
13.2 Global Forecasted Consumption of Cement Boards by Application (2022-2027)
14 Research Finding and Conclusion
15 Methodology and Data Source
15.1 Methodology/Research Approach
15.1.1 Research Programs/Design
15.1.2 Market Size Estimation
15.1.3 Market Breakdown and Data Triangulation
15.2 Data Source
15.2.1 Secondary Sources
15.2.2 Primary Sources
15.3 Author List
15.4 Disclaimer
List of Tables
    Table 1. Global Cement Boards Market Size by Type (M Sqm) & (US$ Million) (2021 VS 2027)
    Table 2. Global Cement Boards Consumption (M Sqm) Comparison by Application: 2016 VS 2021 VS 2027
    Table 3. Cement Boards Market Size Comparison by Region: 2016 VS 2021 VS 2027
    Table 4. Global Cement Boards Production Capacity (M Sqm) by Manufacturers
    Table 5. Global Cement Boards Production (M Sqm) by Manufacturers (2016-2021)
    Table 6. Global Cement Boards Production Market Share by Manufacturers (2016-2021)
    Table 7. Global Cement Boards Revenue (US$ Million) by Manufacturers (2016-2021)
    Table 8. Global Cement Boards Revenue Share by Manufacturers (2016-2021)
    Table 9. Company Type (Tier 1, Tier 2 and Tier 3) & (based on the Revenue in Cement Boards as of 2020)
    Table 10. Global Market Cement Boards Average Price (USD/Sqm) of Key Manufacturers (2016-2021)
    Table 11. Manufacturers Cement Boards Production Sites and Area Served
    Table 12. Manufacturers Cement Boards Product Types
    Table 13. Mergers & Acquisitions, Expansion
    Table 14. Global Cement Boards Production Capacity (M Sqm) by Region (2016-2021)
    Table 15. Global Cement Boards Production (M Sqm) by Region (2016-2021)
    Table 16. Global Cement Boards Revenue (US$ Million) by Region (2016-2021)
    Table 17. Global Cement Boards Revenue Market Share by Region (2016-2021)
    Table 18. Global Cement Boards Production Capacity (M Sqm), Revenue (US$ Million), Price (USD/Sqm) and Gross Margin (2016-2021)
    Table 19. North America Cement Boards Production Capacity (M Sqm), Revenue (US$ Million), Price (USD/Sqm) and Gross Margin (2016-2021)
    Table 20. Europe Cement Boards Production (M Sqm), Revenue (US$ Million), Price (USD/Sqm) and Gross Margin (2016-2021)
    Table 21. China Cement Boards Production Capacity (M Sqm), Revenue (US$ Million), Price (USD/Sqm) and Gross Margin (2016-2021)
    Table 22. Japan Cement Boards Production Capacity (M Sqm), Revenue (US$ Million), Price (USD/Sqm) and Gross Margin (2016-2021)
    Table 23. India Cement Boards Production Capacity (M Sqm), Revenue (US$ Million), Price (USD/Sqm) and Gross Margin (2016-2021)
    Table 24. Australia Cement Boards Production Capacity (M Sqm), Revenue (US$ Million), Price (USD/Sqm) and Gross Margin (2016-2021)
    Table 25. Southeast Asia Cement Boards Production Capacity (M Sqm), Revenue (US$ Million), Price (USD/Sqm) and Gross Margin (2016-2021)
    Table 26. Global Cement Boards Consumption Market by Region (2016-2021) & (M Sqm)
    Table 27. Global Cement Boards Consumption Market Share by Region (2016-2021)
    Table 28. North America Cement Boards Consumption by Country (2016-2021) & (M Sqm)
    Table 29. Europe Cement Boards Consumption by Country (2016-2021) & (M Sqm)
    Table 30. Asia Pacific Cement Boards Consumption by Region (2016-2021) & (M Sqm)
    Table 31. Latin America Cement Boards Consumption by Countries (2016-2021) & (M Sqm)
    Table 32. Global Cement Boards Production (M Sqm) by Type (2016-2021)
    Table 33. Global Cement Boards Production Market Share by Type (2016-2021)
    Table 34. Global Cement Boards Revenue (US$ Million) by Type (2016-2021)
    Table 35. Global Cement Boards Revenue Share by Type (2016-2021)
    Table 36. Global Cement Boards Price (USD/Sqm) by Type (2016-2021)
    Table 37. Global Cement Boards Consumption by Application (2016-2021) & (M Sqm)
    Table 38. Global Cement Boards Consumption Market Share by Application (2016-2021)
    Table 39. Global Cement Boards Consumption Growth Rate by Application (2016-2021)
    Table 40. James Hardie Cement Boards Corporation Information
    Table 41. James Hardie Specification and Application
    Table 42. James Hardie Cement Boards Production Capacity (M Sqm), Revenue (US$ Million), Price (USD/Sqm) and Gross Margin (2016-2021)
    Table 43. James Hardie Main Business and Markets Served
    Table 44. James Hardie Recent Developments/Updates
    Table 45. Etex Group Cement Boards Corporation Information
    Table 46. Etex Group Specification and Application
    Table 47. Etex Group Cement Boards Production Capacity (M Sqm), Revenue (US$ Million), Price (USD/Sqm) and Gross Margin (2016-2021)
    Table 48. Etex Group Main Business and Markets Served
    Table 49. Etex Group Recent Developments/Updates
    Table 50. Cembrit Cement Boards Corporation Information
    Table 51. Cembrit Specification and Application
    Table 52. Cembrit Cement Boards Production Capacity (M Sqm), Revenue (US$ Million), Price (USD/Sqm) and Gross Margin (2016-2021)
    Table 53. Cembrit Main Business and Markets Served
    Table 54. Cembrit Recent Developments/Updates
    Table 55. Mahaphant Cement Boards Corporation Information
    Table 56. Mahaphant Specification and Application
    Table 57. Mahaphant Cement Boards Production Capacity (M Sqm), Revenue (US$ Million), Price (USD/Sqm) and Gross Margin (2016-2021)
    Table 58. Mahaphant Main Business and Markets Served
    Table 59. Mahaphant Recent Developments/Updates
    Table 60. Elementia Cement Boards Corporation Information
    Table 61. Elementia Specification and Application
    Table 62. Elementia Cement Boards Production Capacity (M Sqm), Revenue (US$ Million), Price (USD/Sqm) and Gross Margin (2016-2021)
    Table 63. Elementia Main Business and Markets Served
    Table 64. Elementia Recent Developments/Updates
    Table 65. Everest Industries Cement Boards Corporation Information
    Table 66. Everest Industries Specification and Application
    Table 67. Everest Industries Cement Boards Production Capacity (M Sqm), Revenue (US$ Million), Price (USD/Sqm) and Gross Margin (2016-2021)
    Table 68. Everest Industries Main Business and Markets Served
    Table 69. Everest Industries Recent Developments/Updates
    Table 70. Saint-Gobain Cement Boards Corporation Information
    Table 71. Saint-Gobain Specification and Application
    Table 72. Saint-Gobain Cement Boards Production Capacity (M Sqm), Revenue (US$ Million), Price (USD/Sqm) and Gross Margin (2016-2021)
    Table 73. Saint-Gobain Main Business and Markets Served
    Table 74. Saint-Gobain Recent Developments/Updates
    Table 75. Hume Cemboard Industries Cement Boards Corporation Information
    Table 76. Hume Cemboard Industries Specification and Application
    Table 77. Hume Cemboard Industries Cement Boards Production Capacity (M Sqm), Revenue (US$ Million), Price (USD/Sqm) and Gross Margin (2016-2021)
    Table 78. Hume Cemboard Industries Main Business and Markets Served
    Table 79. Hume Cemboard Industries Recent Developments/Updates
    Table 80. Taisyou Cement Boards Corporation Information
    Table 81. Taisyou Specification and Application
    Table 82. Taisyou Cement Boards Production Capacity (M Sqm), Revenue (US$ Million), Price (USD/Sqm) and Gross Margin (2016-2021)
    Table 83. Taisyou Main Business and Markets Served
    Table 84. Taisyou Recent Developments/Updates
    Table 85. Soben board Cement Boards Corporation Information
    Table 86. Soben board Specification and Application
    Table 87. Soben board Cement Boards Production Capacity (M Sqm), Revenue (US$ Million), Price (USD/Sqm) and Gross Margin (2016-2021)
    Table 88. Soben board Main Business and Markets Served
    Table 89. Soben board Recent Developments/Updates
    Table 90. SCG Building Materials Cement Boards Corporation Information
    Table 91. SCG Building Materials Specification and Application
    Table 92. SCG Building Materials Cement Boards Production Capacity (M Sqm), Revenue (US$ Million), Price (USD/Sqm) and Gross Margin (2016-2021)
    Table 93. SCG Building Materials Main Business and Markets Served
    Table 94. SCG Building Materials Recent Developments/Updates
    Table 95. Kmew Cement Boards Corporation Information
    Table 96. Kmew Specification and Application
    Table 97. Kmew Cement Boards Production Capacity (M Sqm), Revenue (US$ Million), Price (USD/Sqm) and Gross Margin (2016-2021)
    Table 98. Kmew Main Business and Markets Served
    Table 99. Kmew Recent Developments/Updates
    Table 100. PENNY PANEL Cement Boards Corporation Information
    Table 101. PENNY PANEL Specification and Application
    Table 102. PENNY PANEL Cement Boards Production Capacity (M Sqm), Revenue (US$ Million), Price (USD/Sqm) and Gross Margin (2016-2021)
    Table 103. PENNY PANEL Main Business and Markets Served
    Table 104. PENNY PANEL Recent Developments/Updates
    Table 105. Nichiha Cement Boards Corporation Information
    Table 106. Nichiha Specification and Application
    Table 107. Nichiha Cement Boards Production Capacity (M Sqm), Revenue (US$ Million), Price (USD/Sqm) and Gross Margin (2016-2021)
    Table 108. Nichiha Main Business and Markets Served
    Table 109. Nichiha Recent Developments/Updates
    Table 110. Nichiha Cement Boards Corporation Information
    Table 111. Lato JSC Specification and Application
    Table 112. Lato JSC Cement Boards Production Capacity (M Sqm), Revenue (US$ Million), Price (USD/Sqm) and Gross Margin (2016-2021)
    Table 113. Lato JSC Main Business and Markets Served
    Table 114. Lato JSC Recent Developments/Updates
    Table 115. FRAMECAD Cement Boards Corporation Information
    Table 116. FRAMECAD Cement Boards Production Capacity (M Sqm), Revenue (US$ Million), Price (USD/Sqm) and Gross Margin (2016-2021)
    Table 117. FRAMECAD Main Business and Markets Served
    Table 118. FRAMECAD Recent Developments/Updates
    Table 119. LTM LLC Cement Boards Corporation Information
    Table 120. LTM LLC Specification and Application
    Table 121. LTM LLC Cement Boards Production Capacity (M Sqm), Revenue (US$ Million), Price (USD/Sqm) and Gross Margin (2016-2021)
    Table 122. LTM LLC Main Business and Markets Served
    Table 123. LTM LLC Recent Developments/Updates
    Table 124. TEPE Betopan Cement Boards Corporation Information
    Table 125. TEPE Betopan Specification and Application
    Table 126. TEPE Betopan Cement Boards Production Capacity (M Sqm), Revenue (US$ Million), Price (USD/Sqm) and Gross Margin (2016-2021)
    Table 127. TEPE Betopan Main Business and Markets Served
    Table 128. TEPE Betopan Recent Developments/Updates
    Table 129. HEKIM YAPI Cement Boards Corporation Information
    Table 130. HEKIM YAPI Specification and Application
    Table 131. HEKIM YAPI Cement Boards Production Capacity (M Sqm), Revenue (US$ Million), Price (USD/Sqm) and Gross Margin (2016-2021)
    Table 132. HEKIM YAPI Main Business and Markets Served
    Table 133. HEKIM YAPI Recent Developments/Updates
    Table 134. Atermit Cement Boards Corporation Information
    Table 135. Atermit Specification and Application
    Table 136. Atermit Cement Boards Production Capacity (M Sqm), Revenue (US$ Million), Price (USD/Sqm) and Gross Margin (2016-2021)
    Table 137. Atermit Main Business and Markets Served
    Table 138. Atermit Recent Developments/Updates
    Table 139. GAF Cement Boards Corporation Information
    Table 140. GAF Specification and Application
    Table 141. GAF Cement Boards Production Capacity (M Sqm), Revenue (US$ Million), Price (USD/Sqm) and Gross Margin (2016-2021)
    Table 142. GAF Main Business and Markets Served
    Table 143. GAF Recent Developments/Updates
    Table 144. China Conch Venture holdings Cement Boards Corporation Information
    Table 145. China Conch Venture holdings Specification and Application
    Table 146. China Conch Venture holdings Cement Boards Production Capacity (M Sqm), Revenue (US$ Million), Price (USD/Sqm) and Gross Margin (2016-2021)
    Table 147. China Conch Venture holdings Main Business and Markets Served
    Table 148. China Conch Venture holdings Recent Developments/Updates
    Table 149. HeaderBoard Building Materials Cement Boards Corporation Information
    Table 150. HeaderBoard Building Materials Specification and Application
    Table 151. HeaderBoard Building Materials Cement Boards Production Capacity (M Sqm), Revenue (US$ Million), Price (USD/Sqm) and Gross Margin (2016-2021)
    Table 152. HeaderBoard Building Materials Main Business and Markets Served
    Table 153. HeaderBoard Building Materials Recent Developments/Updates
    Table 154. Sanle Group Cement Boards Corporation Information
    Table 155. Sanle Group Specification and Application
    Table 156. Sanle Group Cement Boards Production Capacity (M Sqm), Revenue (US$ Million), Price (USD/Sqm) and Gross Margin (2016-2021)
    Table 157. Sanle Group Main Business and Markets Served
    Table 158. Sanle Group Recent Developments/Updates
    Table 159. Guangdong Soben Green Cement Boards Corporation Information
    Table 160. Guangdong Soben Green Specification and Application
    Table 161. Guangdong Soben Green Cement Boards Production Capacity (M Sqm), Revenue (US$ Million), Price (USD/Sqm) and Gross Margin (2016-2021)
    Table 162. Guangdong Soben Green Main Business and Markets Served
    Table 163. Guangdong Soben Green Recent Developments/Updates
    Table 164. Production Base and Market Concentration Rate of Raw Material
    Table 165. Key Suppliers of Raw Materials
    Table 166. Cement Boards Distributors List
    Table 167. Cement Boards Customers List
    Table 168. Cement Boards Market Trends
    Table 169. Cement Boards Growth Drivers
    Table 170. Cement Boards Market Challenges
    Table 171. Cement Boards Market Restraints
    Table 172. Global Cement Boards Production (M Sqm) Forecast by Region (2022-2027)
    Table 173. North America Cement Boards Consumption Forecast by Country (2022-2027) & (M Sqm)
    Table 174. Europe Cement Boards Consumption Forecast by Country (2022-2027) & (M Sqm)
    Table 175. Asia Pacific Cement Boards Consumption Forecast by Region (2022-2027) & (M Sqm)
    Table 176. Latin America Cement Boards Consumption Forecast by Country (2022-2027) & (M Sqm)
    Table 177. Global Cement Boards Production Forecast by Type (2022-2027) & (M Sqm)
    Table 178. Global Cement Boards Revenue Forecast by Type (2022-2027) & (US$ Million)
    Table 179. Global Cement Boards Price Forecast by Type (2022-2027) & (USD/Sqm)
    Table 180. Global Cement Boards Consumption (M Sqm) Forecast by Application (2022-2027)
    Table 181. Research Programs/Design for This Report
    Table 182. Key Data Information from Secondary Sources
    Table 183. Key Data Information from Primary Sources
List of Figures
    Figure 1. Product Picture of Cement Boards
    Figure 2. Global Cement Boards Market Share by Type: 2020 VS 2027
    Figure 3. Fiber Cement Board Product Picture
    Figure 4. Cement Bonded Particle Board Product Picture
    Figure 5. Wood Based Cement Board Product Picture
    Figure 6. Others Product Picture
    Figure 7. Global Cement Boards Market Share by Application: 2020 VS 2027
    Figure 8. Commercial Buildings
    Figure 9. Residential Buildings
    Figure 10. Other
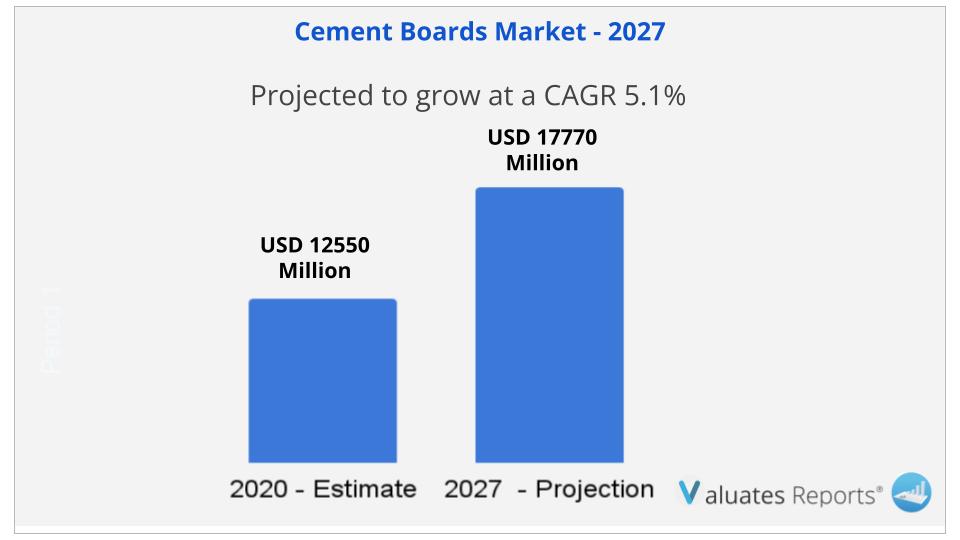
    Figure 11. Global Cement Boards Revenue (US$ Million), 2016 VS 2021 VS 2027
    Figure 12. Global Cement Boards Revenue (US$ Million) (2016-2027)
    Figure 13. Global Cement Boards Production Capacity (M Sqm) & (2016-2027)
    Figure 14. Global Cement Boards Production (M Sqm) & (2016-2027)
    Figure 15. North America Cement Boards Revenue (US$ Million) and Growth Rate (2016-2027)
    Figure 16. Europe Cement Boards Revenue (US$ Million) and Growth Rate (2016-2027)
    Figure 17. China Cement Boards Revenue (US$ Million) and Growth Rate (2016-2027)
    Figure 18. Japan Cement Boards Revenue (US$ Million) and Growth Rate (2016-2027)
    Figure 19. India Cement Boards Revenue (US$ Million) and Growth Rate (2016-2027)
    Figure 20. Australia Cement Boards Revenue (US$ Million) and Growth Rate (2016-2027)
    Figure 21. Southeast Asia Cement Boards Revenue (US$ Million) and Growth Rate (2016-2027)
    Figure 22. Cement Boards Production Share by Manufacturers in 2020
    Figure 23. Global Cement Boards Revenue Share by Manufacturers in 2020
    Figure 24. Cement Boards Market Share by Company Type (Tier 1, Tier 2 and Tier 3): 2016 VS 2020
    Figure 25. Global Market Cement Boards Average Price (USD/Sqm) of Key Manufacturers in 2020
    Figure 26. The Global 5 and 10 Largest Players: Market Share by Cement Boards Revenue in 2020
    Figure 27. Global Cement Boards Production Market Share by Region (2016-2021)
    Figure 28. North America Cement Boards Production (M Sqm) Growth Rate (2016-2021)
    Figure 29. Europe Cement Boards Production (M Sqm) Growth Rate (2016-2021)
    Figure 30. China Cement Boards Production (M Sqm) Growth Rate (2016-2021)
    Figure 31. Japan Cement Boards Production (M Sqm) Growth Rate (2016-2021)
    Figure 32. India Cement Boards Production (M Sqm) Growth Rate (2016-2021)
    Figure 33. Australia Cement Boards Production (M Sqm) Growth Rate (2016-2021)
    Figure 34. Southeast Asia Cement Boards Production (M Sqm) Growth Rate (2016-2021)
    Figure 35. Global Cement Boards Consumption Market Share by Region (2016-2021)
    Figure 36. Global Cement Boards Consumption Market Share by Region in 2020
    Figure 37. North America Cement Boards Consumption and Growth Rate (2016-2021) & (M Sqm)
    Figure 38. North America Cement Boards Consumption Market Share by Country in 2020
    Figure 39. Canada Cement Boards Consumption Growth Rate (2016-2021) & (M Sqm)
    Figure 40. U.S. Cement Boards Consumption Growth Rate (2016-2021) & (M Sqm)
    Figure 41. Europe Cement Boards Consumption Growth Rate (2016-2021) & (M Sqm)
    Figure 42. Europe Cement Boards Consumption Market Share by Country in 2020
    Figure 43. Germany America Cement Boards Consumption and Growth Rate (2016-2021) & (M Sqm)
    Figure 44. France Cement Boards Consumption and Growth Rate (2016-2021) & (M Sqm)
    Figure 45. U.K. Cement Boards Consumption and Growth Rate (2016-2021) & (M Sqm)
    Figure 46. Italy Cement Boards Consumption and Growth Rate (2016-2021) & (M Sqm)
    Figure 47. Russia Cement Boards Consumption and Growth Rate (2016-2021) & (M Sqm)
    Figure 48. Asia Pacific Cement Boards Consumption and Growth Rate (2016-2021) & (M Sqm)
    Figure 49. Asia Pacific Cement Boards Consumption Market Share by Regions in 2020
    Figure 50. China Cement Boards Consumption and Growth Rate (2016-2021) & (M Sqm)
    Figure 51. Japan Cement Boards Consumption and Growth Rate (2016-2021) & (M Sqm)
    Figure 52. South Korea Cement Boards Consumption and Growth Rate (2016-2021) & (M Sqm)
    Figure 53. Taiwan Cement Boards Consumption and Growth Rate (2016-2021) & (M Sqm)
    Figure 54. Southeast Asia Cement Boards Consumption and Growth Rate (2016-2021) & (M Sqm)
    Figure 55. India Cement Boards Consumption and Growth Rate (2016-2021) & (M Sqm)
    Figure 56. Australia Cement Boards Consumption and Growth Rate (2016-2021) & (M Sqm)
    Figure 57. Latin America Cement Boards Consumption and Growth Rate (2016-2021) & (M Sqm)
    Figure 58. Latin America Cement Boards Consumption Market Share by Country in 2020
    Figure 59. Mexico Cement Boards Consumption and Growth Rate (2016-2021) & (M Sqm)
    Figure 60. Brazil Cement Boards Consumption and Growth Rate (2016-2021) & (M Sqm)
    Figure 61. Production Market Share of Cement Boards by Type (2016-2021)
    Figure 62. Production Market Share of Cement Boards by Type in 2020
    Figure 63. Revenue Share of Cement Boards by Type (2016-2021)
    Figure 64. Revenue Market Share of Cement Boards by Type in 2020
    Figure 65. Global Cement Boards Consumption Market Share by Application (2016-2021)
    Figure 66. Global Cement Boards Consumption Market Share by Application in 2020
    Figure 67. Global Cement Boards Consumption Growth Rate by Application (2016-2021)
    Figure 68. Key Raw Materials Price Trend
    Figure 69. Manufacturing Cost Structure of Cement Boards
    Figure 70. Manufacturing Process Analysis of Cement Boards
    Figure 71. Cement Boards Industrial Chain Analysis
    Figure 72. Channels of Distribution
    Figure 73. Distributors Profiles
    Figure 74. Global Cement Boards Production Market Share Forecast by Region (2022-2027)
    Figure 75. North America Cement Boards Production (M Sqm) Growth Rate Forecast (2022-2027)
    Figure 76. Europe Cement Boards Production (M Sqm) Growth Rate Forecast (2022-2027)
    Figure 77. China Cement Boards Production (M Sqm) Growth Rate Forecast (2022-2027)
    Figure 78. Japan Cement Boards Production (M Sqm) Growth Rate Forecast (2022-2027)
    Figure 79. India Cement Boards Production (M Sqm) Growth Rate Forecast (2022-2027)
    Figure 80. Australia Cement Boards Production (M Sqm) Growth Rate Forecast (2022-2027)
    Figure 81. Southeast Asia Cement Boards Production (M Sqm) Growth Rate Forecast (2022-2027)
    Figure 82. Global Forecasted Demand Analysis of Cement Boards (2015-2027) & (M Sqm)
    Figure 83. Global Cement Boards Production Market Share Forecast by Type (2022-2027)
    Figure 84. Global Cement Boards Revenue Market Share Forecast by Type (2022-2027)
    Figure 85. Global Cement Boards Consumption Forecast by Application (2022-2027)
    Figure 86. Bottom-up and Top-down Approaches for This Report
    Figure 87. Data Triangulation
SELECT A FORMAT
Added to Cart
Electronic (PDF)

$2900

This license allows only one user to access the PDF.
Electronic (PDF)

$4350

This license allows 1 - 5 user to access the PDF, license is suitable for small groups of 5 users working together
Electronic (PDF)

$5800

This license allows users/teams in a same Enterprise to use this report, various departments within an enterpise can use this report
Add to Cart
Buy Now (15% Discount)

OUR CUSTOMER

Lukasiewicz Research Network

RELATED REPORTS

Integral Waterproofing System - Global Market Share and Ranking, Overall Sales and Demand Forecast 2024-2030

120 Pages
Type: Report
Code: QYRE-Auto-36Z14364
Thu May 02 00:00:00 UTC 2024

Add to Cart

Stainless Steel Wall Studs - Global Market Share and Ranking, Overall Sales and Demand Forecast 2024-2030

120 Pages
Type: Report
Code: QYRE-Auto-15A14347
Thu May 02 00:00:00 UTC 2024

Add to Cart

Concrete Pavement Cutter - Global Market Share and Ranking, Overall Sales and Demand Forecast 2024-2030

120 Pages
Type: Report
Code: QYRE-Auto-9Y14357
Thu May 02 00:00:00 UTC 2024

Add to Cart

Add to Cart