
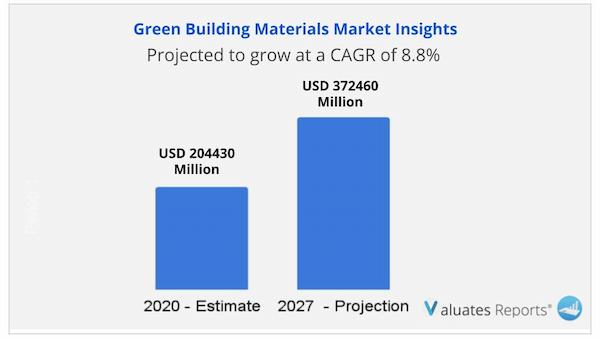
The global Green Building Materials market size is projected to reach US$ 372460 million by 2027, from US$ 204430 million in 2020, at a CAGR of 8.8% during 2021-2027.
Key drivers of the green building materials market include the growing demand for green and sustainable building materials in the construction industry.
The presence of key players and strict emission norms along with strong government support will propel the green building materials market in the upcoming years.
Moreover, the rapid technological developments and R&D initiatives for newer construction methods will spur market penetration during the review period.
In green building materials market, the materials used are recyclable products, which enhance the production environment and quality of life. These materials promote conservation of non-renewable resources and reduce environmental impact associated with fabrication, processing, installation, transportation, disposal, and recycling of building materials. Green building materials are employed in construction industry to address various environment challenges including anomalous climate change, natural resource depletion, atmospheric pollution, contamination of fresh water resources, and loss of biodiversity. Eco-friendly nature, durability, and energy efficiency of green building materials make them ideal for use in designing of residential and non-residential buildings.
Green construction is picking up leading to improved indoor air quality, energy efficiency, and superior insulation. Retrofitting and cost savings are crucial for achieving carbon-neutral goals. Schools, communities, high-rise buildings, residential and non-residential complexes are going green. They not only save precious resources but also aid in social well-being. The transition is key to addressing climate change and meeting sustainable development goals which in turn will drive the growth of the green building materials market in the future.
Sustainable buildings are more cost-effective than traditional construction materials as they provide energy efficiency and water conservation during the initial operational stage. Governments around the world are busy revising regulations and tweaking norms to introduce economic incentives to developers. Moreover, green rating programs, councils, and certifications such as LEED( Leadership in Energy and Environmental Design) have been set up to make regulatory mandates compulsory for sustainability clams. This in turn will significantly boost the penetration of the green building materials market during the forecasted period.
Green construction offers scope for using eco-friendly materials in every aspect of its design. Solar power panels and biodegradable materials such as organic paints limit the release of toxins. In addition to it, green insulation is a major trend in the industry. They are wall filters made from recycled denims or newspapers to line the walls. Moreover, smart appliances such as motion detectors, access cards, and sensors determine the occupancy status and adjust the room temperature and ventilation accordingly. These factors provide huge scope for the growth of the green building materials market in the near future.
High-impact rendering factors and drivers have been studied in this report to aid the readers to understand the general development. Moreover, the report includes restraints and challenges that may act as stumbling blocks on the way of the players. This will assist the users to be attentive and make informed decisions related to business. Specialists have also laid their focus on the upcoming business prospects.
Based on application, the insulation segment will witness a massive growth in the green building materials market share due to their capacity to lower energy consumption costs.
Based on region, North America will grow the highest in the green building materials market share owing to rising construction activities, favorable policies, and incentives.
The readers in the section will understand how the Green Building Materials market scenario changed across the globe during the pandemic and post-pandemic. The study is done keeping in view the changes in aspects such as production, demand, consumption, supply chain. The industry experts have also highlighted the key factors that will help create opportunities for players and stabilize the overall industry in the years to come.
Key segments including type, and application have been elaborated in this report. The consultants at QY Research have studied every segment and provided the market size using historical data. They have also talked about the growth opportunities that the segment may pose in the future. This study bestows production and revenue data by type, and application during the historical period (2016-2021) and forecast period (2022-2027).
This section of the report provides key insights regarding various regions and the key players operating in each region. Economic, social, environmental, technological, and political factors have been taken into consideration while assessing the growth of the particular region/country. The readers will also get their hands on the revenue and production data of each region and country for the period 2016-2027. This information derived through comprehensive research will help the reader to get familiar with the potential value of the investment in a particular region. North America, Europe, China and Japan are the major regions studied in the research report.
In this section, the readers will gain an understanding of the key players competing. The experts at QY Research have studied the key growth strategies, such as innovative trends and developments, intensification of product portfolio, mergers and acquisitions, collaborations, new product innovation, and geographical expansion, undertaken by these participants to maintain their presence. Apart from business strategies, the study includes current developments and key financials. The readers will also get access to the data related to global revenue, price, and production by manufacturers for the period 2016-2021. This all-inclusive report will certainly serve the clients to stay updated and make effective decisions in their businesses.
Some of the prominent players reviewed in the research report include:
|
Report Metric |
Details |
|
Report Name |
Green Building Materials |
|
The market size in 2021 |
USD 204430 Million |
|
The revenue forecast in 2027 |
USD 372460 Million |
|
Growth Rate |
CAGR of 8.8% during 2021-2027. |
|
Market size available for years |
2021-2027 |
|
Forecast units |
Value (USD) |
Ans. The global Green Building Materials market size is projected to reach US$ 372460 million by 2027, from US$ 204430 million in 2020.
Ans. The Green Building Materials market is estimated to grow with a Compound Annual Growth Rate (CAGR) of 8.8% during 2021-2027.
Table of Contents
1 Green Building Materials Market Overview
1.1 Product Overview and Scope of Green Building Materials
1.2 Green Building Materials Segment by Type
1.2.1 Global Green Building Materials Market Size Growth Rate Analysis by Type 2021 VS 2027
1.2.2 Linoleum
1.2.3 Galvalume Panels
1.2.4 Fiber-Cement Composites
1.2.5 Others
1.3 Green Building Materials Segment by Application
1.3.1 Global Green Building Materials Consumption Comparison by Application: 2016 VS 2021 VS 2027
1.3.2 Framing
1.3.3 Insulation
1.3.4 Roofing
1.3.5 Exterior Siding
1.3.6 Interior Finishing
1.3.7 Others
1.4 Global Market Growth Prospects
1.4.1 Global Green Building Materials Revenue Estimates and Forecasts (2016-2027)
1.4.2 Global Green Building Materials Production Capacity Estimates and Forecasts (2016-2027)
1.4.3 Global Green Building Materials Production Estimates and Forecasts (2016-2027)
1.5 Global Market Size by Region
1.5.1 Global Green Building Materials Market Size Estimates and Forecasts by Region: 2016 VS 2021 VS 2027
1.5.2 North America Green Building Materials Estimates and Forecasts (2016-2027)
1.5.3 Europe Green Building Materials Estimates and Forecasts (2016-2027)
1.5.4 China Green Building Materials Estimates and Forecasts (2016-2027)
1.5.5 Japan Green Building Materials Estimates and Forecasts (2016-2027)
2 Market Competition by Manufacturers
2.1 Global Green Building Materials Production Capacity Market Share by Manufacturers (2016-2021)
2.2 Global Green Building Materials Revenue Market Share by Manufacturers (2016-2021)
2.3 Green Building Materials Market Share by Company Type (Tier 1, Tier 2 and Tier 3)
2.4 Global Green Building Materials Average Price by Manufacturers (2016-2021)
2.5 Manufacturers Green Building Materials Production Sites, Area Served, Product Types
2.6 Green Building Materials Market Competitive Situation and Trends
2.6.1 Green Building Materials Market Concentration Rate
2.6.2 Global 5 and 10 Largest Green Building Materials Players Market Share by Revenue
2.6.3 Mergers & Acquisitions, Expansion
3 Production and Capacity by Region
3.1 Global Production Capacity of Green Building Materials Market Share by Region (2016-2021)
3.2 Global Green Building Materials Revenue Market Share by Region (2016-2021)
3.3 Global Green Building Materials Production Capacity, Revenue, Price and Gross Margin (2016-2021)
3.4 North America Green Building Materials Production
3.4.1 North America Green Building Materials Production Growth Rate (2016-2021)
3.4.2 North America Green Building Materials Production Capacity, Revenue, Price and Gross Margin (2016-2021)
3.5 Europe Green Building Materials Production
3.5.1 Europe Green Building Materials Production Growth Rate (2016-2021)
3.5.2 Europe Green Building Materials Production Capacity, Revenue, Price and Gross Margin (2016-2021)
3.6 China Green Building Materials Production
3.6.1 China Green Building Materials Production Growth Rate (2016-2021)
3.6.2 China Green Building Materials Production Capacity, Revenue, Price and Gross Margin (2016-2021)
3.7 Japan Green Building Materials Production
3.7.1 Japan Green Building Materials Production Growth Rate (2016-2021)
3.7.2 Japan Green Building Materials Production Capacity, Revenue, Price and Gross Margin (2016-2021)
4 Global Green Building Materials Consumption by Region
4.1 Global Green Building Materials Consumption by Region
4.1.1 Global Green Building Materials Consumption by Region
4.1.2 Global Green Building Materials Consumption Market Share by Region
4.2 North America
4.2.1 North America Green Building Materials Consumption by Country
4.2.2 U.S.
4.2.3 Canada
4.3 Europe
4.3.1 Europe Green Building Materials Consumption by Country
4.3.2 Germany
4.3.3 France
4.3.4 U.K.
4.3.5 Italy
4.3.6 Russia
4.4 Asia Pacific
4.4.1 Asia Pacific Green Building Materials Consumption by Region
4.4.2 China
4.4.3 Japan
4.4.4 South Korea
4.4.5 Taiwan
4.4.6 Southeast Asia
4.4.7 India
4.4.8 Australia
4.5 Latin America
4.5.1 Latin America Green Building Materials Consumption by Country
4.5.2 Mexico
4.5.3 Brazil
5 Production, Revenue, Price Trend by Type
5.1 Global Green Building Materials Production Market Share by Type (2016-2021)
5.2 Global Green Building Materials Revenue Market Share by Type (2016-2021)
5.3 Global Green Building Materials Price by Type (2016-2021)
6 Consumption Analysis by Application
6.1 Global Green Building Materials Consumption Market Share by Application (2016-2021)
6.2 Global Green Building Materials Consumption Growth Rate by Application (2016-2021)
7 Key Companies Profiled
7.1 BASF
7.1.1 BASF Green Building Materials Corporation Information
7.1.2 BASF Green Building Materials Product Portfolio
7.1.3 BASF Green Building Materials Production Capacity, Revenue, Price and Gross Margin (2016-2021)
7.1.4 BASF Main Business and Markets Served
7.1.5 BASF Recent Developments/Updates
7.2 DuPont
7.2.1 DuPont Green Building Materials Corporation Information
7.2.2 DuPont Green Building Materials Product Portfolio
7.2.3 DuPont Green Building Materials Production Capacity, Revenue, Price and Gross Margin (2016-2021)
7.2.4 DuPont Main Business and Markets Served
7.2.5 DuPont Recent Developments/Updates
7.3 Owens Corning
7.3.1 Owens Corning Green Building Materials Corporation Information
7.3.2 Owens Corning Green Building Materials Product Portfolio
7.3.3 Owens Corning Green Building Materials Production Capacity, Revenue, Price and Gross Margin (2016-2021)
7.3.4 Owens Corning Main Business and Markets Served
7.3.5 Owens Corning Recent Developments/Updates
7.4 Kingspan Group
7.4.1 Kingspan Group Green Building Materials Corporation Information
7.4.2 Kingspan Group Green Building Materials Product Portfolio
7.4.3 Kingspan Group Green Building Materials Production Capacity, Revenue, Price and Gross Margin (2016-2021)
7.4.4 Kingspan Group Main Business and Markets Served
7.4.5 Kingspan Group Recent Developments/Updates
7.5 greenbuildingsolutions
7.5.1 greenbuildingsolutions Green Building Materials Corporation Information
7.5.2 greenbuildingsolutions Green Building Materials Product Portfolio
7.5.3 greenbuildingsolutions Green Building Materials Production Capacity, Revenue, Price and Gross Margin (2016-2021)
7.5.4 greenbuildingsolutions Main Business and Markets Served
7.5.5 greenbuildingsolutions Recent Developments/Updates
7.6 greenbuilt
7.6.1 greenbuilt Green Building Materials Corporation Information
7.6.2 greenbuilt Green Building Materials Product Portfolio
7.6.3 greenbuilt Green Building Materials Production Capacity, Revenue, Price and Gross Margin (2016-2021)
7.6.4 greenbuilt Main Business and Markets Served
7.6.5 greenbuilt Recent Developments/Updates
8 Green Building Materials Manufacturing Cost Analysis
8.1 Green Building Materials Key Raw Materials Analysis
8.1.1 Key Raw Materials
8.1.2 Key Raw Materials Price Trend
8.1.3 Key Suppliers of Raw Materials
8.2 Proportion of Manufacturing Cost Structure
8.3 Manufacturing Process Analysis of Green Building Materials
8.4 Green Building Materials Industrial Chain Analysis
9 Marketing Channel, Distributors and Customers
9.1 Marketing Channel
9.2 Green Building Materials Distributors List
9.3 Green Building Materials Customers
10 Market Dynamics
10.1 Green Building Materials Industry Trends
10.2 Green Building Materials Growth Drivers
10.3 Green Building Materials Market Challenges
10.4 Green Building Materials Market Restraints
11 Production and Supply Forecast
11.1 Global Forecasted Production of Green Building Materials by Region (2022-2027)
11.2 North America Green Building Materials Production, Revenue Forecast (2022-2027)
11.3 Europe Green Building Materials Production, Revenue Forecast (2022-2027)
11.4 China Green Building Materials Production, Revenue Forecast (2022-2027)
11.5 Japan Green Building Materials Production, Revenue Forecast (2022-2027)
12 Consumption and Demand Forecast
12.1 Global Forecasted Demand Analysis of Green Building Materials
12.2 North America Forecasted Consumption of Green Building Materials by Country
12.3 Europe Market Forecasted Consumption of Green Building Materials by Country
12.4 Asia Pacific Market Forecasted Consumption of Green Building Materials by Region
12.5 Latin America Forecasted Consumption of Green Building Materials by Country
13 Forecast by Type and by Application (2022-2027)
13.1 Global Production, Revenue and Price Forecast by Type (2022-2027)
13.1.1 Global Forecasted Production of Green Building Materials by Type (2022-2027)
13.1.2 Global Forecasted Revenue of Green Building Materials by Type (2022-2027)
13.1.3 Global Forecasted Price of Green Building Materials by Type (2022-2027)
13.2 Global Forecasted Consumption of Green Building Materials by Application (2022-2027)
14 Research Finding and Conclusion
15 Methodology and Data Source
15.1 Methodology/Research Approach
15.1.1 Research Programs/Design
15.1.2 Market Size Estimation
15.1.3 Market Breakdown and Data Triangulation
15.2 Data Source
15.2.1 Secondary Sources
15.2.2 Primary Sources
15.3 Author List
15.4 Disclaimer
List of Tables
Table 1. Global Green Building Materials Market Size by Type (K MT) & (US$ Million) (2021 VS 2027)
Table 2. Global Green Building Materials Consumption (K MT) Comparison by Application: 2016 VS 2021 VS 2027
Table 3. Green Building Materials Market Size Comparison by Region: 2016 VS 2021 VS 2027
Table 4. Global Green Building Materials Production Capacity (K MT) by Manufacturers
Table 5. Global Green Building Materials Production (K MT) by Manufacturers (2016-2021)
Table 6. Global Green Building Materials Production Market Share by Manufacturers (2016-2021)
Table 7. Global Green Building Materials Revenue (US$ Million) by Manufacturers (2016-2021)
Table 8. Global Green Building Materials Revenue Share by Manufacturers (2016-2021)
Table 9. Company Type (Tier 1, Tier 2 and Tier 3) & (based on the Revenue in Green Building Materials as of 2020)
Table 10. Global Market Green Building Materials Average Price (USD/MT) of Key Manufacturers (2016-2021)
Table 11. Manufacturers Green Building Materials Production Sites and Area Served
Table 12. Manufacturers Green Building Materials Product Types
Table 13. Mergers & Acquisitions, Expansion
Table 14. Global Green Building Materials Production Capacity (K MT) by Region (2016-2021)
Table 15. Global Green Building Materials Production (K MT) by Region (2016-2021)
Table 16. Global Green Building Materials Revenue (US$ Million) by Region (2016-2021)
Table 17. Global Green Building Materials Revenue Market Share by Region (2016-2021)
Table 18. Global Green Building Materials Production Capacity (K MT), Revenue (US$ Million), Price (USD/MT) and Gross Margin (2016-2021)
Table 19. North America Green Building Materials Production Capacity (K MT), Revenue (US$ Million), Price (USD/MT) and Gross Margin (2016-2021)
Table 20. Europe Green Building Materials Production (K MT), Revenue (US$ Million), Price (USD/MT) and Gross Margin (2016-2021)
Table 21. China Green Building Materials Production Capacity (K MT), Revenue (US$ Million), Price (USD/MT) and Gross Margin (2016-2021)
Table 22. Japan Green Building Materials Production Capacity (K MT), Revenue (US$ Million), Price (USD/MT) and Gross Margin (2016-2021)
Table 23. Global Green Building Materials Consumption Market by Region (2016-2021) & (K MT)
Table 24. Global Green Building Materials Consumption Market Share by Region (2016-2021)
Table 25. North America Green Building Materials Consumption by Country (2016-2021) & (K MT)
Table 26. Europe Green Building Materials Consumption by Country (2016-2021) & (K MT)
Table 27. Asia Pacific Green Building Materials Consumption by Region (2016-2021) & (K MT)
Table 28. Latin America Green Building Materials Consumption by Countries (2016-2021) & (K MT)
Table 29. Global Green Building Materials Production (K MT) by Type (2016-2021)
Table 30. Global Green Building Materials Production Market Share by Type (2016-2021)
Table 31. Global Green Building Materials Revenue (US$ Million) by Type (2016-2021)
Table 32. Global Green Building Materials Revenue Share by Type (2016-2021)
Table 33. Global Green Building Materials Price (USD/MT) by Type (2016-2021)
Table 34. Global Green Building Materials Consumption by Application (2016-2021) & (K MT)
Table 35. Global Green Building Materials Consumption Market Share by Application (2016-2021)
Table 36. Global Green Building Materials Consumption Growth Rate by Application (2016-2021)
Table 37. BASF Green Building Materials Corporation Information
Table 38. BASF Specification and Application
Table 39. BASF Green Building Materials Production Capacity (K MT), Revenue (US$ Million), Price (USD/MT) and Gross Margin (2016-2021)
Table 40. BASF Main Business and Markets Served
Table 41. BASF Recent Developments/Updates
Table 42. DuPont Green Building Materials Corporation Information
Table 43. DuPont Specification and Application
Table 44. DuPont Green Building Materials Production Capacity (K MT), Revenue (US$ Million), Price (USD/MT) and Gross Margin (2016-2021)
Table 45. DuPont Main Business and Markets Served
Table 46. DuPont Recent Developments/Updates
Table 47. Owens Corning Green Building Materials Corporation Information
Table 48. Owens Corning Specification and Application
Table 49. Owens Corning Green Building Materials Production Capacity (K MT), Revenue (US$ Million), Price (USD/MT) and Gross Margin (2016-2021)
Table 50. Owens Corning Main Business and Markets Served
Table 51. Owens Corning Recent Developments/Updates
Table 52. Kingspan Group Green Building Materials Corporation Information
Table 53. Kingspan Group Specification and Application
Table 54. Kingspan Group Green Building Materials Production Capacity (K MT), Revenue (US$ Million), Price (USD/MT) and Gross Margin (2016-2021)
Table 55. Kingspan Group Main Business and Markets Served
Table 56. Kingspan Group Recent Developments/Updates
Table 57. greenbuildingsolutions Green Building Materials Corporation Information
Table 58. greenbuildingsolutions Specification and Application
Table 59. greenbuildingsolutions Green Building Materials Production Capacity (K MT), Revenue (US$ Million), Price (USD/MT) and Gross Margin (2016-2021)
Table 60. greenbuildingsolutions Main Business and Markets Served
Table 61. greenbuildingsolutions Recent Developments/Updates
Table 62. greenbuilt Green Building Materials Corporation Information
Table 63. greenbuilt Specification and Application
Table 64. greenbuilt Green Building Materials Production Capacity (K MT), Revenue (US$ Million), Price (USD/MT) and Gross Margin (2016-2021)
Table 65. greenbuilt Main Business and Markets Served
Table 66. greenbuilt Recent Developments/Updates
Table 67. Production Base and Market Concentration Rate of Raw Material
Table 68. Key Suppliers of Raw Materials
Table 69. Green Building Materials Distributors List
Table 70. Green Building Materials Customers List
Table 71. Green Building Materials Market Trends
Table 72. Green Building Materials Growth Drivers
Table 73. Green Building Materials Market Challenges
Table 74. Green Building Materials Market Restraints
Table 75. Global Green Building Materials Production (K MT) Forecast by Region (2022-2027)
Table 76. North America Green Building Materials Consumption Forecast by Country (2022-2027) & (K MT)
Table 77. Europe Green Building Materials Consumption Forecast by Country (2022-2027) & (K MT)
Table 78. Asia Pacific Green Building Materials Consumption Forecast by Region (2022-2027) & (K MT)
Table 79. Latin America Green Building Materials Consumption Forecast by Country (2022-2027) & (K MT)
Table 80. Global Green Building Materials Production Forecast by Type (2022-2027) & (K MT)
Table 81. Global Green Building Materials Revenue Forecast by Type (2022-2027) & (US$ Million)
Table 82. Global Green Building Materials Price Forecast by Type (2022-2027) & (USD/MT)
Table 83. Global Green Building Materials Consumption (K MT) Forecast by Application (2022-2027)
Table 84. Research Programs/Design for This Report
Table 85. Key Data Information from Secondary Sources
Table 86. Key Data Information from Primary Sources
List of Figures
Figure 1. Product Picture of Green Building Materials
Figure 2. Global Green Building Materials Market Share by Type: 2020 VS 2027
Figure 3. Linoleum Product Picture
Figure 4. Galvalume Panels Product Picture
Figure 5. Fiber-Cement Composites Product Picture
Figure 6. Others Product Picture
Figure 7. Global Green Building Materials Market Share by Application: 2020 VS 2027
Figure 8. Framing
Figure 9. Insulation
Figure 10. Roofing
Figure 11. Exterior Siding
Figure 12. Interior Finishing
Figure 13. Others
Figure 14. Global Green Building Materials Revenue (US$ Million), 2016 VS 2021 VS 2027
Figure 15. Global Green Building Materials Revenue (US$ Million) (2016-2027)
Figure 16. Global Green Building Materials Production Capacity (K MT) & (2016-2027)
Figure 17. Global Green Building Materials Production (K MT) & (2016-2027)
Figure 18. North America Green Building Materials Revenue (US$ Million) and Growth Rate (2016-2027)
Figure 19. Europe Green Building Materials Revenue (US$ Million) and Growth Rate (2016-2027)
Figure 20. China Green Building Materials Revenue (US$ Million) and Growth Rate (2016-2027)
Figure 21. Japan Green Building Materials Revenue (US$ Million) and Growth Rate (2016-2027)
Figure 22. Green Building Materials Production Share by Manufacturers in 2020
Figure 23. Global Green Building Materials Revenue Share by Manufacturers in 2020
Figure 24. Green Building Materials Market Share by Company Type (Tier 1, Tier 2 and Tier 3): 2016 VS 2020
Figure 25. Global Market Green Building Materials Average Price (USD/MT) of Key Manufacturers in 2020
Figure 26. The Global 5 and 10 Largest Players: Market Share by Green Building Materials Revenue in 2020
Figure 27. Global Green Building Materials Production Market Share by Region (2016-2021)
Figure 28. North America Green Building Materials Production (K MT) Growth Rate (2016-2021)
Figure 29. Europe Green Building Materials Production (K MT) Growth Rate (2016-2021)
Figure 30. China Green Building Materials Production (K MT) Growth Rate (2016-2021)
Figure 31. Japan Green Building Materials Production (K MT) Growth Rate (2016-2021)
Figure 32. Global Green Building Materials Consumption Market Share by Region (2016-2021)
Figure 33. Global Green Building Materials Consumption Market Share by Region in 2020
Figure 34. North America Green Building Materials Consumption and Growth Rate (2016-2021) & (K MT)
Figure 35. North America Green Building Materials Consumption Market Share by Country in 2020
Figure 36. Canada Green Building Materials Consumption Growth Rate (2016-2021) & (K MT)
Figure 37. U.S. Green Building Materials Consumption Growth Rate (2016-2021) & (K MT)
Figure 38. Europe Green Building Materials Consumption Growth Rate (2016-2021) & (K MT)
Figure 39. Europe Green Building Materials Consumption Market Share by Country in 2020
Figure 40. Germany America Green Building Materials Consumption and Growth Rate (2016-2021) & (K MT)
Figure 41. France Green Building Materials Consumption and Growth Rate (2016-2021) & (K MT)
Figure 42. U.K. Green Building Materials Consumption and Growth Rate (2016-2021) & (K MT)
Figure 43. Italy Green Building Materials Consumption and Growth Rate (2016-2021) & (K MT)
Figure 44. Russia Green Building Materials Consumption and Growth Rate (2016-2021) & (K MT)
Figure 45. Asia Pacific Green Building Materials Consumption and Growth Rate (2016-2021) & (K MT)
Figure 46. Asia Pacific Green Building Materials Consumption Market Share by Regions in 2020
Figure 47. China Green Building Materials Consumption and Growth Rate (2016-2021) & (K MT)
Figure 48. Japan Green Building Materials Consumption and Growth Rate (2016-2021) & (K MT)
Figure 49. South Korea Green Building Materials Consumption and Growth Rate (2016-2021) & (K MT)
Figure 50. Taiwan Green Building Materials Consumption and Growth Rate (2016-2021) & (K MT)
Figure 51. Southeast Asia Green Building Materials Consumption and Growth Rate (2016-2021) & (K MT)
Figure 52. India Green Building Materials Consumption and Growth Rate (2016-2021) & (K MT)
Figure 53. Australia Green Building Materials Consumption and Growth Rate (2016-2021) & (K MT)
Figure 54. Latin America Green Building Materials Consumption and Growth Rate (2016-2021) & (K MT)
Figure 55. Latin America Green Building Materials Consumption Market Share by Country in 2020
Figure 56. Mexico Green Building Materials Consumption and Growth Rate (2016-2021) & (K MT)
Figure 57. Brazil Green Building Materials Consumption and Growth Rate (2016-2021) & (K MT)
Figure 58. Production Market Share of Green Building Materials by Type (2016-2021)
Figure 59. Production Market Share of Green Building Materials by Type in 2020
Figure 60. Revenue Share of Green Building Materials by Type (2016-2021)
Figure 61. Revenue Market Share of Green Building Materials by Type in 2020
Figure 62. Global Green Building Materials Consumption Market Share by Application (2016-2021)
Figure 63. Global Green Building Materials Consumption Market Share by Application in 2020
Figure 64. Global Green Building Materials Consumption Growth Rate by Application (2016-2021)
Figure 65. Key Raw Materials Price Trend
Figure 66. Manufacturing Cost Structure of Green Building Materials
Figure 67. Manufacturing Process Analysis of Green Building Materials
Figure 68. Green Building Materials Industrial Chain Analysis
Figure 69. Channels of Distribution
Figure 70. Distributors Profiles
Figure 71. Global Green Building Materials Production Market Share Forecast by Region (2022-2027)
Figure 72. North America Green Building Materials Production (K MT) Growth Rate Forecast (2022-2027)
Figure 73. Europe Green Building Materials Production (K MT) Growth Rate Forecast (2022-2027)
Figure 74. China Green Building Materials Production (K MT) Growth Rate Forecast (2022-2027)
Figure 75. Japan Green Building Materials Production (K MT) Growth Rate Forecast (2022-2027)
Figure 76. Global Forecasted Demand Analysis of Green Building Materials (2015-2027) & (K MT)
Figure 77. Global Green Building Materials Production Market Share Forecast by Type (2022-2027)
Figure 78. Global Green Building Materials Revenue Market Share Forecast by Type (2022-2027)
Figure 79. Global Green Building Materials Consumption Forecast by Application (2022-2027)
Figure 80. Bottom-up and Top-down Approaches for This Report
Figure 81. Data Triangulation
$2900
$5800
HAVE A QUERY?
OUR CUSTOMER
