List of Tables
Table 1. Hospital Linen Supply and Management Services Market Size India VS Global, CAGR (2018 VS 2022 VS 2029)
Table 2. Hospital Linen Supply and Management Services Market Trends
Table 3. Hospital Linen Supply and Management Services Market Drivers
Table 4. Hospital Linen Supply and Management Services Market Challenges
Table 5. Hospital Linen Supply and Management Services Market Restraints
Table 6. Global Hospital Linen Supply and Management Services Market Size by Type: 2018 VS 2022 VS 2029 (US$ Million)
Table 7. India Hospital Linen Supply and Management Services Market Size by Type: 2018 VS 2022 VS 2029 (US$ Million)
Table 8. Global Hospital Linen Supply and Management Services Market Size by Application: 2018 VS 2022 VS 2029 (US$ Million)
Table 9. India Hospital Linen Supply and Management Services Market Size by Application: 2018 VS 2022 VS 2029 (US$ Million)
Table 10. Global Key Companies of Hospital Linen Supply and Management Services, Ranked by Revenue (2022) & (US$ Million)
Table 11. Global Hospital Linen Supply and Management Services Revenue by Player, (US$ Million), 2018-2023
Table 12. Global Hospital Linen Supply and Management Services Revenue Share by Player, 2018-2023
Table 13. Global Hospital Linen Supply and Management Services Companies Market Concentration Ratio (CR5 and HHI)
Table 14. Global Hospital Linen Supply and Management Services by Company Type (Tier 1, Tier 2, and Tier 3) & (based on the Revenue in Hospital Linen Supply and Management Services as of 2022)
Table 15. Global Key Players of Hospital Linen Supply and Management Services, Headquarters and Area Served
Table 16. Global Key Players of Hospital Linen Supply and Management Services, Product and Application
Table 17. Global Key Players of Hospital Linen Supply and Management Services, Date of Enter into This Industry
Table 18. Companies Mergers & Acquisitions, Expansion Plans
Table 19. Key Players of Hospital Linen Supply and Management Services in India, Ranked by Revenue (2022) & (US$ Million)
Table 20. India Hospital Linen Supply and Management Services Revenue by Players, (US$ Million), 2021, 2022 & 2023
Table 21. India Hospital Linen Supply and Management Services Revenue Share by Players, 2021, 2022 & 2023
Table 22. Global Hospital Linen Supply and Management Services Market Size Growth Rate (CAGR) by Region (US$ Million): 2018 VS 2022 VS 2029
Table 23. Global Hospital Linen Supply and Management Services Market Size by Region (2018-2023) & (US$ Million)
Table 24. Global Hospital Linen Supply and Management Services Market Size Forecast by Region (2024-2029) & (US$ Million)
Table 25. Americas Hospital Linen Supply and Management Services Market Size by Type (2018-2023) & (US$ Million)
Table 26. Americas Hospital Linen Supply and Management Services Market Size by Type (2024-2029) & (US$ Million)
Table 27. Americas Hospital Linen Supply and Management Services Market Size by Application (2018-2023) & (US$ Million)
Table 28. Americas Hospital Linen Supply and Management Services Market Size by Application (2024-2029) & (US$ Million)
Table 29. Americas Hospital Linen Supply and Management Services Market Size Growth Rate (CAGR) by Country (US$ Million): 2018 VS 2022 VS 2029
Table 30. Americas Hospital Linen Supply and Management Services Market Size by Country (2018-2023) & (US$ Million)
Table 31. Americas Hospital Linen Supply and Management Services Market Size by Country (2024-2029) & (US$ Million)
Table 32. EMEA Hospital Linen Supply and Management Services Market Size by Type (2018-2023) & (US$ Million)
Table 33. EMEA Hospital Linen Supply and Management Services Market Size by Type (2024-2029) & (US$ Million)
Table 34. EMEA Hospital Linen Supply and Management Services Market Size by Application (2018-2023) & (US$ Million)
Table 35. EMEA Hospital Linen Supply and Management Services Market Size by Application (2024-2029) & (US$ Million)
Table 36. EMEA Hospital Linen Supply and Management Services Market Size Growth Rate (CAGR) by Country (US$ Million): 2018 VS 2022 VS 2029
Table 37. EMEA Hospital Linen Supply and Management Services Market Size by Country (2018-2023) & (US$ Million)
Table 38. EMEA Hospital Linen Supply and Management Services Market Size by Country (2024-2029) & (US$ Million)
Table 39. China Hospital Linen Supply and Management Services Market Size by Type (2018-2023) & (US$ Million)
Table 40. China Hospital Linen Supply and Management Services Market Size by Type (2024-2029) & (US$ Million)
Table 41. China Hospital Linen Supply and Management Services Market Size by Application (2018-2023) & (US$ Million)
Table 42. China Hospital Linen Supply and Management Services Market Size by Application (2024-2029) & (US$ Million)
Table 43. China Hospital Linen Supply and Management Services Market Size Growth Rate (CAGR) by Country (US$ Million): 2018 VS 2022 VS 2029
Table 44. APAC Hospital Linen Supply and Management Services Market Size by Type (2018-2023) & (US$ Million)
Table 45. APAC Hospital Linen Supply and Management Services Market Size by Type (2024-2029) & (US$ Million)
Table 46. APAC Hospital Linen Supply and Management Services Market Size by Application (2018-2023) & (US$ Million)
Table 47. APAC Hospital Linen Supply and Management Services Market Size by Application (2024-2029) & (US$ Million)
Table 48. APAC Hospital Linen Supply and Management Services Market Size Growth Rate (CAGR) by Country (US$ Million): 2018 VS 2022 VS 2029
Table 49. APAC Hospital Linen Supply and Management Services Market Size by Region (2018-2023) & (US$ Million)
Table 50. APAC Hospital Linen Supply and Management Services Market Size by Region (2024-2029) & (US$ Million)
Table 51. Berendsen Company Details
Table 52. Berendsen Business Overview
Table 53. Berendsen Hospital Linen Supply and Management Services Product
Table 54. Berendsen Revenue in Hospital Linen Supply and Management Services Business (2018-2023) & (US$ Million)
Table 55. Berendsen Recent Development
Table 56. Angelica Company Details
Table 57. Angelica Business Overview
Table 58. Angelica Hospital Linen Supply and Management Services Product
Table 59. Angelica Revenue in Hospital Linen Supply and Management Services Business (2018-2023) & (US$ Million)
Table 60. Angelica Recent Development
Table 61. Alsco Company Details
Table 62. Alsco Business Overview
Table 63. Alsco Hospital Linen Supply and Management Services Product
Table 64. Alsco Revenue in Hospital Linen Supply and Management Services Business (2018-2023) & (US$ Million)
Table 65. Alsco Recent Development
Table 66. ImageFIRST Company Details
Table 67. ImageFIRST Business Overview
Table 68. ImageFIRST Hospital Linen Supply and Management Services Product
Table 69. ImageFIRST Revenue in Hospital Linen Supply and Management Services Business (2018-2023) & (US$ Million)
Table 70. ImageFIRST Recent Development
Table 71. Synergy Health Company Details
Table 72. Synergy Health Business Overview
Table 73. Synergy Health Hospital Linen Supply and Management Services Product
Table 74. Synergy Health Revenue in Hospital Linen Supply and Management Services Business (2018-2023) & (US$ Million)
Table 75. Synergy Health Recent Development
Table 76. Aramark Company Details
Table 77. Aramark Business Overview
Table 78. Aramark Hospital Linen Supply and Management Services Product
Table 79. Aramark Revenue in Hospital Linen Supply and Management Services Business (2018-2023) & (US$ Million)
Table 80. Aramark Recent Development
Table 81. Mission Company Details
Table 82. Mission Business Overview
Table 83. Mission Hospital Linen Supply and Management Services Product
Table 84. Mission Revenue in Hospital Linen Supply and Management Services Business (2018-2023) & (US$ Million)
Table 85. Mission Recent Development
Table 86. Cintas Company Details
Table 87. Cintas Business Overview
Table 88. Cintas Hospital Linen Supply and Management Services Product
Table 89. Cintas Revenue in Hospital Linen Supply and Management Services Business (2018-2023) & (US$ Million)
Table 90. Cintas Recent Development
Table 91. Unitex Company Details
Table 92. Unitex Business Overview
Table 93. Unitex Hospital Linen Supply and Management Services Product
Table 94. Unitex Revenue in Hospital Linen Supply and Management Services Business (2018-2023) & (US$ Million)
Table 95. Unitex Recent Development
Table 96. Crothall Company Details
Table 97. Crothall Business Overview
Table 98. Crothall Hospital Linen Supply and Management Services Product
Table 99. Crothall Revenue in Hospital Linen Supply and Management Services Business (2018-2023) & (US$ Million)
Table 100. Crothall Recent Development
Table 101. G&K Company Details
Table 102. G&K Business Overview
Table 103. G&K Hospital Linen Supply and Management Services Product
Table 104. G&K Revenue in Hospital Linen Supply and Management Services Business (2018-2023) & (US$ Million)
Table 105. G&K Recent Development
Table 106. Tokai Company Details
Table 107. Tokai Business Overview
Table 108. Tokai Hospital Linen Supply and Management Services Product
Table 109. Tokai Revenue in Hospital Linen Supply and Management Services Business (2018-2023) & (US$ Million)
Table 110. Tokai Recent Development
Table 111. Ecotex Company Details
Table 112. Ecotex Business Overview
Table 113. Ecotex Hospital Linen Supply and Management Services Product
Table 114. Ecotex Revenue in Hospital Linen Supply and Management Services Business (2018-2023) & (US$ Million)
Table 115. Ecotex Recent Development
Table 116. Elis Company Details
Table 117. Elis Business Overview
Table 118. Elis Hospital Linen Supply and Management Services Product
Table 119. Elis Revenue in Hospital Linen Supply and Management Services Business (2018-2023) & (US$ Million)
Table 120. Elis Recent Development
Table 121. Medline Company Details
Table 122. Medline Business Overview
Table 123. Medline Hospital Linen Supply and Management Services Product
Table 124. Medline Revenue in Hospital Linen Supply and Management Services Business (2018-2023) & (US$ Million)
Table 125. Medline Recent Development
Table 126. Salesianer Miettex Company Details
Table 127. Salesianer Miettex Business Overview
Table 128. Salesianer Miettex Hospital Linen Supply and Management Services Product
Table 129. Salesianer Miettex Revenue in Hospital Linen Supply and Management Services Business (2018-2023) & (US$ Million)
Table 130. Salesianer Miettex Recent Development
Table 131. PARIS Company Details
Table 132. PARIS Business Overview
Table 133. PARIS Hospital Linen Supply and Management Services Product
Table 134. PARIS Revenue in Hospital Linen Supply and Management Services Business (2018-2023) & (US$ Million)
Table 135. PARIS Recent Development
Table 136. Faultless Company Details
Table 137. Faultless Business Overview
Table 138. Faultless Hospital Linen Supply and Management Services Product
Table 139. Faultless Revenue in Hospital Linen Supply and Management Services Business (2018-2023) & (US$ Million)
Table 140. Faultless Recent Development
Table 141. HCSC Company Details
Table 142. HCSC Business Overview
Table 143. HCSC Hospital Linen Supply and Management Services Product
Table 144. HCSC Revenue in Hospital Linen Supply and Management Services Business (2018-2023) & (US$ Million)
Table 145. HCSC Recent Development
Table 146. CleanCare Company Details
Table 147. CleanCare Business Overview
Table 148. CleanCare Hospital Linen Supply and Management Services Product
Table 149. CleanCare Revenue in Hospital Linen Supply and Management Services Business (2018-2023) & (US$ Million)
Table 150. CleanCare Recent Development
Table 151. Superior Company Details
Table 152. Superior Business Overview
Table 153. Superior Hospital Linen Supply and Management Services Product
Table 154. Superior Revenue in Hospital Linen Supply and Management Services Business (2018-2023) & (US$ Million)
Table 155. Superior Recent Development
Table 156. Linen King Company Details
Table 157. Linen King Business Overview
Table 158. Linen King Hospital Linen Supply and Management Services Product
Table 159. Linen King Revenue in Hospital Linen Supply and Management Services Business (2018-2023) & (US$ Million)
Table 160. Linen King Recent Development
Table 161. Celtic Linen Company Details
Table 162. Celtic Linen Business Overview
Table 163. Celtic Linen Hospital Linen Supply and Management Services Product
Table 164. Celtic Linen Revenue in Hospital Linen Supply and Management Services Business (2018-2023) & (US$ Million)
Table 165. Celtic Linen Recent Development
Table 166. Economy Linen Company Details
Table 167. Economy Linen Business Overview
Table 168. Economy Linen Hospital Linen Supply and Management Services Product
Table 169. Economy Linen Revenue in Hospital Linen Supply and Management Services Business (2018-2023) & (US$ Million)
Table 170. Economy Linen Recent Development
Table 171. Tetsudo Linen Company Details
Table 172. Tetsudo Linen Business Overview
Table 173. Tetsudo Linen Hospital Linen Supply and Management Services Product
Table 174. Tetsudo Linen Revenue in Hospital Linen Supply and Management Services Business (2018-2023) & (US$ Million)
Table 175. Tetsudo Linen Recent Development
Table 176. Logan’s Company Details
Table 177. Logan’s Business Overview
Table 178. Logan’s Hospital Linen Supply and Management Services Product
Table 179. Logan’s Revenue in Hospital Linen Supply and Management Services Business (2018-2023) & (US$ Million)
Table 180. Logan’s Recent Development
Table 181. Fdr Services Company Details
Table 182. Fdr Services Business Overview
Table 183. Fdr Services Hospital Linen Supply and Management Services Product
Table 184. Fdr Services Revenue in Hospital Linen Supply and Management Services Business (2018-2023) & (US$ Million)
Table 185. Fdr Services Recent Development
Table 186. Clarus Company Details
Table 187. Clarus Business Overview
Table 188. Clarus Hospital Linen Supply and Management Services Product
Table 189. Clarus Revenue in Hospital Linen Supply and Management Services Business (2018-2023) & (US$ Million)
Table 190. Clarus Recent Development
Table 191. Florida Linen Company Details
Table 192. Florida Linen Business Overview
Table 193. Florida Linen Hospital Linen Supply and Management Services Product
Table 194. Florida Linen Revenue in Hospital Linen Supply and Management Services Business (2018-2023) & (US$ Million)
Table 195. Florida Linen Recent Development
Table 196. Research Programs/Design for This Report
Table 197. Key Data Information from Secondary Sources
Table 198. Key Data Information from Primary Sources
List of Figures
Figure 1. Hospital Linen Supply and Management Services Product Picture
Figure 2. Global Hospital Linen Supply and Management Services Market Size, (US$ Million), 2018 VS 2022 VS 2029
Figure 3. Global Hospital Linen Supply and Management Services Market Size 2018-2029 (US$ Million)
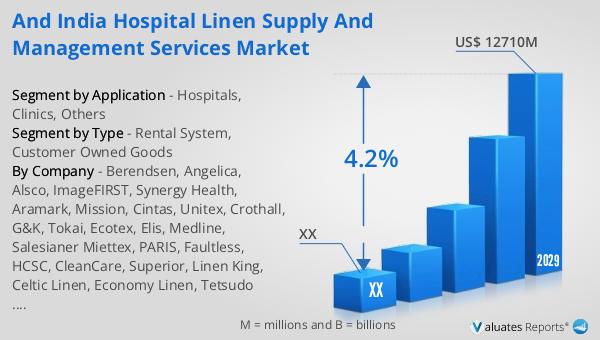
Figure 4. India Hospital Linen Supply and Management Services Market Size, (US$ Million), 2018 VS 2022 VS 2029
Figure 5. India Hospital Linen Supply and Management Services Market Size 2018-2029 (US$ Million)
Figure 6. India Hospital Linen Supply and Management Services Market Share in Global 2018-2029
Figure 7. Hospital Linen Supply and Management Services Report Years Considered
Figure 8. Product Picture of Rental System
Figure 9. Product Picture of Customer Owned Goods
Figure 10. Global Hospital Linen Supply and Management Services Market Share by Type in 2022 & 2029
Figure 11. Global Hospital Linen Supply and Management Services Market Size by Type (2018-2029) & (US$ Million)
Figure 12. Global Hospital Linen Supply and Management Services Market Share by Type (2018-2029)
Figure 13. India Hospital Linen Supply and Management Services Market Share by Type in 2022 & 2029
Figure 14. India Hospital Linen Supply and Management Services Market Size by Type (2018-2029) & (US$ Million)
Figure 15. India Hospital Linen Supply and Management Services Market Share by Type (2018-2029)
Figure 16. Product Picture of Hospitals
Figure 17. Product Picture of Clinics
Figure 18. Product Picture of Others
Figure 19. Global Hospital Linen Supply and Management Services Market Share by Application in 2022 & 2029
Figure 20. Global Hospital Linen Supply and Management Services Market Size by Application (2018-2029) & (US$ Million)
Figure 21. Global Hospital Linen Supply and Management Services Market Share by Application (2018-2029)
Figure 22. India Hospital Linen Supply and Management Services Market Share by Application in 2022 & 2029
Figure 23. India Hospital Linen Supply and Management Services Market Size by Application (2018-2029) & (US$ Million)
Figure 24. India Hospital Linen Supply and Management Services Market Share by Application (2018-2029)
Figure 25. The Top 5 and 10 Largest Companies of Hospital Linen Supply and Management Services in the World: Market Share by Hospital Linen Supply and Management Services Revenue in 2022
Figure 26. Global Hospital Linen Supply and Management Services Market Size Market Share by Region: 2018 VS 2022 VS 2029
Figure 27. Global Hospital Linen Supply and Management Services Market Share by Region (2018-2029)
Figure 28. Americas Hospital Linen Supply and Management Services Market Size Growth Rate 2018-2029 (US$ Million)
Figure 29. Americas Hospital Linen Supply and Management Services Market Share by Type (2018-2029)
Figure 30. Americas Hospital Linen Supply and Management Services Market Share by Application (2018-2029)
Figure 31. United States Hospital Linen Supply and Management Services Market Size Growth Rate (2018-2029) & (US$ Million)
Figure 32. Canada Hospital Linen Supply and Management Services Market Size Growth Rate (2018-2029) & (US$ Million)
Figure 33. Mexico Hospital Linen Supply and Management Services Market Size Growth Rate (2018-2029) & (US$ Million)
Figure 34. Brazil Hospital Linen Supply and Management Services Market Size Growth Rate (2018-2029) & (US$ Million)
Figure 35. EMEA Hospital Linen Supply and Management Services Market Size Growth Rate 2018-2029 (US$ Million)
Figure 36. EMEA Hospital Linen Supply and Management Services Market Share by Type (2018-2029)
Figure 37. EMEA Hospital Linen Supply and Management Services Market Share by Application (2018-2029)
Figure 38. Europe Hospital Linen Supply and Management Services Market Size Growth Rate (2018-2029) & (US$ Million)
Figure 39. Middle East Hospital Linen Supply and Management Services Market Size Growth Rate (2018-2029) & (US$ Million)
Figure 40. Africa Hospital Linen Supply and Management Services Market Size Growth Rate (2018-2029) & (US$ Million)
Figure 41. China Hospital Linen Supply and Management Services Market Size Growth Rate 2018-2029 (US$ Million)
Figure 42. China Hospital Linen Supply and Management Services Market Share by Type (2018-2029)
Figure 43. China Hospital Linen Supply and Management Services Market Share by Application (2018-2029)
Figure 44. APAC Hospital Linen Supply and Management Services Market Size Growth Rate 2018-2029 (US$ Million)
Figure 45. APAC Hospital Linen Supply and Management Services Market Share by Type (2018-2029)
Figure 46. APAC Hospital Linen Supply and Management Services Market Share by Application (2018-2029)
Figure 47. Japan Hospital Linen Supply and Management Services Market Size Growth Rate (2018-2029) & (US$ Million)
Figure 48. South Korea Hospital Linen Supply and Management Services Market Size Growth Rate (2018-2029) & (US$ Million)
Figure 49. China Taiwan Hospital Linen Supply and Management Services Market Size Growth Rate (2018-2029) & (US$ Million)
Figure 50. Southeast Asia Hospital Linen Supply and Management Services Market Size Growth Rate (2018-2029) & (US$ Million)
Figure 51. India Hospital Linen Supply and Management Services Market Size Growth Rate (2018-2029) & (US$ Million)
Figure 52. Berendsen Revenue Growth Rate in Hospital Linen Supply and Management Services Business (2018-2023)
Figure 53. Angelica Revenue Growth Rate in Hospital Linen Supply and Management Services Business (2018-2023)
Figure 54. Alsco Revenue Growth Rate in Hospital Linen Supply and Management Services Business (2018-2023)
Figure 55. ImageFIRST Revenue Growth Rate in Hospital Linen Supply and Management Services Business (2018-2023)
Figure 56. Synergy Health Revenue Growth Rate in Hospital Linen Supply and Management Services Business (2018-2023)
Figure 57. Aramark Revenue Growth Rate in Hospital Linen Supply and Management Services Business (2018-2023)
Figure 58. Mission Revenue Growth Rate in Hospital Linen Supply and Management Services Business (2018-2023)
Figure 59. Cintas Revenue Growth Rate in Hospital Linen Supply and Management Services Business (2018-2023)
Figure 60. Unitex Revenue Growth Rate in Hospital Linen Supply and Management Services Business (2018-2023)
Figure 61. Crothall Revenue Growth Rate in Hospital Linen Supply and Management Services Business (2018-2023)
Figure 62. G&K Revenue Growth Rate in Hospital Linen Supply and Management Services Business (2018-2023)
Figure 63. Tokai Revenue Growth Rate in Hospital Linen Supply and Management Services Business (2018-2023)
Figure 64. Ecotex Revenue Growth Rate in Hospital Linen Supply and Management Services Business (2018-2023)
Figure 65. Elis Revenue Growth Rate in Hospital Linen Supply and Management Services Business (2018-2023)
Figure 66. Medline Revenue Growth Rate in Hospital Linen Supply and Management Services Business (2018-2023)
Figure 67. Salesianer Miettex Revenue Growth Rate in Hospital Linen Supply and Management Services Business (2018-2023)
Figure 68. PARIS Revenue Growth Rate in Hospital Linen Supply and Management Services Business (2018-2023)
Figure 69. Faultless Revenue Growth Rate in Hospital Linen Supply and Management Services Business (2018-2023)
Figure 70. HCSC Revenue Growth Rate in Hospital Linen Supply and Management Services Business (2018-2023)
Figure 71. CleanCare Revenue Growth Rate in Hospital Linen Supply and Management Services Business (2018-2023)
Figure 72. Superior Revenue Growth Rate in Hospital Linen Supply and Management Services Business (2018-2023)
Figure 73. Linen King Revenue Growth Rate in Hospital Linen Supply and Management Services Business (2018-2023)
Figure 74. Celtic Linen Revenue Growth Rate in Hospital Linen Supply and Management Services Business (2018-2023)
Figure 75. Economy Linen Revenue Growth Rate in Hospital Linen Supply and Management Services Business (2018-2023)
Figure 76. Tetsudo Linen Revenue Growth Rate in Hospital Linen Supply and Management Services Business (2018-2023)
Figure 77. Logan’s Revenue Growth Rate in Hospital Linen Supply and Management Services Business (2018-2023)
Figure 78. Fdr Services Revenue Growth Rate in Hospital Linen Supply and Management Services Business (2018-2023)
Figure 79. Clarus Revenue Growth Rate in Hospital Linen Supply and Management Services Business (2018-2023)
Figure 80. Florida Linen Revenue Growth Rate in Hospital Linen Supply and Management Services Business (2018-2023)
Figure 81. Bottom-up and Top-down Approaches for This Report
Figure 82. Data Triangulation
Figure 83. Key Executives Interviewed