
The global Blockchain Supply Chain Finance market size is projected to reach US$ 126170 million by 2028, from US$ 16260 million in 2021, at a CAGR of 33.6% during 2022-2028. Key drivers of the blockchain supply chain finance market include the rising use of blockchain in supply chain finance. The advent of advanced technologies will fuel the demand for the blockchain supply chain finance market during the forecast period. Furthermore, the integration with IoT will provide lucrative growth opportunities in the upcoming years.
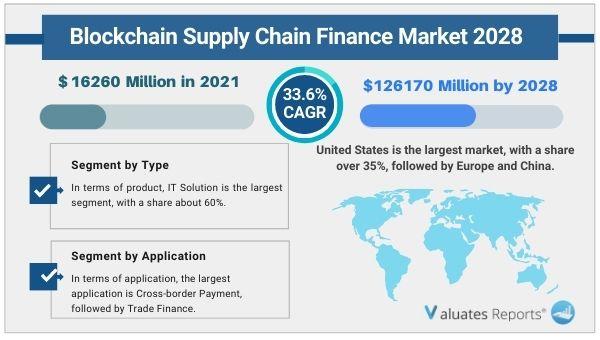
Global Blockchain Supply Chain Finance key players include IBM, Ripple, Accenture, etc. Global top three manufacturers hold a share of about 55%. The United States is the largest market, with a share of over 35%, followed by Europe and China, both have a share of about 45 percent. In terms of product, IT Solution is the largest segment, with a share of about 60%. And in terms of application, the largest application is Cross-border Payment, followed by Trade Finance. Blockchain Supply Chain Finance is the application of blockchain technology in the financial field. The financial services industry is the driving force of global economic development and is also one of the most centered industries. The asymmetric information between the two parties in the financial market leads to the failure to establish an effective credit mechanism.
Financial institutions and banks can easily verify the transaction details between a supplier and a retailer through blockchain. All the data regarding payments, invoicing, physical transfer of goods, and lending transactions are recorded efficiently in the distributed ledgers. This removes the need for physical audits and makes the process cost-effective. The risk factors are eliminated. Smart contracts can verify the contractual obligations and issue payment alerts whenever the time comes. Cross-border payment systems will benefit immensely. Hence these factors will surge the growth of the blockchain supply chain finance market in the upcoming years.
Technological developmentsThe rapid innovations in blockchain technology are being felt across several industry verticals. Intermediaries in the supply chain can be removed completely lowering costs. As it is a distributed system the transparency levels are high thereby preventing opaqueness in the financial industry. Each and every transaction follows a predictable, pre-approved route and since they are irrevocable the chances of fraud are much less than before. Data privacy is upheld as every consumer is in full control of their confidential information online. These will drive the growth of the blockchain supply chain finance market during the forecast period.
Blockchain and IoT integrationIoT-enabled blockchain will solve many critical issues faced by the supply chain industry. For instance, data sharing will become fast providing traceability across the entire supply chain process. Access to information will be universal without the ownership of a single entity removing chances of fraud. Moreover, IoT will facilitate the seamless flow of information from the physical world regarding materials, and goods to the digital space. The advanced monitoring will ensure the auditing process is free of any human errors. This in turn will augment the growth of the blockchain supply chain finance market in the future.
Lack of awarenessThere is a general lack of knowledge and awareness regarding the technology as it is still new. Companies are coming up with their own versions of the same network creating the problem of silos. Then there are regulations that have not been able to keep pace with the rapid changes in the field. These issues will hamper the general growth prospects of the blockchain supply chain finance market during the forecast period.
Based on type, the IT segment is expected to maintain the lead in the blockchain supply chain finance market share with 60% penetration.
Based on application, cross-border payments will provide lucrative opportunities for growth in the blockchain supply chain finance market share.
Based on region, North America will witness considerable growth with the US capturing about 35% market share followed by Europe and China at a total share of 45%.
|
Report Metric |
Details |
|
Report Name |
Blockchain Supply Chain Finance Market |
|
The market size in 2021 |
$16260 Million |
|
The revenue forecast in 2028 |
$126170 Million |
|
Growth Rate |
CAGR of 33.6% from 2022 to 2028 |
|
Base year considered |
2022 |
|
Forecast period |
2022-2028 |
|
Forecast units |
Value (USD) |
|
Segments covered |
Type, End-User, Offerings, and Region |
|
Market by Type |
IT Solution, FinTech, Bank, Consulting, Exchange and Other |
|
Market by Applications/Enduser |
Cross-border Payment, Trade Finance, Digital Currency, Identity Management, Others |
|
Report coverage |
Revenue & volume forecast, company share, competitive landscape, growth factors, and trends |
|
Geographic regions covered |
North America, Europe, Asia Pacific, Latin America, Middle East & Africa |
Ans. The global Blockchain Supply Chain Finance market size is projected to reach US$ 126170 million by 2028, from US$ 16260 million in 2021.
Ans. Some key players operating in the blockchain supply chain finance market are IBM, Ripple, Rubix by Deloitte, Accenture, Plc Distributed Ledger Technologies, Oklink, Nasdaq Linq, Oracle. AWS, Citi Bank.
Ans. The global blockchain supply chain finance market is estimated to grow with a Compound Annual Growth Rate (CAGR) of 33.6% during the forecast period
Ans. Yes, the report includes a COVID-19 impact analysis. Also, it is further extended into every individual segment of the report.
Ans. The United States is the largest consumption countries of blockchain supply chain finance in the world in the past few years and it will keep increasing in the next few years.
Table of Contents
1 Report Business Overview
1.1 Study Scope
1.2 Market Analysis by Type
1.2.1 Global Blockchain Supply Chain Finance Market Size Growth Rate by Type, 2017 VS 2021 VS 2028
1.2.2 IT Solution
1.2.3 FinTech
1.2.4 Bank
1.2.5 Consulting
1.2.6 Exchange and Other
1.3 Market by Application
1.3.1 Global Blockchain Supply Chain Finance Market Size Growth Rate by Application, 2017 VS 2021 VS 2028
1.3.2 Cross-border Payment
1.3.3 Trade Finance
1.3.4 Digital Currency
1.3.5 Identity Management
1.3.6 Others
1.4 Study Objectives
1.5 Years Considered
2 Global Growth Trends
2.1 Global Blockchain Supply Chain Finance Market Perspective (2017-2028)
2.2 Blockchain Supply Chain Finance Growth Trends by Region
2.2.1 Blockchain Supply Chain Finance Market Size by Region: 2017 VS 2021 VS 2028
2.2.2 Blockchain Supply Chain Finance Historic Market Size by Region (2017-2022)
2.2.3 Blockchain Supply Chain Finance Forecasted Market Size by Region (2023-2028)
2.3 Blockchain Supply Chain Finance Market Dynamics
2.3.1 Blockchain Supply Chain Finance Industry Trends
2.3.2 Blockchain Supply Chain Finance Market Drivers
2.3.3 Blockchain Supply Chain Finance Market Challenges
2.3.4 Blockchain Supply Chain Finance Market Restraints
3 Competition Landscape by Key Players
3.1 Global Top Blockchain Supply Chain Finance Players by Revenue
3.1.1 Global Top Blockchain Supply Chain Finance Players by Revenue (2017-2022)
3.1.2 Global Blockchain Supply Chain Finance Revenue Market Share by Players (2017-2022)
3.2 Global Blockchain Supply Chain Finance Market Share by Company Type (Tier 1, Tier 2, and Tier 3)
3.3 Players Covered: Ranking by Blockchain Supply Chain Finance Revenue
3.4 Global Blockchain Supply Chain Finance Market Concentration Ratio
3.4.1 Global Blockchain Supply Chain Finance Market Concentration Ratio (CR5 and HHI)
3.4.2 Global Top 10 and Top 5 Companies by Blockchain Supply Chain Finance Revenue in 2021
3.5 Blockchain Supply Chain Finance Key Players Head office and Area Served
3.6 Key Players Blockchain Supply Chain Finance Product Solution and Service
3.7 Date of Enter into Blockchain Supply Chain Finance Market
3.8 Mergers & Acquisitions, Expansion Plans
4 Blockchain Supply Chain Finance Breakdown Data by Type
4.1 Global Blockchain Supply Chain Finance Historic Market Size by Type (2017-2022)
4.2 Global Blockchain Supply Chain Finance Forecasted Market Size by Type (2023-2028)
5 Blockchain Supply Chain Finance Breakdown Data by Application
5.1 Global Blockchain Supply Chain Finance Historic Market Size by Application (2017-2022)
5.2 Global Blockchain Supply Chain Finance Forecasted Market Size by Application (2023-2028)
6 North America
6.1 North America Blockchain Supply Chain Finance Market Size (2017-2028)
6.2 North America Blockchain Supply Chain Finance Market Size by Type
6.2.1 North America Blockchain Supply Chain Finance Market Size by Type (2017-2022)
6.2.2 North America Blockchain Supply Chain Finance Market Size by Type (2023-2028)
6.2.3 North America Blockchain Supply Chain Finance Market Share by Type (2017-2028)
6.3 North America Blockchain Supply Chain Finance Market Size by Application
6.3.1 North America Blockchain Supply Chain Finance Market Size by Application (2017-2022)
6.3.2 North America Blockchain Supply Chain Finance Market Size by Application (2023-2028)
6.3.3 North America Blockchain Supply Chain Finance Market Share by Application (2017-2028)
6.4 North America Blockchain Supply Chain Finance Market Size by Country
6.4.1 North America Blockchain Supply Chain Finance Market Size by Country (2017-2022)
6.4.2 North America Blockchain Supply Chain Finance Market Size by Country (2023-2028)
6.4.3 U.S.
6.4.4 Canada
7 Europe
7.1 Europe Blockchain Supply Chain Finance Market Size (2017-2028)
7.2 Europe Blockchain Supply Chain Finance Market Size by Type
7.2.1 Europe Blockchain Supply Chain Finance Market Size by Type (2017-2022)
7.2.2 Europe Blockchain Supply Chain Finance Market Size by Type (2023-2028)
7.2.3 Europe Blockchain Supply Chain Finance Market Share by Type (2017-2028)
7.3 Europe Blockchain Supply Chain Finance Market Size by Application
7.3.1 Europe Blockchain Supply Chain Finance Market Size by Application (2017-2022)
7.3.2 Europe Blockchain Supply Chain Finance Market Size by Application (2023-2028)
7.3.3 Europe Blockchain Supply Chain Finance Market Share by Application (2017-2028)
7.4 Europe Blockchain Supply Chain Finance Market Size by Country
7.4.1 Europe Blockchain Supply Chain Finance Market Size by Country (2017-2022)
7.4.2 Europe Blockchain Supply Chain Finance Market Size by Country (2023-2028)
7.4.3 Germany
7.4.4 France
7.4.5 U.K.
7.4.6 Italy
7.4.7 Russia
7.4.8 Nordic Countries
8 Asia-Pacific
8.1 Asia-Pacific Blockchain Supply Chain Finance Market Size (2017-2028)
8.2 Asia-Pacific Blockchain Supply Chain Finance Market Size by Type
8.2.1 Asia-Pacific Blockchain Supply Chain Finance Market Size by Type (2017-2022)
8.2.2 Asia-Pacific Blockchain Supply Chain Finance Market Size by Type (2023-2028)
8.2.3 Asia-Pacific Blockchain Supply Chain Finance Market Share by Type (2017-2028)
8.3 Asia-Pacific Blockchain Supply Chain Finance Market Size by Application
8.3.1 Asia-Pacific Blockchain Supply Chain Finance Market Size by Application (2017-2022)
8.3.2 Asia-Pacific Blockchain Supply Chain Finance Market Size by Application (2023-2028)
8.3.3 Asia-Pacific Blockchain Supply Chain Finance Market Share by Application (2017-2028)
8.4 Asia-Pacific Blockchain Supply Chain Finance Market Size by Region
8.4.1 Asia-Pacific Blockchain Supply Chain Finance Market Size by Region (2017-2022)
8.4.2 Asia-Pacific Blockchain Supply Chain Finance Market Size by Region (2023-2028)
8.4.3 China
8.4.4 Japan
8.4.5 South Korea
8.4.6 Southeast Asia
8.4.7 India
8.4.8 Australia
9 Latin America
9.1 Latin America Blockchain Supply Chain Finance Market Size (2017-2028)
9.2 Latin America Blockchain Supply Chain Finance Market Size by Type
9.2.1 Latin America Blockchain Supply Chain Finance Market Size by Type (2017-2022)
9.2.2 Latin America Blockchain Supply Chain Finance Market Size by Type (2023-2028)
9.2.3 Latin America Blockchain Supply Chain Finance Market Share by Type (2017-2028)
9.3 Latin America Blockchain Supply Chain Finance Market Size by Application
9.3.1 Latin America Blockchain Supply Chain Finance Market Size by Application (2017-2022)
9.3.2 Latin America Blockchain Supply Chain Finance Market Size by Application (2023-2028)
9.3.3 Latin America Blockchain Supply Chain Finance Market Share by Application (2017-2028)
9.4 Latin America Blockchain Supply Chain Finance Market Size by Country
9.4.1 Latin America Blockchain Supply Chain Finance Market Size by Country (2017-2022)
9.4.2 Latin America Blockchain Supply Chain Finance Market Size by Country (2023-2028)
9.4.3 Mexico
9.4.4 Brazil
10 Middle East & Africa
10.1 Middle East & Africa Blockchain Supply Chain Finance Market Size (2017-2028)
10.2 Middle East & Africa Blockchain Supply Chain Finance Market Size by Type
10.2.1 Middle East & Africa Blockchain Supply Chain Finance Market Size by Type (2017-2022)
10.2.2 Middle East & Africa Blockchain Supply Chain Finance Market Size by Type (2023-2028)
10.2.3 Middle East & Africa Blockchain Supply Chain Finance Market Share by Type (2017-2028)
10.3 Middle East & Africa Blockchain Supply Chain Finance Market Size by Application
10.3.1 Middle East & Africa Blockchain Supply Chain Finance Market Size by Application (2017-2022)
10.3.2 Middle East & Africa Blockchain Supply Chain Finance Market Size by Application (2023-2028)
10.3.3 Middle East & Africa Blockchain Supply Chain Finance Market Share by Application (2017-2028)
10.4 Middle East & Africa Blockchain Supply Chain Finance Market Size by Country
10.4.1 Middle East & Africa Blockchain Supply Chain Finance Market Size by Country (2017-2022)
10.4.2 Middle East & Africa Blockchain Supply Chain Finance Market Size by Country (2023-2028)
10.4.3 Turkey
10.4.4 Saudi Arabia
10.4.5 UAE
11 Key Players Profiles
11.1 IBM
11.1.1 IBM Company Details
11.1.2 IBM Business Overview
11.1.3 IBM Blockchain Supply Chain Finance Introduction
11.1.4 IBM Revenue in Blockchain Supply Chain Finance Business (2017-2022)
11.1.5 IBM Recent Developments
11.2 Ripple
11.2.1 Ripple Company Details
11.2.2 Ripple Business Overview
11.2.3 Ripple Blockchain Supply Chain Finance Introduction
11.2.4 Ripple Revenue in Blockchain Supply Chain Finance Business (2017-2022)
11.2.5 Ripple Recent Developments
11.3 Rubix by Deloitte
11.3.1 Rubix by Deloitte Company Details
11.3.2 Rubix by Deloitte Business Overview
11.3.3 Rubix by Deloitte Blockchain Supply Chain Finance Introduction
11.3.4 Rubix by Deloitte Revenue in Blockchain Supply Chain Finance Business (2017-2022)
11.3.5 Rubix by Deloitte Recent Developments
11.4 Accenture
11.4.1 Accenture Company Details
11.4.2 Accenture Business Overview
11.4.3 Accenture Blockchain Supply Chain Finance Introduction
11.4.4 Accenture Revenue in Blockchain Supply Chain Finance Business (2017-2022)
11.4.5 Accenture Recent Developments
11.5 Distributed Ledger Technologies
11.5.1 Distributed Ledger Technologies Company Details
11.5.2 Distributed Ledger Technologies Business Overview
11.5.3 Distributed Ledger Technologies Blockchain Supply Chain Finance Introduction
11.5.4 Distributed Ledger Technologies Revenue in Blockchain Supply Chain Finance Business (2017-2022)
11.5.5 Distributed Ledger Technologies Recent Developments
11.6 Oklink
11.6.1 Oklink Company Details
11.6.2 Oklink Business Overview
11.6.3 Oklink Blockchain Supply Chain Finance Introduction
11.6.4 Oklink Revenue in Blockchain Supply Chain Finance Business (2017-2022)
11.6.5 Oklink Recent Developments
11.7 Nasdaq Linq
11.7.1 Nasdaq Linq Company Details
11.7.2 Nasdaq Linq Business Overview
11.7.3 Nasdaq Linq Blockchain Supply Chain Finance Introduction
11.7.4 Nasdaq Linq Revenue in Blockchain Supply Chain Finance Business (2017-2022)
11.7.5 Nasdaq Linq Recent Developments
11.8 Oracle
11.8.1 Oracle Company Details
11.8.2 Oracle Business Overview
11.8.3 Oracle Blockchain Supply Chain Finance Introduction
11.8.4 Oracle Revenue in Blockchain Supply Chain Finance Business (2017-2022)
11.8.5 Oracle Recent Developments
11.9 AWS
11.9.1 AWS Company Details
11.9.2 AWS Business Overview
11.9.3 AWS Blockchain Supply Chain Finance Introduction
11.9.4 AWS Revenue in Blockchain Supply Chain Finance Business (2017-2022)
11.9.5 AWS Recent Developments
11.10 Citi Bank
11.10.1 Citi Bank Company Details
11.10.2 Citi Bank Business Overview
11.10.3 Citi Bank Blockchain Supply Chain Finance Introduction
11.10.4 Citi Bank Revenue in Blockchain Supply Chain Finance Business (2017-2022)
11.10.5 Citi Bank Recent Developments
11.11 ELayaway
11.11.1 ELayaway Company Details
11.11.2 ELayaway Business Overview
11.11.3 ELayaway Blockchain Supply Chain Finance Introduction
11.11.4 ELayaway Revenue in Blockchain Supply Chain Finance Business (2017-2022)
11.11.5 ELayaway Recent Developments
11.12 HSBC
11.12.1 HSBC Company Details
11.12.2 HSBC Business Overview
11.12.3 HSBC Blockchain Supply Chain Finance Introduction
11.12.4 HSBC Revenue in Blockchain Supply Chain Finance Business (2017-2022)
11.12.5 HSBC Recent Developments
11.13 Ant Financial
11.13.1 Ant Financial Company Details
11.13.2 Ant Financial Business Overview
11.13.3 Ant Financial Blockchain Supply Chain Finance Introduction
11.13.4 Ant Financial Revenue in Blockchain Supply Chain Finance Business (2017-2022)
11.13.5 Ant Financial Recent Developments
11.14 JD Financial
11.14.1 JD Financial Company Details
11.14.2 JD Financial Business Overview
11.14.3 JD Financial Blockchain Supply Chain Finance Introduction
11.14.4 JD Financial Revenue in Blockchain Supply Chain Finance Business (2017-2022)
11.14.5 JD Financial Recent Developments
11.15 Qihoo 360
11.15.1 Qihoo 360 Company Details
11.15.2 Qihoo 360 Business Overview
11.15.3 Qihoo 360 Blockchain Supply Chain Finance Introduction
11.15.4 Qihoo 360 Revenue in Blockchain Supply Chain Finance Business (2017-2022)
11.15.5 Qihoo 360 Recent Developments
11.16 Tecent
11.16.1 Tecent Company Details
11.16.2 Tecent Business Overview
11.16.3 Tecent Blockchain Supply Chain Finance Introduction
11.16.4 Tecent Revenue in Blockchain Supply Chain Finance Business (2017-2022)
11.16.5 Tecent Recent Developments
11.17 Baidu
11.17.1 Baidu Company Details
11.17.2 Baidu Business Overview
11.17.3 Baidu Blockchain Supply Chain Finance Introduction
11.17.4 Baidu Revenue in Blockchain Supply Chain Finance Business (2017-2022)
11.17.5 Baidu Recent Developments
11.18 Huawei
11.18.1 Huawei Company Details
11.18.2 Huawei Business Overview
11.18.3 Huawei Blockchain Supply Chain Finance Introduction
11.18.4 Huawei Revenue in Blockchain Supply Chain Finance Business (2017-2022)
11.18.5 Huawei Recent Developments
11.19 Bitspark
11.19.1 Bitspark Company Details
11.19.2 Bitspark Business Overview
11.19.3 Bitspark Blockchain Supply Chain Finance Introduction
11.19.4 Bitspark Revenue in Blockchain Supply Chain Finance Business (2017-2022)
11.19.5 Bitspark Recent Developments
11.20 SAP
11.20.1 SAP Company Details
11.20.2 SAP Business Overview
11.20.3 SAP Blockchain Supply Chain Finance Introduction
11.20.4 SAP Revenue in Blockchain Supply Chain Finance Business (2017-2022)
11.20.5 SAP Recent Developments
12 Analyst's Viewpoints/Conclusions
13 Appendix
13.1 Research Methodology
13.1.1 Methodology/Research Approach
13.1.2 Data Source
13.2 Author Details
13.3 Disclaimer
List of Tables
Table 1. Global Blockchain Supply Chain Finance Market Size Growth Rate by Type (US$ Million), 2017 VS 2021 VS 2028
Table 2. Key Players of IT Solution
Table 3. Key Players of FinTech
Table 4. Key Players of Bank
Table 5. Key Players of Consulting
Table 6. Key Players of Exchange and Other
Table 7. Global Blockchain Supply Chain Finance Market Size Growth Rate by Application (US$ Million), 2017 VS 2021 VS 2028
Table 8. Global Blockchain Supply Chain Finance Market Size by Region (US$ Million): 2017 VS 2021 VS 2028
Table 9. Global Blockchain Supply Chain Finance Market Size by Region (2017-2022) & (US$ Million)
Table 10. Global Blockchain Supply Chain Finance Market Share by Region (2017-2022)
Table 11. Global Blockchain Supply Chain Finance Forecasted Market Size by Region (2023-2028) & (US$ Million)
Table 12. Global Blockchain Supply Chain Finance Market Share by Region (2023-2028)
Table 13. Blockchain Supply Chain Finance Market Trends
Table 14. Blockchain Supply Chain Finance Market Drivers
Table 15. Blockchain Supply Chain Finance Market Challenges
Table 16. Blockchain Supply Chain Finance Market Restraints
Table 17. Global Blockchain Supply Chain Finance Revenue by Players (2017-2022) & (US$ Million)
Table 18. Global Blockchain Supply Chain Finance Revenue Share by Players (2017-2022)
Table 19. Global Top Blockchain Supply Chain Finance by Company Type (Tier 1, Tier 2, and Tier 3) & (based on the Revenue in Blockchain Supply Chain Finance as of 2021)
Table 20. Ranking of Global Top Blockchain Supply Chain Finance Companies by Revenue (US$ Million) in 2021
Table 21. Global 5 Largest Players Market Share by Blockchain Supply Chain Finance Revenue (CR5 and HHI) & (2017-2022)
Table 22. Key Players Headquarters and Area Served
Table 23. Key Players Blockchain Supply Chain Finance Product Solution and Service
Table 24. Date of Enter into Blockchain Supply Chain Finance Market
Table 25. Mergers & Acquisitions, Expansion Plans
Table 26. Global Blockchain Supply Chain Finance Market Size by Type (2017-2022) & (US$ Million)
Table 27. Global Blockchain Supply Chain Finance Revenue Market Share by Type (2017-2022)
Table 28. Global Blockchain Supply Chain Finance Forecasted Market Size by Type (2023-2028) & (US$ Million)
Table 29. Global Blockchain Supply Chain Finance Revenue Market Share by Type (2023-2028)
Table 30. Global Blockchain Supply Chain Finance Market Size by Application (2017-2022) & (US$ Million)
Table 31. Global Blockchain Supply Chain Finance Revenue Share by Application (2017-2022)
Table 32. Global Blockchain Supply Chain Finance Forecasted Market Size by Application (2023-2028) & (US$ Million)
Table 33. Global Blockchain Supply Chain Finance Revenue Share by Application (2023-2028)
Table 34. North America Blockchain Supply Chain Finance Market Size by Type (2017-2022) & (US$ Million)
Table 35. North America Blockchain Supply Chain Finance Market Size by Type (2023-2028) & (US$ Million)
Table 36. North America Blockchain Supply Chain Finance Market Size by Application (2017-2022) & (US$ Million)
Table 37. North America Blockchain Supply Chain Finance Market Size by Application (2023-2028) & (US$ Million)
Table 38. North America Blockchain Supply Chain Finance Market Size by Country (2017-2022) & (US$ Million)
Table 39. North America Blockchain Supply Chain Finance Market Size by Country (2023-2028) & (US$ Million)
Table 40. Europe Blockchain Supply Chain Finance Market Size by Type (2017-2022) & (US$ Million)
Table 41. Europe Blockchain Supply Chain Finance Market Size by Type (2023-2028) & (US$ Million)
Table 42. Europe Blockchain Supply Chain Finance Market Size by Application (2017-2022) & (US$ Million)
Table 43. Europe Blockchain Supply Chain Finance Market Size by Application (2023-2028) & (US$ Million)
Table 44. Europe Blockchain Supply Chain Finance Market Size by Country (2017-2022) & (US$ Million)
Table 45. Europe Blockchain Supply Chain Finance Market Size by Country (2023-2028) & (US$ Million)
Table 46. Asia Pacific Blockchain Supply Chain Finance Market Size by Type (2017-2022) & (US$ Million)
Table 47. Asia Pacific Blockchain Supply Chain Finance Market Size by Type (2023-2028) & (US$ Million)
Table 48. Asia Pacific Blockchain Supply Chain Finance Market Size by Application (2017-2022) & (US$ Million)
Table 49. Asia Pacific Blockchain Supply Chain Finance Market Size by Application (2023-2028) & (US$ Million)
Table 50. Asia Pacific Blockchain Supply Chain Finance Market Size by Region (2017-2022) & (US$ Million)
Table 51. Asia Pacific Blockchain Supply Chain Finance Market Size by Region (2023-2028) & (US$ Million)
Table 52. Latin America Blockchain Supply Chain Finance Market Size by Type (2017-2022) & (US$ Million)
Table 53. Latin America Blockchain Supply Chain Finance Market Size by Type (2023-2028) & (US$ Million)
Table 54. Latin America Blockchain Supply Chain Finance Market Size by Application (2017-2022) & (US$ Million)
Table 55. Latin America Blockchain Supply Chain Finance Market Size by Application (2023-2028) & (US$ Million)
Table 56. Latin America Blockchain Supply Chain Finance Market Size by Country (2017-2022) & (US$ Million)
Table 57. Latin America Blockchain Supply Chain Finance Market Size by Country (2023-2028) & (US$ Million)
Table 58. Middle East and Africa Blockchain Supply Chain Finance Market Size by Type (2017-2022) & (US$ Million)
Table 59. Middle East and Africa Blockchain Supply Chain Finance Market Size by Type (2023-2028) & (US$ Million)
Table 60. Middle East and Africa Blockchain Supply Chain Finance Market Size by Application (2017-2022) & (US$ Million)
Table 61. Middle East and Africa Blockchain Supply Chain Finance Market Size by Application (2023-2028) & (US$ Million)
Table 62. Middle East and Africa Blockchain Supply Chain Finance Market Size by Country (2017-2022) & (US$ Million)
Table 63. Middle East and Africa Blockchain Supply Chain Finance Market Size by Country (2023-2028) & (US$ Million)
Table 64. IBM Company Details
Table 65. IBM Business Overview
Table 66. IBM Blockchain Supply Chain Finance Product
Table 67. IBM Revenue in Blockchain Supply Chain Finance Business (2017-2022) & (US$ Million)
Table 68. IBM Recent Developments
Table 69. Ripple Company Details
Table 70. Ripple Business Overview
Table 71. Ripple Blockchain Supply Chain Finance Product
Table 72. Ripple Revenue in Blockchain Supply Chain Finance Business (2017-2022) & (US$ Million)
Table 73. Ripple Recent Developments
Table 74. Rubix by Deloitte Company Details
Table 75. Rubix by Deloitte Business Overview
Table 76. Rubix by Deloitte Blockchain Supply Chain Finance Product
Table 77. Rubix by Deloitte Revenue in Blockchain Supply Chain Finance Business (2017-2022) & (US$ Million)
Table 78. Rubix by Deloitte Recent Developments
Table 79. Accenture Company Details
Table 80. Accenture Business Overview
Table 81. Accenture Blockchain Supply Chain Finance Product
Table 82. Accenture Revenue in Blockchain Supply Chain Finance Business (2017-2022) & (US$ Million)
Table 83. Accenture Recent Developments
Table 84. Distributed Ledger Technologies Company Details
Table 85. Distributed Ledger Technologies Business Overview
Table 86. Distributed Ledger Technologies Blockchain Supply Chain Finance Product
Table 87. Distributed Ledger Technologies Revenue in Blockchain Supply Chain Finance Business (2017-2022) & (US$ Million)
Table 88. Distributed Ledger Technologies Recent Developments
Table 89. Oklink Company Details
Table 90. Oklink Business Overview
Table 91. Oklink Blockchain Supply Chain Finance Product
Table 92. Oklink Revenue in Blockchain Supply Chain Finance Business (2017-2022) & (US$ Million)
Table 93. Oklink Recent Developments
Table 94. Nasdaq Linq Company Details
Table 95. Nasdaq Linq Business Overview
Table 96. Nasdaq Linq Blockchain Supply Chain Finance Product
Table 97. Nasdaq Linq Revenue in Blockchain Supply Chain Finance Business (2017-2022) & (US$ Million)
Table 98. Nasdaq Linq Recent Developments
Table 99. Oracle Company Details
Table 100. Oracle Business Overview
Table 101. Oracle Blockchain Supply Chain Finance Product
Table 102. Oracle Revenue in Blockchain Supply Chain Finance Business (2017-2022) & (US$ Million)
Table 103. Oracle Recent Developments
Table 104. AWS Company Details
Table 105. AWS Business Overview
Table 106. AWS Blockchain Supply Chain Finance Product
Table 107. AWS Revenue in Blockchain Supply Chain Finance Business (2017-2022) & (US$ Million)
Table 108. AWS Recent Developments
Table 109. Citi Bank Company Details
Table 110. Citi Bank Business Overview
Table 111. Citi Bank Blockchain Supply Chain Finance Product
Table 112. Citi Bank Revenue in Blockchain Supply Chain Finance Business (2017-2022) & (US$ Million)
Table 113. Citi Bank Recent Developments
Table 114. ELayaway Company Details
Table 115. ELayaway Business Overview
Table 116. ELayaway Blockchain Supply Chain Finance Product
Table 117. ELayaway Revenue in Blockchain Supply Chain Finance Business (2017-2022) & (US$ Million)
Table 118. ELayaway Recent Developments
Table 119. HSBC Company Details
Table 120. HSBC Business Overview
Table 121. HSBC Blockchain Supply Chain Finance Product
Table 122. HSBC Revenue in Blockchain Supply Chain Finance Business (2017-2022) & (US$ Million)
Table 123. HSBC Recent Developments
Table 124. Ant Financial Company Details
Table 125. Ant Financial Business Overview
Table 126. Ant Financial Blockchain Supply Chain Finance Product
Table 127. Ant Financial Revenue in Blockchain Supply Chain Finance Business (2017-2022) & (US$ Million)
Table 128. Ant Financial Recent Developments
Table 129. JD Financial Company Details
Table 130. JD Financial Business Overview
Table 131. JD Financial Blockchain Supply Chain Finance Product
Table 132. JD Financial Revenue in Blockchain Supply Chain Finance Business (2017-2022) & (US$ Million)
Table 133. JD Financial Recent Developments
Table 134. Qihoo 360 Company Details
Table 135. Qihoo 360 Business Overview
Table 136. Qihoo 360 Blockchain Supply Chain Finance Product
Table 137. Qihoo 360 Revenue in Blockchain Supply Chain Finance Business (2017-2022) & (US$ Million)
Table 138. Qihoo 360 Recent Developments
Table 139. Tecent Company Details
Table 140. Tecent Business Overview
Table 141. Tecent Blockchain Supply Chain Finance Product
Table 142. Tecent Revenue in Blockchain Supply Chain Finance Business (2017-2022) & (US$ Million)
Table 143. Tecent Recent Developments
Table 144. Baidu Company Details
Table 145. Baidu Business Overview
Table 146. Baidu Blockchain Supply Chain Finance Product
Table 147. Baidu Revenue in Blockchain Supply Chain Finance Business (2017-2022) & (US$ Million)
Table 148. Baidu Recent Developments
Table 149. Huawei Company Details
Table 150. Huawei Business Overview
Table 151. Huawei Blockchain Supply Chain Finance Product
Table 152. Huawei Revenue in Blockchain Supply Chain Finance Business (2017-2022) & (US$ Million)
Table 153. Huawei Recent Developments
Table 154. Bitspark Company Details
Table 155. Bitspark Business Overview
Table 156. Bitspark Blockchain Supply Chain Finance Product
Table 157. Bitspark Revenue in Blockchain Supply Chain Finance Business (2017-2022) & (US$ Million)
Table 158. Bitspark Recent Developments
Table 159. SAP Company Details
Table 160. SAP Business Overview
Table 161. SAP Blockchain Supply Chain Finance Product
Table 162. SAP Revenue in Blockchain Supply Chain Finance Business (2017-2022) & (US$ Million)
Table 163. SAP Recent Developments
Table 164. Research Programs/Design for This Report
Table 165. Key Data Information from Secondary Sources
Table 166. Key Data Information from Primary Sources
List of Figures
Figure 1. Global Blockchain Supply Chain Finance Market Share by Type: 2021 VS 2028
Figure 2. IT Solution Features
Figure 3. FinTech Features
Figure 4. Bank Features
Figure 5. Consulting Features
Figure 6. Exchange and Other Features
Figure 7. Global Blockchain Supply Chain Finance Market Share by Application: 2021 VS 2028
Figure 8. Cross-border Payment Case Studies
Figure 9. Trade Finance Case Studies
Figure 10. Digital Currency Case Studies
Figure 11. Identity Management Case Studies
Figure 12. Others Case Studies
Figure 13. Blockchain Supply Chain Finance Report Years Considered
Figure 14. Global Blockchain Supply Chain Finance Market Size (US$ Million), Year-over-Year: 2017-2028
Figure 15. Global Blockchain Supply Chain Finance Market Size, (US$ Million), 2017 VS 2021 VS 2028
Figure 16. Global Blockchain Supply Chain Finance Market Share by Region: 2021 VS 2028
Figure 17. Global Blockchain Supply Chain Finance Market Share by Players in 2021
Figure 18. Global Top Blockchain Supply Chain Finance Players by Company Type (Tier 1, Tier 2, and Tier 3) & (based on the Revenue in Blockchain Supply Chain Finance as of 2021)
Figure 19. The Top 10 and 5 Players Market Share by Blockchain Supply Chain Finance Revenue in 2021
Figure 20. North America Blockchain Supply Chain Finance Market Size YoY (2017-2028) & (US$ Million)
Figure 21. North America Blockchain Supply Chain Finance Market Size Market Share by Type (2017-2028)
Figure 22. North America Blockchain Supply Chain Finance Market Size Market Share by Application (2017-2028)
Figure 23. North America Blockchain Supply Chain Finance Market Size Share by Country (2017-2028)
Figure 24. United States Blockchain Supply Chain Finance Market Size YoY Growth (2017-2028) & (US$ Million)
Figure 25. Canada Blockchain Supply Chain Finance Market Size YoY Growth (2017-2028) & (US$ Million)
Figure 26. Europe Blockchain Supply Chain Finance Market Size YoY (2017-2028) & (US$ Million)
Figure 27. Europe Blockchain Supply Chain Finance Market Size Market Share by Type (2017-2028)
Figure 28. Europe Blockchain Supply Chain Finance Market Size Market Share by Application (2017-2028)
Figure 29. Europe Blockchain Supply Chain Finance Market Size Share by Country (2017-2028)
Figure 30. Germany Blockchain Supply Chain Finance Market Size YoY Growth (2017-2028) & (US$ Million)
Figure 31. France Blockchain Supply Chain Finance Market Size YoY Growth (2017-2028) & (US$ Million)
Figure 32. U.K. Blockchain Supply Chain Finance Market Size YoY Growth (2017-2028) & (US$ Million)
Figure 33. Italy Blockchain Supply Chain Finance Market Size YoY Growth (2017-2028) & (US$ Million)
Figure 34. Russia Blockchain Supply Chain Finance Market Size YoY Growth (2017-2028) & (US$ Million)
Figure 35. Nordic Countries Blockchain Supply Chain Finance Market Size YoY Growth (2017-2028) & (US$ Million)
Figure 36. Asia-Pacific Blockchain Supply Chain Finance Market Size YoY (2017-2028) & (US$ Million)
Figure 37. Asia Pacific Blockchain Supply Chain Finance Market Size Market Share by Type (2017-2028)
Figure 38. Asia Pacific Blockchain Supply Chain Finance Market Size Market Share by Application (2017-2028)
Figure 39. Asia Pacific Blockchain Supply Chain Finance Market Size Share by Region (2017-2028)
Figure 40. China Blockchain Supply Chain Finance Market Size YoY Growth (2017-2028) & (US$ Million)
Figure 41. Japan Blockchain Supply Chain Finance Market Size YoY Growth (2017-2028) & (US$ Million)
Figure 42. South Korea Blockchain Supply Chain Finance Market Size YoY Growth (2017-2028) & (US$ Million)
Figure 43. Southeast Asia Blockchain Supply Chain Finance Market Size YoY Growth (2017-2028) & (US$ Million)
Figure 44. India Blockchain Supply Chain Finance Market Size YoY Growth (2017-2028) & (US$ Million)
Figure 45. Australia Blockchain Supply Chain Finance Market Size YoY Growth (2017-2028) & (US$ Million)
Figure 46. Latin America Blockchain Supply Chain Finance Market Size YoY (2017-2028) & (US$ Million)
Figure 47. Latin America Blockchain Supply Chain Finance Market Size Market Share by Type (2017-2028)
Figure 48. Latin America Blockchain Supply Chain Finance Market Size Market Share by Application (2017-2028)
Figure 49. Latin America Blockchain Supply Chain Finance Market Size Share by Country (2017-2028)
Figure 50. Mexico Blockchain Supply Chain Finance Market Size YoY Growth (2017-2028) & (US$ Million)
Figure 51. Brazil Blockchain Supply Chain Finance Market Size YoY Growth (2017-2028) & (US$ Million)
Figure 52. Middle East & Africa Blockchain Supply Chain Finance Market Size YoY (2017-2028) & (US$ Million)
Figure 53. Middle East and Africa Blockchain Supply Chain Finance Market Size Market Share by Type (2017-2028)
Figure 54. Middle East and Africa Blockchain Supply Chain Finance Market Size Market Share by Application (2017-2028)
Figure 55. Middle East and Africa Blockchain Supply Chain Finance Market Size Share by Country (2017-2028)
Figure 56. Turkey Blockchain Supply Chain Finance Market Size YoY Growth (2017-2028) & (US$ Million)
Figure 57. Saudi Arabia Blockchain Supply Chain Finance Market Size YoY Growth (2017-2028) & (US$ Million)
Figure 58. UAE Blockchain Supply Chain Finance Market Size YoY Growth (2017-2028) & (US$ Million)
Figure 59. IBM Revenue Growth Rate in Blockchain Supply Chain Finance Business (2017-2022)
Figure 60. Ripple Revenue Growth Rate in Blockchain Supply Chain Finance Business (2017-2022)
Figure 61. Rubix by Deloitte Revenue Growth Rate in Blockchain Supply Chain Finance Business (2017-2022)
Figure 62. Accenture Revenue Growth Rate in Blockchain Supply Chain Finance Business (2017-2022)
Figure 63. Distributed Ledger Technologies Revenue Growth Rate in Blockchain Supply Chain Finance Business (2017-2022)
Figure 64. Oklink Revenue Growth Rate in Blockchain Supply Chain Finance Business (2017-2022)
Figure 65. Nasdaq Linq Revenue Growth Rate in Blockchain Supply Chain Finance Business (2017-2022)
Figure 66. Oracle Revenue Growth Rate in Blockchain Supply Chain Finance Business (2017-2022)
Figure 67. AWS Revenue Growth Rate in Blockchain Supply Chain Finance Business (2017-2022)
Figure 68. Citi Bank Revenue Growth Rate in Blockchain Supply Chain Finance Business (2017-2022)
Figure 69. ELayaway Revenue Growth Rate in Blockchain Supply Chain Finance Business (2017-2022)
Figure 70. HSBC Revenue Growth Rate in Blockchain Supply Chain Finance Business (2017-2022)
Figure 71. Ant Financial Revenue Growth Rate in Blockchain Supply Chain Finance Business (2017-2022)
Figure 72. JD Financial Revenue Growth Rate in Blockchain Supply Chain Finance Business (2017-2022)
Figure 73. Qihoo 360 Revenue Growth Rate in Blockchain Supply Chain Finance Business (2017-2022)
Figure 74. Tecent Revenue Growth Rate in Blockchain Supply Chain Finance Business (2017-2022)
Figure 75. Baidu Revenue Growth Rate in Blockchain Supply Chain Finance Business (2017-2022)
Figure 76. Huawei Revenue Growth Rate in Blockchain Supply Chain Finance Business (2017-2022)
Figure 77. Bitspark Revenue Growth Rate in Blockchain Supply Chain Finance Business (2017-2022)
Figure 78. SAP Revenue Growth Rate in Blockchain Supply Chain Finance Business (2017-2022)
Figure 79. Bottom-up and Top-down Approaches for This Report
Figure 80. Data Triangulation
Figure 81. Key Executives Interviewed
$4900
$9800
HAVE A QUERY?
OUR CUSTOMER

SIMILAR REPORTS