List of Tables
Table 1. Global Viral Vector Manufacturing CDMO Services Market Size Growth Rate by Type (US$ Million): 2021 vs 2025 vs 2032
Table 2. Key Players of Adeno-associated Virus
Table 3. Key Players of Lentivirus
Table 4. Key Players of Adenovirus
Table 5. Key Players of HSV
Table 6. Key Players of Others
Table 7. Global Viral Vector Manufacturing CDMO Services Market Size Growth Rate by Development Scope (US$ Million): 2021 vs 2025 vs 2032
Table 8. Key Players of Clinical stage CDMOs
Table 9. Key Players of Commercial stage CDMOs
Table 10. Key Players of End to end lifecycle CDMOs
Table 11. Global Viral Vector Manufacturing CDMO Services Market Size Growth Rate by Manufacturing Technology (US$ Million): 2021 vs 2025 vs 2032
Table 12. Key Players of Adherent Cell Based
Table 13. Key Players of Suspension Based
Table 14. Global Viral Vector Manufacturing CDMO Services Market Size Growth by Application (US$ Million): 2021 vs 2025 vs 2032
Table 15. Global Viral Vector Manufacturing CDMO Services Market Size by Region (US$ Million): 2021 vs 2025 vs 2032
Table 16. Global Viral Vector Manufacturing CDMO Services Market Size by Region (US$ Million), 2021–2026
Table 17. Global Viral Vector Manufacturing CDMO Services Market Share by Region (2021–2026)
Table 18. Global Viral Vector Manufacturing CDMO Services Forecasted Market Size by Region (US$ Million), 2027–2032
Table 19. Global Viral Vector Manufacturing CDMO Services Market Share by Region (2027–2032)
Table 20. Viral Vector Manufacturing CDMO Services Market Trends
Table 21. Viral Vector Manufacturing CDMO Services Market Drivers
Table 22. Viral Vector Manufacturing CDMO Services Market Challenges
Table 23. Viral Vector Manufacturing CDMO Services Market Restraints
Table 24. Global Viral Vector Manufacturing CDMO Services Revenue by Players (US$ Million), 2021–2026
Table 25. Global Viral Vector Manufacturing CDMO Services Market Share by Players (2021–2026)
Table 26. Global Top Viral Vector Manufacturing CDMO Services Players by Tier (Tier 1, Tier 2, and Tier 3), based on Viral Vector Manufacturing CDMO Services Revenue, 2025
Table 27. Ranking of Global Top Viral Vector Manufacturing CDMO Services Companies by Revenue (US$ Million) in 2025
Table 28. Global 5 Largest Players Market Share by Viral Vector Manufacturing CDMO Services Revenue (CR5 and HHI), 2021–2026
Table 29. Global Key Players of Viral Vector Manufacturing CDMO Services, Headquarters and Area Served
Table 30. Global Key Players of Viral Vector Manufacturing CDMO Services, Products and Applications
Table 31. Global Key Players of Viral Vector Manufacturing CDMO Services, Date of General Availability (GA)
Table 32. Mergers and Acquisitions, Expansion Plans
Table 33. Global Viral Vector Manufacturing CDMO Services Market Size by Type (US$ Million), 2021–2026
Table 34. Global Viral Vector Manufacturing CDMO Services Revenue Market Share by Type (2021–2026)
Table 35. Global Viral Vector Manufacturing CDMO Services Forecasted Market Size by Type (US$ Million), 2027–2032
Table 36. Global Viral Vector Manufacturing CDMO Services Revenue Market Share by Type (2027–2032)
Table 37. Global Viral Vector Manufacturing CDMO Services Market Size by Application (US$ Million), 2021–2026
Table 38. Global Viral Vector Manufacturing CDMO Services Revenue Market Share by Application (2021–2026)
Table 39. Global Viral Vector Manufacturing CDMO Services Forecasted Market Size by Application (US$ Million), 2027–2032
Table 40. Global Viral Vector Manufacturing CDMO Services Revenue Market Share by Application (2027–2032)
Table 41. North America Viral Vector Manufacturing CDMO Services Market Size Growth Rate by Country (US$ Million): 2021 vs 2025 vs 2032
Table 42. North America Viral Vector Manufacturing CDMO Services Market Size by Country (US$ Million), 2021–2026
Table 43. North America Viral Vector Manufacturing CDMO Services Market Size by Country (US$ Million), 2027–2032
Table 44. Europe Viral Vector Manufacturing CDMO Services Market Size Growth Rate by Country (US$ Million): 2021 vs 2025 vs 2032
Table 45. Europe Viral Vector Manufacturing CDMO Services Market Size by Country (US$ Million), 2021–2026
Table 46. Europe Viral Vector Manufacturing CDMO Services Market Size by Country (US$ Million), 2027–2032
Table 47. Asia-Pacific Viral Vector Manufacturing CDMO Services Market Size Growth Rate by Region (US$ Million): 2021 vs 2025 vs 2032
Table 48. Asia-Pacific Viral Vector Manufacturing CDMO Services Market Size by Region (US$ Million), 2021–2026
Table 49. Asia-Pacific Viral Vector Manufacturing CDMO Services Market Size by Region (US$ Million), 2027–2032
Table 50. Latin America Viral Vector Manufacturing CDMO Services Market Size Growth Rate by Country (US$ Million): 2021 vs 2025 vs 2032
Table 51. Latin America Viral Vector Manufacturing CDMO Services Market Size by Country (US$ Million), 2021–2026
Table 52. Latin America Viral Vector Manufacturing CDMO Services Market Size by Country (US$ Million), 2027–2032
Table 53. Middle East & Africa Viral Vector Manufacturing CDMO Services Market Size Growth Rate by Country (US$ Million): 2021 vs 2025 vs 2032
Table 54. Middle East & Africa Viral Vector Manufacturing CDMO Services Market Size by Country (US$ Million), 2021–2026
Table 55. Middle East & Africa Viral Vector Manufacturing CDMO Services Market Size by Country (US$ Million), 2027–2032
Table 56. Thermo Fisher Scientific Company Details
Table 57. Thermo Fisher Scientific Business Overview
Table 58. Thermo Fisher Scientific Viral Vector Manufacturing CDMO Services Product
Table 59. Thermo Fisher Scientific Revenue in Viral Vector Manufacturing CDMO Services Business (US$ Million), 2021–2026
Table 60. Thermo Fisher Scientific Recent Development
Table 61. Lonza Company Details
Table 62. Lonza Business Overview
Table 63. Lonza Viral Vector Manufacturing CDMO Services Product
Table 64. Lonza Revenue in Viral Vector Manufacturing CDMO Services Business (US$ Million), 2021–2026
Table 65. Lonza Recent Development
Table 66. Catalent Company Details
Table 67. Catalent Business Overview
Table 68. Catalent Viral Vector Manufacturing CDMO Services Product
Table 69. Catalent Revenue in Viral Vector Manufacturing CDMO Services Business (US$ Million), 2021–2026
Table 70. Catalent Recent Development
Table 71. Charles River Company Details
Table 72. Charles River Business Overview
Table 73. Charles River Viral Vector Manufacturing CDMO Services Product
Table 74. Charles River Revenue in Viral Vector Manufacturing CDMO Services Business (US$ Million), 2021–2026
Table 75. Charles River Recent Development
Table 76. Merck Company Details
Table 77. Merck Business Overview
Table 78. Merck Viral Vector Manufacturing CDMO Services Product
Table 79. Merck Revenue in Viral Vector Manufacturing CDMO Services Business (US$ Million), 2021–2026
Table 80. Merck Recent Development
Table 81. SK pharmteco Company Details
Table 82. SK pharmteco Business Overview
Table 83. SK pharmteco Viral Vector Manufacturing CDMO Services Product
Table 84. SK pharmteco Revenue in Viral Vector Manufacturing CDMO Services Business (US$ Million), 2021–2026
Table 85. SK pharmteco Recent Development
Table 86. Oxford Biomedica Company Details
Table 87. Oxford Biomedica Business Overview
Table 88. Oxford Biomedica Viral Vector Manufacturing CDMO Services Product
Table 89. Oxford Biomedica Revenue in Viral Vector Manufacturing CDMO Services Business (US$ Million), 2021–2026
Table 90. Oxford Biomedica Recent Development
Table 91. AGC Biologics(MolMed) Company Details
Table 92. AGC Biologics(MolMed) Business Overview
Table 93. AGC Biologics(MolMed) Viral Vector Manufacturing CDMO Services Product
Table 94. AGC Biologics(MolMed) Revenue in Viral Vector Manufacturing CDMO Services Business (US$ Million), 2021–2026
Table 95. AGC Biologics(MolMed) Recent Development
Table 96. Gene Universal Company Details
Table 97. Gene Universal Business Overview
Table 98. Gene Universal Viral Vector Manufacturing CDMO Services Product
Table 99. Gene Universal Revenue in Viral Vector Manufacturing CDMO Services Business (US$ Million), 2021–2026
Table 100. Gene Universal Recent Development
Table 101. Polyplus (Sartorius) Company Details
Table 102. Polyplus (Sartorius) Business Overview
Table 103. Polyplus (Sartorius) Viral Vector Manufacturing CDMO Services Product
Table 104. Polyplus (Sartorius) Revenue in Viral Vector Manufacturing CDMO Services Business (US$ Million), 2021–2026
Table 105. Polyplus (Sartorius) Recent Development
Table 106. CCRM Company Details
Table 107. CCRM Business Overview
Table 108. CCRM Viral Vector Manufacturing CDMO Services Product
Table 109. CCRM Revenue in Viral Vector Manufacturing CDMO Services Business (US$ Million), 2021–2026
Table 110. CCRM Recent Development
Table 111. FUJIFILM Diosynth Biotechnologies Company Details
Table 112. FUJIFILM Diosynth Biotechnologies Business Overview
Table 113. FUJIFILM Diosynth Biotechnologies Viral Vector Manufacturing CDMO Services Product
Table 114. FUJIFILM Diosynth Biotechnologies Revenue in Viral Vector Manufacturing CDMO Services Business (US$ Million), 2021–2026
Table 115. FUJIFILM Diosynth Biotechnologies Recent Development
Table 116. Biovian Company Details
Table 117. Biovian Business Overview
Table 118. Biovian Viral Vector Manufacturing CDMO Services Product
Table 119. Biovian Revenue in Viral Vector Manufacturing CDMO Services Business (US$ Million), 2021–2026
Table 120. Biovian Recent Development
Table 121. Miltenyi Bioindustry Company Details
Table 122. Miltenyi Bioindustry Business Overview
Table 123. Miltenyi Bioindustry Viral Vector Manufacturing CDMO Services Product
Table 124. Miltenyi Bioindustry Revenue in Viral Vector Manufacturing CDMO Services Business (US$ Million), 2021–2026
Table 125. Miltenyi Bioindustry Recent Development
Table 126. Aldevron Company Details
Table 127. Aldevron Business Overview
Table 128. Aldevron Viral Vector Manufacturing CDMO Services Product
Table 129. Aldevron Revenue in Viral Vector Manufacturing CDMO Services Business (US$ Million), 2021–2026
Table 130. Aldevron Recent Development
Table 131. Takara Bio Company Details
Table 132. Takara Bio Business Overview
Table 133. Takara Bio Viral Vector Manufacturing CDMO Services Product
Table 134. Takara Bio Revenue in Viral Vector Manufacturing CDMO Services Business (US$ Million), 2021–2026
Table 135. Takara Bio Recent Development
Table 136. Yposkesi Company Details
Table 137. Yposkesi Business Overview
Table 138. Yposkesi Viral Vector Manufacturing CDMO Services Product
Table 139. Yposkesi Revenue in Viral Vector Manufacturing CDMO Services Business (US$ Million), 2021–2026
Table 140. Yposkesi Recent Development
Table 141. Genezen Company Details
Table 142. Genezen Business Overview
Table 143. Genezen Viral Vector Manufacturing CDMO Services Product
Table 144. Genezen Revenue in Viral Vector Manufacturing CDMO Services Business (US$ Million), 2021–2026
Table 145. Genezen Recent Development
Table 146. Exthera Company Details
Table 147. Exthera Business Overview
Table 148. Exthera Viral Vector Manufacturing CDMO Services Product
Table 149. Exthera Revenue in Viral Vector Manufacturing CDMO Services Business (US$ Million), 2021–2026
Table 150. Exthera Recent Development
Table 151. Flash Therapeutics Company Details
Table 152. Flash Therapeutics Business Overview
Table 153. Flash Therapeutics Viral Vector Manufacturing CDMO Services Product
Table 154. Flash Therapeutics Revenue in Viral Vector Manufacturing CDMO Services Business (US$ Million), 2021–2026
Table 155. Flash Therapeutics Recent Development
Table 156. VIVEBiotech Company Details
Table 157. VIVEBiotech Business Overview
Table 158. VIVEBiotech Viral Vector Manufacturing CDMO Services Product
Table 159. VIVEBiotech Revenue in Viral Vector Manufacturing CDMO Services Business (US$ Million), 2021–2026
Table 160. VIVEBiotech Recent Development
Table 161. FinVector Company Details
Table 162. FinVector Business Overview
Table 163. FinVector Viral Vector Manufacturing CDMO Services Product
Table 164. FinVector Revenue in Viral Vector Manufacturing CDMO Services Business (US$ Million), 2021–2026
Table 165. FinVector Recent Development
Table 166. uBriGene Company Details
Table 167. uBriGene Business Overview
Table 168. uBriGene Viral Vector Manufacturing CDMO Services Product
Table 169. uBriGene Revenue in Viral Vector Manufacturing CDMO Services Business (US$ Million), 2021–2026
Table 170. uBriGene Recent Development
Table 171. Eurogentec Company Details
Table 172. Eurogentec Business Overview
Table 173. Eurogentec Viral Vector Manufacturing CDMO Services Product
Table 174. Eurogentec Revenue in Viral Vector Manufacturing CDMO Services Business (US$ Million), 2021–2026
Table 175. Eurogentec Recent Development
Table 176. VGXI Company Details
Table 177. VGXI Business Overview
Table 178. VGXI Viral Vector Manufacturing CDMO Services Product
Table 179. VGXI Revenue in Viral Vector Manufacturing CDMO Services Business (US$ Million), 2021–2026
Table 180. VGXI Recent Development
Table 181. GenScript ProBio Company Details
Table 182. GenScript ProBio Business Overview
Table 183. GenScript ProBio Viral Vector Manufacturing CDMO Services Product
Table 184. GenScript ProBio Revenue in Viral Vector Manufacturing CDMO Services Business (US$ Million), 2021–2026
Table 185. GenScript ProBio Recent Development
Table 186. EurekaBio Company Details
Table 187. EurekaBio Business Overview
Table 188. EurekaBio Viral Vector Manufacturing CDMO Services Product
Table 189. EurekaBio Revenue in Viral Vector Manufacturing CDMO Services Business (US$ Million), 2021–2026
Table 190. EurekaBio Recent Development
Table 191. Obio Technology Company Details
Table 192. Obio Technology Business Overview
Table 193. Obio Technology Viral Vector Manufacturing CDMO Services Product
Table 194. Obio Technology Revenue in Viral Vector Manufacturing CDMO Services Business (US$ Million), 2021–2026
Table 195. Obio Technology Recent Development
Table 196. GeneSail Biotech Company Details
Table 197. GeneSail Biotech Business Overview
Table 198. GeneSail Biotech Viral Vector Manufacturing CDMO Services Product
Table 199. GeneSail Biotech Revenue in Viral Vector Manufacturing CDMO Services Business (US$ Million), 2021–2026
Table 200. GeneSail Biotech Recent Development
Table 201. VectorBuilder Company Details
Table 202. VectorBuilder Business Overview
Table 203. VectorBuilder Viral Vector Manufacturing CDMO Services Product
Table 204. VectorBuilder Revenue in Viral Vector Manufacturing CDMO Services Business (US$ Million), 2021–2026
Table 205. VectorBuilder Recent Development
Table 206. WuXi ATU Company Details
Table 207. WuXi ATU Business Overview
Table 208. WuXi ATU Viral Vector Manufacturing CDMO Services Product
Table 209. WuXi ATU Revenue in Viral Vector Manufacturing CDMO Services Business (US$ Million), 2021–2026
Table 210. WuXi ATU Recent Development
Table 211. Ubrigene Company Details
Table 212. Ubrigene Business Overview
Table 213. Ubrigene Viral Vector Manufacturing CDMO Services Product
Table 214. Ubrigene Revenue in Viral Vector Manufacturing CDMO Services Business (US$ Million), 2021–2026
Table 215. Ubrigene Recent Development
Table 216. Porton Biologics Company Details
Table 217. Porton Biologics Business Overview
Table 218. Porton Biologics Viral Vector Manufacturing CDMO Services Product
Table 219. Porton Biologics Revenue in Viral Vector Manufacturing CDMO Services Business (US$ Million), 2021–2026
Table 220. Porton Biologics Recent Development
Table 221. Pharmaron Company Details
Table 222. Pharmaron Business Overview
Table 223. Pharmaron Viral Vector Manufacturing CDMO Services Product
Table 224. Pharmaron Revenue in Viral Vector Manufacturing CDMO Services Business (US$ Million), 2021–2026
Table 225. Pharmaron Recent Development
Table 226. PackGene Biotechnology Company Details
Table 227. PackGene Biotechnology Business Overview
Table 228. PackGene Biotechnology Viral Vector Manufacturing CDMO Services Product
Table 229. PackGene Biotechnology Revenue in Viral Vector Manufacturing CDMO Services Business (US$ Million), 2021–2026
Table 230. PackGene Biotechnology Recent Development
Table 231. Hillgene Company Details
Table 232. Hillgene Business Overview
Table 233. Hillgene Viral Vector Manufacturing CDMO Services Product
Table 234. Hillgene Revenue in Viral Vector Manufacturing CDMO Services Business (US$ Million), 2021–2026
Table 235. Hillgene Recent Development
Table 236. Asymchem Company Details
Table 237. Asymchem Business Overview
Table 238. Asymchem Viral Vector Manufacturing CDMO Services Product
Table 239. Asymchem Revenue in Viral Vector Manufacturing CDMO Services Business (US$ Million), 2021–2026
Table 240. Asymchem Recent Development
Table 241. Research Programs/Design for This Report
Table 242. Key Data Information from Secondary Sources
Table 243. Key Data Information from Primary Sources
Table 244. Authors List of This Report
List of Figures
Figure 1. Viral Vector Manufacturing CDMO Services Picture
Figure 2. Global Viral Vector Manufacturing CDMO Services Market Size Comparison by Type (US$ Million), 2021–2032
Figure 3. Global Viral Vector Manufacturing CDMO Services Market Share by Type: 2025 vs 2032
Figure 4. Adeno-associated Virus Features
Figure 5. Lentivirus Features
Figure 6. Adenovirus Features
Figure 7. HSV Features
Figure 8. Others Features
Figure 9. Global Viral Vector Manufacturing CDMO Services Market Size Comparison by Development Scope (US$ Million), 2021–2032
Figure 10. Clinical stage CDMOs Features
Figure 11. Commercial stage CDMOs Features
Figure 12. End to end lifecycle CDMOs Features
Figure 13. Global Viral Vector Manufacturing CDMO Services Market Size Comparison by Manufacturing Technology (US$ Million), 2021–2032
Figure 14. Adherent Cell Based Features
Figure 15. Suspension Based Features
Figure 16. Global Viral Vector Manufacturing CDMO Services Market Size by Application (US$ Million), 2021–2032
Figure 17. Global Viral Vector Manufacturing CDMO Services Market Share by Application: 2025 vs 2032
Figure 18. Vaccine Development Case Studies
Figure 19. Gene Therapy Case Studies
Figure 20. Academic Scientific Research Institution Case Studies
Figure 21. Others Case Studies
Figure 22. Viral Vector Manufacturing CDMO Services Report Years Considered
Figure 23. Global Viral Vector Manufacturing CDMO Services Market Size (US$ Million), Year-over-Year: 2021–2032
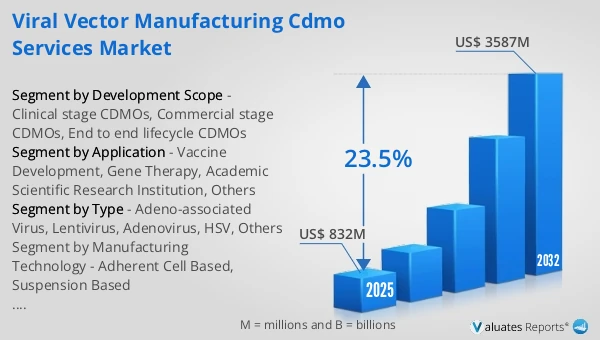
Figure 24. Global Viral Vector Manufacturing CDMO Services Market Size, (US$ Million), 2021 vs 2025 vs 2032
Figure 25. Global Viral Vector Manufacturing CDMO Services Market Share by Region: 2025 vs 2032
Figure 26. Global Viral Vector Manufacturing CDMO Services Market Share by Players in 2025
Figure 27. Global Viral Vector Manufacturing CDMO Services Market Share by Company Type (Tier 1, Tier 2, and Tier 3)
Figure 28. The Top 10 and 5 Players Market Share by Viral Vector Manufacturing CDMO Services Revenue in 2025
Figure 29. North America Viral Vector Manufacturing CDMO Services Market Size YoY Growth (US$ Million), 2021–2032
Figure 30. North America Viral Vector Manufacturing CDMO Services Market Share by Country (2021–2032)
Figure 31. United States Viral Vector Manufacturing CDMO Services Market Size YoY Growth (US$ Million), 2021–2032
Figure 32. Canada Viral Vector Manufacturing CDMO Services Market Size YoY Growth (US$ Million), 2021–2032
Figure 33. Europe Viral Vector Manufacturing CDMO Services Market Size YoY Growth (US$ Million), 2021–2032
Figure 34. Europe Viral Vector Manufacturing CDMO Services Market Share by Country (2021–2032)
Figure 35. Germany Viral Vector Manufacturing CDMO Services Market Size YoY Growth (US$ Million), 2021–2032
Figure 36. France Viral Vector Manufacturing CDMO Services Market Size YoY Growth (US$ Million), 2021–2032
Figure 37. U.K. Viral Vector Manufacturing CDMO Services Market Size YoY Growth (US$ Million), 2021–2032
Figure 38. Italy Viral Vector Manufacturing CDMO Services Market Size YoY Growth (US$ Million), 2021–2032
Figure 39. Russia Viral Vector Manufacturing CDMO Services Market Size YoY Growth (US$ Million), 2021–2032
Figure 40. Ireland Viral Vector Manufacturing CDMO Services Market Size YoY Growth (US$ Million), 2021–2032
Figure 41. Asia-Pacific Viral Vector Manufacturing CDMO Services Market Size YoY Growth (US$ Million), 2021–2032
Figure 42. Asia-Pacific Viral Vector Manufacturing CDMO Services Market Share by Region (2021–2032)
Figure 43. China Viral Vector Manufacturing CDMO Services Market Size YoY Growth (US$ Million), 2021–2032
Figure 44. Japan Viral Vector Manufacturing CDMO Services Market Size YoY Growth (US$ Million), 2021–2032
Figure 45. South Korea Viral Vector Manufacturing CDMO Services Market Size YoY Growth (US$ Million), 2021–2032
Figure 46. Southeast Asia Viral Vector Manufacturing CDMO Services Market Size YoY Growth (US$ Million), 2021–2032
Figure 47. India Viral Vector Manufacturing CDMO Services Market Size YoY Growth (US$ Million), 2021–2032
Figure 48. Australia & New Zealand Viral Vector Manufacturing CDMO Services Market Size YoY Growth (US$ Million), 2021–2032
Figure 49. Latin America Viral Vector Manufacturing CDMO Services Market Size YoY Growth (US$ Million), 2021–2032
Figure 50. Latin America Viral Vector Manufacturing CDMO Services Market Share by Country (2021–2032)
Figure 51. Mexico Viral Vector Manufacturing CDMO Services Market Size YoY Growth (US$ Million), 2021–2032
Figure 52. Brazil Viral Vector Manufacturing CDMO Services Market Size YoY Growth (US$ Million), 2021–2032
Figure 53. Middle East & Africa Viral Vector Manufacturing CDMO Services Market Size YoY Growth (US$ Million), 2021–2032
Figure 54. Middle East & Africa Viral Vector Manufacturing CDMO Services Market Share by Country (2021–2032)
Figure 55. Israel Viral Vector Manufacturing CDMO Services Market Size YoY Growth (US$ Million), 2021–2032
Figure 56. Saudi Arabia Viral Vector Manufacturing CDMO Services Market Size YoY Growth (US$ Million), 2021–2032
Figure 57. UAE Viral Vector Manufacturing CDMO Services Market Size YoY Growth (US$ Million), 2021–2032
Figure 58. Thermo Fisher Scientific Revenue Growth Rate in Viral Vector Manufacturing CDMO Services Business (2021–2026)
Figure 59. Lonza Revenue Growth Rate in Viral Vector Manufacturing CDMO Services Business (2021–2026)
Figure 60. Catalent Revenue Growth Rate in Viral Vector Manufacturing CDMO Services Business (2021–2026)
Figure 61. Charles River Revenue Growth Rate in Viral Vector Manufacturing CDMO Services Business (2021–2026)
Figure 62. Merck Revenue Growth Rate in Viral Vector Manufacturing CDMO Services Business (2021–2026)
Figure 63. SK pharmteco Revenue Growth Rate in Viral Vector Manufacturing CDMO Services Business (2021–2026)
Figure 64. Oxford Biomedica Revenue Growth Rate in Viral Vector Manufacturing CDMO Services Business (2021–2026)
Figure 65. AGC Biologics(MolMed) Revenue Growth Rate in Viral Vector Manufacturing CDMO Services Business (2021–2026)
Figure 66. Gene Universal Revenue Growth Rate in Viral Vector Manufacturing CDMO Services Business (2021–2026)
Figure 67. Polyplus (Sartorius) Revenue Growth Rate in Viral Vector Manufacturing CDMO Services Business (2021–2026)
Figure 68. CCRM Revenue Growth Rate in Viral Vector Manufacturing CDMO Services Business (2021–2026)
Figure 69. FUJIFILM Diosynth Biotechnologies Revenue Growth Rate in Viral Vector Manufacturing CDMO Services Business (2021–2026)
Figure 70. Biovian Revenue Growth Rate in Viral Vector Manufacturing CDMO Services Business (2021–2026)
Figure 71. Miltenyi Bioindustry Revenue Growth Rate in Viral Vector Manufacturing CDMO Services Business (2021–2026)
Figure 72. Aldevron Revenue Growth Rate in Viral Vector Manufacturing CDMO Services Business (2021–2026)
Figure 73. Takara Bio Revenue Growth Rate in Viral Vector Manufacturing CDMO Services Business (2021–2026)
Figure 74. Yposkesi Revenue Growth Rate in Viral Vector Manufacturing CDMO Services Business (2021–2026)
Figure 75. Genezen Revenue Growth Rate in Viral Vector Manufacturing CDMO Services Business (2021–2026)
Figure 76. Exthera Revenue Growth Rate in Viral Vector Manufacturing CDMO Services Business (2021–2026)
Figure 77. Flash Therapeutics Revenue Growth Rate in Viral Vector Manufacturing CDMO Services Business (2021–2026)
Figure 78. VIVEBiotech Revenue Growth Rate in Viral Vector Manufacturing CDMO Services Business (2021–2026)
Figure 79. FinVector Revenue Growth Rate in Viral Vector Manufacturing CDMO Services Business (2021–2026)
Figure 80. uBriGene Revenue Growth Rate in Viral Vector Manufacturing CDMO Services Business (2021–2026)
Figure 81. Eurogentec Revenue Growth Rate in Viral Vector Manufacturing CDMO Services Business (2021–2026)
Figure 82. VGXI Revenue Growth Rate in Viral Vector Manufacturing CDMO Services Business (2021–2026)
Figure 83. GenScript ProBio Revenue Growth Rate in Viral Vector Manufacturing CDMO Services Business (2021–2026)
Figure 84. EurekaBio Revenue Growth Rate in Viral Vector Manufacturing CDMO Services Business (2021–2026)
Figure 85. Obio Technology Revenue Growth Rate in Viral Vector Manufacturing CDMO Services Business (2021–2026)
Figure 86. GeneSail Biotech Revenue Growth Rate in Viral Vector Manufacturing CDMO Services Business (2021–2026)
Figure 87. VectorBuilder Revenue Growth Rate in Viral Vector Manufacturing CDMO Services Business (2021–2026)
Figure 88. WuXi ATU Revenue Growth Rate in Viral Vector Manufacturing CDMO Services Business (2021–2026)
Figure 89. Ubrigene Revenue Growth Rate in Viral Vector Manufacturing CDMO Services Business (2021–2026)
Figure 90. Porton Biologics Revenue Growth Rate in Viral Vector Manufacturing CDMO Services Business (2021–2026)
Figure 91. Pharmaron Revenue Growth Rate in Viral Vector Manufacturing CDMO Services Business (2021–2026)
Figure 92. PackGene Biotechnology Revenue Growth Rate in Viral Vector Manufacturing CDMO Services Business (2021–2026)
Figure 93. Hillgene Revenue Growth Rate in Viral Vector Manufacturing CDMO Services Business (2021–2026)
Figure 94. Asymchem Revenue Growth Rate in Viral Vector Manufacturing CDMO Services Business (2021–2026)
Figure 95. Bottom-up and Top-down Approaches for This Report
Figure 96. Data Triangulation
Figure 97. Key Executives Interviewed