0
U.S. (TOLL FREE)
+1 (315) 215-3225
Automative

0
U.S. (TOLL FREE)
+1 (315) 215-3225
Marina Cranes- Global Market Share and Ranking, Overall Sales and Demand Forecast 2026-2032
Published Date: 2026-01-13
|
Report Code: QYRE-Auto-22S11479
Home | Market Reports | Business & Industrial| Industrial Materials & Equipment| Heavy Machinery
Global Marina Cranes Market Research Report 2022
BUY CHAPTERS

Marina Cranes- Global Market Share and Ranking, Overall Sales and Demand Forecast 2026-2032

Code: QYRE-Auto-22S11479
Report
2026-01-13
Pages:120
QYResearch
Buy Now with 15% Discount
DESCRIPTION
TABLE OF CONTENT
TABLES & FIGURES

Marina Cranes- Market Size

The global market for Marina Cranes was estimated to be worth US$ 2260 million in 2025 and is projected to reach US$ 2936 million, growing at a CAGR of 3.6% from 2026 to 2032.

Marina Cranes- Market

Marina Cranes- Market

The potential shifts in the 2025 U.S. tariff framework pose substantial volatility risks to global markets. This report provides a comprehensive assessment of recent tariff adjustments and international strategic countermeasures on Marina Cranes cross-border industrial footprints, capital allocation patterns, regional economic interdependencies, and supply chain reconfigurations.
In 2025, global Marina Cranes production reached approximately 205 units,with an average global market price of around US$ 11 million per unit, and a gross profit margin of approximately 20%-40%. Marina cranes are specialized lifting systems used in marinas, yacht clubs, and boatyards to lift, launch, recover, and reposition boats and yachts for storage, maintenance, or transport within the facility. In practice, the term often covers two main equipment families: (1) mobile boat hoists/travel lifts (also called boat gantry cranes or boat cranes) that straddle a vessel and lift it with web slings before moving it on wheel bogies around the yard, and (2) fixed or semi-fixed dockside cranes—such as pedestal, jib, or davit-style cranes—used for handling smaller craft, tenders, engines, masts, or heavy equipment on and off the dock. Travel lifts are purpose-built for marina logistics: the open gantry frame allows tall superstructures or masts to pass through, while winches and lifting straps enable controlled hoisting from a slipway or lifting well and safe placement onto hard stands for service and long-term storage. Marina cranes are engineered for wet, corrosive environments, so designs emphasize corrosion protection, robust braking and load-holding, stable lifting geometry, and operator visibility and control.
The marina crane market is driven by the operational needs of marinas and boatyards that must move vessels efficiently between water, service bays, and storage areas, making equipment purchases closely tied to local boating activity, seasonal haul-out patterns, and the growth of professional maintenance and refit services. Buyers tend to be highly practical: they prioritize reliability, ease of operation, yard throughput, safety features, and service support, because downtime during peak periods can disrupt schedules and revenue. Product differentiation increasingly centers on space efficiency and adaptability—for example, features that help yards handle a wider mix of boat sizes or store vessels more tightly—along with improvements in ergonomics, visibility, and control for safer handling in congested yards. Electrification and cleaner powertrains can be attractive where marinas face noise or emissions constraints, while corrosion resistance and lifecycle serviceability remain baseline expectations in saltwater environments.
This report provides a comprehensive view of the global market for Marina Cranes, covering total sales volume, sales revenue, pricing, the market share and ranking of key companies, along with analyses by region & country, by Type, and by Application.
The Marina Cranes market size, estimations, and forecasts are presented in terms of sales volume (Units) and revenue ($ millions), with 2025 as the base year and historical and forecast data from 2021 to 2032. The report combines quantitative and qualitative analysis to help readers develop growth strategies, assess the competitive landscape, evaluate their position in the current marketplace, and make informed business decisions regarding Marina Cranes.
Market Segmentation

Scope of Marina Cranes- Market Report

Report Metric Details
Report Name Marina Cranes- Market
CAGR 3.6%
Segment by Type
  • Fixed Crane
  • Mobile Crane
Segment by Max. Boom Length
  • Max. Boom Length: ≤60 m
  • Max. Boom Length: 60-70 m
  • Max. Boom Length: ≥70 m
Segment by Max. Lifting Height
  • Max. Lifting Height: ≤100 m
  • Max. Lifting Height: >100 m
Segment by Application
  • Marinas
  • Shipyard
  • Others
By Region
  • North America (United States, Canada)
  • Europe (Germany, France, UK, Italy, Russia) Rest of Europe
  • Nordic Countries
  • Asia-Pacific (China, Japan, South Korea)
  • Southeast Asia (India, Australia)
  • Rest of Asia
  • Latin America (Mexico, Brazil)
  • Rest of Latin America
  • Middle East & Africa (Turkey, Saudi Arabia, UAE, Rest of MEA)
Consumption by Region
  • North America (United States, Canada)
  • Europe (Germany, France, UK, Italy, Russia)
  • Asia-Pacific (China, Japan, South Korea, Taiwan)
  • Southeast Asia (India)
  • Latin America (Mexico, Brazil)
By Company Techcrane, PALFINGER MARINE, Liebherr, Konecranes, Storm Cranes, Ascom, Schilstra Boatlift Systems, Vetter Krantechnik, YMV Crane and Winch Systems, CM Energy, DMW Marine Group, Allied Systems, Appleton Marine
Forecast units USD million in value
Report coverage Revenue and volume forecast, company share, competitive landscape, growth factors and trends

Chapter Outline

  • Chapter 1: Introduces the scope of the report and the global market size (value, volume, and price). It also summarizes market dynamics and Recent Developments; identifies key drivers and restraints; outlines challenges and risks for manufacturers; reviews relevant industry policies and U.S. tariff implications.
  • Chapter 2: Provides a detailed analysis of the Marina Cranes manufacturers' competitive landscape—including pricing, sales and revenue shares, Recent Developments plans, and mergers and acquisitions (M&A).
  • Chapter 3: Analyzes market segmentation by Type, presenting the size and growth potential of each segment to help readers identify blue-ocean opportunities.
  • Chapter 4: Analyzes market segmentation by Application, presenting the size and growth potential of each downstream segment to help readers identify blue-ocean opportunities.
  • Chapter 5: Presents Marina Cranes sales and revenue at the regional level. It offers a quantitative assessment of market size and growth potential by region and summarizes market development, future prospects, addressable space, and country-level market size worldwide.
  • Chapter 6: Presents Marina Cranes sales and revenue at the country level. It provides segmented data by Type and by Application for each country/region.
  • Chapter 7: Profiles key players, detailing the main companies' product sales, revenue, pricing, gross margin, product portfolios, Recent Developments, etc.
  • Chapter 8: Analyzes the industry value chain, including upstream suppliers and downstream applications/customers.
  • Chapter 9: Conclusion.

FAQ for this report

Who are the main players in the Marina Cranes- Market report?

Ans: The main players in the Marina Cranes- Market are Techcrane, PALFINGER MARINE, Liebherr, Konecranes, Storm Cranes, Ascom, Schilstra Boatlift Systems, Vetter Krantechnik, YMV Crane and Winch Systems, CM Energy, DMW Marine Group, Allied Systems, Appleton Marine

What are the Application segmentation covered in the Marina Cranes- Market report?

Ans: The Applications covered in the Marina Cranes- Market report are Marinas, Shipyard, Others

What are the Type segmentation covered in the Marina Cranes- Market report?

Ans: The Types covered in the Marina Cranes- Market report are Fixed Crane, Mobile Crane

1 Market Overview
1.1 Marina Cranes Product Introduction
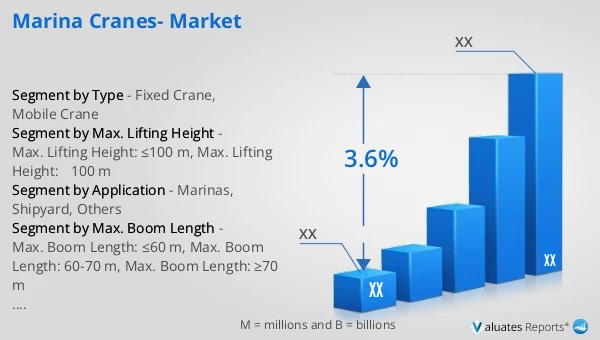
1.2 Global Marina Cranes Market Size Forecast
1.2.1 Global Marina Cranes Sales Value (2021–2032)
1.2.2 Global Marina Cranes Sales Volume (2021–2032)
1.2.3 Global Marina Cranes Sales Price (2021–2032)
1.3 Marina Cranes Market Trends & Drivers
1.3.1 Marina Cranes Industry Trends
1.3.2 Marina Cranes Market Drivers & Opportunities
1.3.3 Marina Cranes Market Challenges
1.3.4 Marina Cranes Market Restraints
1.3.5 Impact of U.S. Tariffs
1.4 Assumptions and Limitations
1.5 Study Objectives
1.6 Years Considered
2 Competitive Analysis by Company
2.1 Global Marina Cranes Players Revenue Ranking (2025)
2.2 Global Marina Cranes Revenue by Company (2021–2026)
2.3 Global Marina Cranes Sales Volume Ranking of Players (2025)
2.4 Global Marina Cranes Sales Volume by Company (2021–2026)
2.5 Global Marina Cranes Average Price by Company (2021–2026)
2.6 Key Manufacturers Marina Cranes Manufacturing Base and Headquarters
2.7 Key Manufacturers Marina Cranes Product Offerings
2.8 Key Manufacturers Start of Mass Production of Marina Cranes
2.9 Marina Cranes Market Competitive Analysis
2.9.1 Marina Cranes Market Concentration Rate (2021–2026)
2.9.2 Global 5 and 10 Largest Manufacturers by Marina Cranes Revenue in 2025
2.9.3 Global Companies by Tier (Tier 1, Tier 2, Tier 3), based on Marina Cranes revenue, 2025
2.10 Mergers & Acquisitions and Expansion
3 Segmentation Marina Cranes Market Classification
3.1 Introduction by Type
3.1.1 Fixed Crane
3.1.2 Mobile Crane
3.1.3 Global Marina Cranes Sales Value by Type
3.1.3.1 Global Marina Cranes Sales Value by Type (2021 vs 2025 vs 2032)
3.1.3.2 Global Marina Cranes Sales Value, by Type (2021–2032)
3.1.3.3 Global Marina Cranes Sales Value, by Type (%), 2021–2032
3.1.4 Global Marina Cranes Sales Volume by Type
3.1.4.1 Global Marina Cranes Sales Volume by Type (2021 vs 2025 vs 2032)
3.1.4.2 Global Marina Cranes Sales Volume, by Type (2021–2032)
3.1.4.3 Global Marina Cranes Sales Volume, by Type (%), 2021–2032
3.1.5 Global Marina Cranes Average Price by Type (2021–2032)
3.2 Introduction by Max. Boom Length
3.2.1 Max. Boom Length: ≤60 m
3.2.2 Max. Boom Length: 60-70 m
3.2.3 Max. Boom Length: ≥70 m
3.2.4 Global Marina Cranes Sales Value by Max. Boom Length
3.2.4.1 Global Marina Cranes Sales Value by Max. Boom Length (2021 vs 2025 vs 2032)
3.2.4.2 Global Marina Cranes Sales Value, by Max. Boom Length (2021–2032)
3.2.4.3 Global Marina Cranes Sales Value, by Max. Boom Length (%), 2021–2032
3.2.5 Global Marina Cranes Sales Volume by Max. Boom Length
3.2.5.1 Global Marina Cranes Sales Volume by Max. Boom Length (2021 vs 2025 vs 2032)
3.2.5.2 Global Marina Cranes Sales Volume, by Max. Boom Length (2021–2032)
3.2.5.3 Global Marina Cranes Sales Volume, by Max. Boom Length (%), 2021–2032
3.2.6 Global Marina Cranes Average Price by Max. Boom Length (2021–2032)
3.3 Introduction by Max. Lifting Height
3.3.1 Max. Lifting Height: ≤100 m
3.3.2 Max. Lifting Height: >100 m
3.3.3 Global Marina Cranes Sales Value by Max. Lifting Height
3.3.3.1 Global Marina Cranes Sales Value by Max. Lifting Height (2021 vs 2025 vs 2032)
3.3.3.2 Global Marina Cranes Sales Value, by Max. Lifting Height (2021–2032)
3.3.3.3 Global Marina Cranes Sales Value, by Max. Lifting Height (%), 2021–2032
3.3.4 Global Marina Cranes Sales Volume by Max. Lifting Height
3.3.4.1 Global Marina Cranes Sales Volume by Max. Lifting Height (2021 vs 2025 vs 2032)
3.3.4.2 Global Marina Cranes Sales Volume, by Max. Lifting Height (2021–2032)
3.3.4.3 Global Marina Cranes Sales Volume, by Max. Lifting Height (%), 2021–2032
3.3.5 Global Marina Cranes Average Price by Max. Lifting Height (2021–2032)
4 Segmentation by Application
4.1 Introduction by Application
4.1.1 Marinas
4.1.2 Shipyard
4.1.3 Others
4.2 Global Marina Cranes Sales Value by Application
4.2.1 Global Marina Cranes Sales Value by Application (2021 vs 2025 vs 2032)
4.2.2 Global Marina Cranes Sales Value, by Application (2021–2032)
4.2.3 Global Marina Cranes Sales Value, by Application (%), 2021–2032
4.3 Global Marina Cranes Sales Volume by Application
4.3.1 Global Marina Cranes Sales Volume by Application (2021 vs 2025 vs 2032)
4.3.2 Global Marina Cranes Sales Volume, by Application (2021–2032)
4.3.3 Global Marina Cranes Sales Volume, by Application (%), 2021–2032
4.4 Global Marina Cranes Average Price by Application (2021–2032)
5 Segmentation by Region
5.1 Global Marina Cranes Sales Value by Region
5.1.1 Global Marina Cranes Sales Value by Region: 2021 vs 2025 vs 2032
5.1.2 Global Marina Cranes Sales Value by Region (2021–2026)
5.1.3 Global Marina Cranes Sales Value by Region (2027–2032)
5.1.4 Global Marina Cranes Sales Value by Region (%), 2021–2032
5.2 Global Marina Cranes Sales Volume by Region
5.2.1 Global Marina Cranes Sales Volume by Region: 2021 vs 2025 vs 2032
5.2.2 Global Marina Cranes Sales Volume by Region (2021–2026)
5.2.3 Global Marina Cranes Sales Volume by Region (2027–2032)
5.2.4 Global Marina Cranes Sales Volume by Region (%), 2021–2032
5.3 Global Marina Cranes Average Price by Region (2021–2032)
5.4 North America
5.4.1 North America Marina Cranes Sales Value, 2021–2032
5.4.2 North America Marina Cranes Sales Value by Country (%), 2025 vs 2032
5.5 Europe
5.5.1 Europe Marina Cranes Sales Value, 2021–2032
5.5.2 Europe Marina Cranes Sales Value by Country (%), 2025 vs 2032
5.6 Asia Pacific
5.6.1 Asia Pacific Marina Cranes Sales Value, 2021–2032
5.6.2 Asia Pacific Marina Cranes Sales Value by Region (%), 2025 vs 2032
5.7 South America
5.7.1 South America Marina Cranes Sales Value, 2021–2032
5.7.2 South America Marina Cranes Sales Value by Country (%), 2025 vs 2032
5.8 Middle East & Africa
5.8.1 Middle East & Africa Marina Cranes Sales Value, 2021–2032
5.8.2 Middle East & Africa Marina Cranes Sales Value by Country (%), 2025 vs 2032
6 Segmentation by Key Countries/Regions
6.1 Key Countries/Regions Marina Cranes Sales Value Growth Trends, 2021 vs 2025 vs 2032
6.2 Key Countries/Regions Marina Cranes Sales Value and Sales Volume
6.2.1 Key Countries/Regions Marina Cranes Sales Value, 2021–2032
6.2.2 Key Countries/Regions Marina Cranes Sales Volume, 2021–2032
6.3 United States
6.3.1 United States Marina Cranes Sales Value, 2021–2032
6.3.2 United States Marina Cranes Sales Value by Type (%), 2025 vs 2032
6.3.3 United States Marina Cranes Sales Value by Application, 2025 vs 2032
6.4 Europe
6.4.1 Europe Marina Cranes Sales Value, 2021–2032
6.4.2 Europe Marina Cranes Sales Value by Type (%), 2025 vs 2032
6.4.3 Europe Marina Cranes Sales Value by Application, 2025 vs 2032
6.5 China
6.5.1 China Marina Cranes Sales Value, 2021–2032
6.5.2 China Marina Cranes Sales Value by Type (%), 2025 vs 2032
6.5.3 China Marina Cranes Sales Value by Application, 2025 vs 2032
6.6 Japan
6.6.1 Japan Marina Cranes Sales Value, 2021–2032
6.6.2 Japan Marina Cranes Sales Value by Type (%), 2025 vs 2032
6.6.3 Japan Marina Cranes Sales Value by Application, 2025 vs 2032
6.7 South Korea
6.7.1 South Korea Marina Cranes Sales Value, 2021–2032
6.7.2 South Korea Marina Cranes Sales Value by Type (%), 2025 vs 2032
6.7.3 South Korea Marina Cranes Sales Value by Application, 2025 vs 2032
6.8 Southeast Asia
6.8.1 Southeast Asia Marina Cranes Sales Value, 2021–2032
6.8.2 Southeast Asia Marina Cranes Sales Value by Type (%), 2025 vs 2032
6.8.3 Southeast Asia Marina Cranes Sales Value by Application, 2025 vs 2032
6.9 India
6.9.1 India Marina Cranes Sales Value, 2021–2032
6.9.2 India Marina Cranes Sales Value by Type (%), 2025 vs 2032
6.9.3 India Marina Cranes Sales Value by Application, 2025 vs 2032
7 Company Profiles
7.1 Techcrane
7.1.1 Techcrane Company Information
7.1.2 Techcrane Introduction and Business Overview
7.1.3 Techcrane Marina Cranes Sales, Revenue, Price and Gross Margin (2021–2026)
7.1.4 Techcrane Marina Cranes Product Offerings
7.1.5 Techcrane Recent Developments
7.2 PALFINGER MARINE
7.2.1 PALFINGER MARINE Company Information
7.2.2 PALFINGER MARINE Introduction and Business Overview
7.2.3 PALFINGER MARINE Marina Cranes Sales, Revenue, Price and Gross Margin (2021–2026)
7.2.4 PALFINGER MARINE Marina Cranes Product Offerings
7.2.5 PALFINGER MARINE Recent Developments
7.3 Liebherr
7.3.1 Liebherr Company Information
7.3.2 Liebherr Introduction and Business Overview
7.3.3 Liebherr Marina Cranes Sales, Revenue, Price and Gross Margin (2021–2026)
7.3.4 Liebherr Marina Cranes Product Offerings
7.3.5 Liebherr Recent Developments
7.4 Konecranes
7.4.1 Konecranes Company Information
7.4.2 Konecranes Introduction and Business Overview
7.4.3 Konecranes Marina Cranes Sales, Revenue, Price and Gross Margin (2021–2026)
7.4.4 Konecranes Marina Cranes Product Offerings
7.4.5 Konecranes Recent Developments
7.5 Storm Cranes
7.5.1 Storm Cranes Company Information
7.5.2 Storm Cranes Introduction and Business Overview
7.5.3 Storm Cranes Marina Cranes Sales, Revenue, Price and Gross Margin (2021–2026)
7.5.4 Storm Cranes Marina Cranes Product Offerings
7.5.5 Storm Cranes Recent Developments
7.6 Ascom
7.6.1 Ascom Company Information
7.6.2 Ascom Introduction and Business Overview
7.6.3 Ascom Marina Cranes Sales, Revenue, Price and Gross Margin (2021–2026)
7.6.4 Ascom Marina Cranes Product Offerings
7.6.5 Ascom Recent Developments
7.7 Schilstra Boatlift Systems
7.7.1 Schilstra Boatlift Systems Company Information
7.7.2 Schilstra Boatlift Systems Introduction and Business Overview
7.7.3 Schilstra Boatlift Systems Marina Cranes Sales, Revenue, Price and Gross Margin (2021–2026)
7.7.4 Schilstra Boatlift Systems Marina Cranes Product Offerings
7.7.5 Schilstra Boatlift Systems Recent Developments
7.8 Vetter Krantechnik
7.8.1 Vetter Krantechnik Company Information
7.8.2 Vetter Krantechnik Introduction and Business Overview
7.8.3 Vetter Krantechnik Marina Cranes Sales, Revenue, Price and Gross Margin (2021–2026)
7.8.4 Vetter Krantechnik Marina Cranes Product Offerings
7.8.5 Vetter Krantechnik Recent Developments
7.9 YMV Crane and Winch Systems
7.9.1 YMV Crane and Winch Systems Company Information
7.9.2 YMV Crane and Winch Systems Introduction and Business Overview
7.9.3 YMV Crane and Winch Systems Marina Cranes Sales, Revenue, Price and Gross Margin (2021–2026)
7.9.4 YMV Crane and Winch Systems Marina Cranes Product Offerings
7.9.5 YMV Crane and Winch Systems Recent Developments
7.10 CM Energy
7.10.1 CM Energy Company Information
7.10.2 CM Energy Introduction and Business Overview
7.10.3 CM Energy Marina Cranes Sales, Revenue, Price and Gross Margin (2021–2026)
7.10.4 CM Energy Marina Cranes Product Offerings
7.10.5 CM Energy Recent Developments
7.11 DMW Marine Group
7.11.1 DMW Marine Group Company Information
7.11.2 DMW Marine Group Introduction and Business Overview
7.11.3 DMW Marine Group Marina Cranes Sales, Revenue, Price and Gross Margin (2021–2026)
7.11.4 DMW Marine Group Marina Cranes Product Offerings
7.11.5 DMW Marine Group Recent Developments
7.12 Allied Systems
7.12.1 Allied Systems Company Information
7.12.2 Allied Systems Introduction and Business Overview
7.12.3 Allied Systems Marina Cranes Sales, Revenue, Price and Gross Margin (2021–2026)
7.12.4 Allied Systems Marina Cranes Product Offerings
7.12.5 Allied Systems Recent Developments
7.13 Appleton Marine
7.13.1 Appleton Marine Company Information
7.13.2 Appleton Marine Introduction and Business Overview
7.13.3 Appleton Marine Marina Cranes Sales, Revenue, Price and Gross Margin (2021–2026)
7.13.4 Appleton Marine Marina Cranes Product Offerings
7.13.5 Appleton Marine Recent Developments
8 Industry Chain Analysis
8.1 Marina Cranes Industrial Chain
8.2 Marina Cranes Upstream Analysis
8.2.1 Key Raw Materials
8.2.2 Key Suppliers of Raw Materials
8.2.3 Manufacturing Cost Structure
8.3 Midstream Analysis
8.4 Downstream Analysis (Customer Analysis)
8.5 Sales Model and Sales Channelss
8.5.1 Marina Cranes Sales Model
8.5.2 Sales Channels
8.5.3 Marina Cranes Distributors
9 Research Findings and Conclusion
10 Appendix
10.1 Research Methodology
10.1.1 Methodology/Research Approach
10.1.1.1 Research Programs/Design
10.1.1.2 Market Size Estimation
10.1.1.3 Market Breakdown and Data Triangulation
10.1.2 Data Source
10.1.2.1 Secondary Sources
10.1.2.2 Primary Sources
10.2 Author Details
10.3 Disclaimer
List of Tables
 Table 1. Marina Cranes Market Trends
 Table 2. Marina Cranes Market Drivers & Opportunities
 Table 3. Marina Cranes Market Challenges
 Table 4. Marina Cranes Market Restraints


List of Figures
 Figure 1. Marina Cranes Product Picture
 Figure 2. Global Marina Cranes Sales Value, 2021 vs 2025 vs 2032 (US$ Million)
 Figure 3. Global Marina Cranes Sales Value (US$ Million), 2021–2032
 Figure 4. Global Marina Cranes Sales Volume (Units), 2021–2032
 Figure 5. Global Marina Cranes Sales Price (K US$/Unit), 2021–2032
 Figure 6. Marina Cranes Report Years Considered
 Figure 7. Global Marina Cranes Players Revenue Ranking (US$ Million), 2025
 Figure 8. Global Marina Cranes Sales Volume Ranking of Players (Units), 2025
 Figure 9. The 5 and 10 Largest Manufacturers in the World: Market Share by Marina Cranes Revenue in 2025
 Figure 10. Marina Cranes Market Share by Company Type (Tier 1, Tier 2, and Tier 3): 2021 vs 2025
 Figure 11. Fixed Crane Picture
 Figure 12. Mobile Crane Picture
 Figure 13. Global Marina Cranes Sales Value by Type (US$ Million), 2021 vs 2025 vs 2032
 Figure 14. Global Marina Cranes Sales Value Market Share by Type, 2025 & 2032
 Figure 15. Global Marina Cranes Sales Volume by Type (Units), 2021 vs 2025 vs 2032
 Figure 16. Global Marina Cranes Sales Volume Market Share by Type, 2025 & 2032
 Figure 17. Global Marina Cranes Price by Type (K US$/Unit), 2021–2032
 Figure 18. Max. Boom Length: ≤60 m Picture
 Figure 19. Max. Boom Length: 60-70 m Picture
 Figure 20. Max. Boom Length: ≥70 m Picture
 Figure 21. Global Marina Cranes Sales Value by Max. Boom Length (US$ Million), 2021 vs 2025 vs 2032
 Figure 22. Global Marina Cranes Sales Value Market Share by Max. Boom Length, 2025 & 2032
 Figure 23. Global Marina Cranes Sales Volume by Max. Boom Length (Units), 2021 vs 2025 vs 2032
 Figure 24. Global Marina Cranes Sales Volume Market Share by Max. Boom Length, 2025 & 2032
 Figure 25. Global Marina Cranes Price by Max. Boom Length (K US$/Unit), 2021–2032
 Figure 26. Max. Lifting Height: ≤100 m Picture
 Figure 27. Max. Lifting Height: >100 m Picture
 Figure 28. Global Marina Cranes Sales Value by Max. Lifting Height (US$ Million), 2021 vs 2025 vs 2032
 Figure 29. Global Marina Cranes Sales Value Market Share by Max. Lifting Height, 2025 & 2032
 Figure 30. Global Marina Cranes Sales Volume by Max. Lifting Height (Units), 2021 vs 2025 vs 2032
 Figure 31. Global Marina Cranes Sales Volume Market Share by Max. Lifting Height, 2025 & 2032
 Figure 32. Global Marina Cranes Price by Max. Lifting Height (K US$/Unit), 2021–2032
 Figure 33. Product Picture of Marinas
 Figure 34. Product Picture of Shipyard
 Figure 35. Product Picture of Others
 Figure 36. Global Marina Cranes Sales Value by Application (US$ Million), 2021 vs 2025 vs 2032
 Figure 37. Global Marina Cranes Sales Value Market Share by Application, 2025 & 2032
 Figure 38. Global Marina Cranes Sales Volume by Application (Units), 2021 vs 2025 vs 2032
 Figure 39. Global Marina Cranes Sales Volume Market Share by Application, 2025 & 2032
 Figure 40. Global Marina Cranes Price by Application (K US$/Unit), 2021–2032
 Figure 41. North America Marina Cranes Sales Value (US$ Million), 2021–2032
 Figure 42. North America Marina Cranes Sales Value by Country (%), 2025 vs 2032
 Figure 43. Europe Marina Cranes Sales Value (US$ Million), 2021–2032
 Figure 44. Europe Marina Cranes Sales Value by Country (%), 2025 vs 2032
 Figure 45. Asia Pacific Marina Cranes Sales Value (US$ Million), 2021–2032
 Figure 46. Asia Pacific Marina Cranes Sales Value by Region (%), 2025 vs 2032
 Figure 47. South America Marina Cranes Sales Value (US$ Million), 2021–2032
 Figure 48. South America Marina Cranes Sales Value by Country (%), 2025 vs 2032
 Figure 49. Middle East & Africa Marina Cranes Sales Value (US$ Million), 2021–2032
 Figure 50. Middle East & Africa Marina Cranes Sales Value by Country (%), 2025 vs 2032
 Figure 51. Key Countries/Regions Marina Cranes Sales Value (%), 2021–2032
 Figure 52. Key Countries/Regions Marina Cranes Sales Volume (%), 2021–2032
 Figure 53. United States Marina Cranes Sales Value (US$ Million), 2021–2032
 Figure 54. United States Marina Cranes Sales Value by Type (%), 2025 vs 2032
 Figure 55. United States Marina Cranes Sales Value by Application (%), 2025 vs 2032
 Figure 56. Europe Marina Cranes Sales Value (US$ Million), 2021–2032
 Figure 57. Europe Marina Cranes Sales Value by Type (%), 2025 vs 2032
 Figure 58. Europe Marina Cranes Sales Value by Application (%), 2025 vs 2032
 Figure 59. China Marina Cranes Sales Value (US$ Million), 2021–2032
 Figure 60. China Marina Cranes Sales Value by Type (%), 2025 vs 2032
 Figure 61. China Marina Cranes Sales Value by Application (%), 2025 vs 2032
 Figure 62. Japan Marina Cranes Sales Value (US$ Million), 2021–2032
 Figure 63. Japan Marina Cranes Sales Value by Type (%), 2025 vs 2032
 Figure 64. Japan Marina Cranes Sales Value by Application (%), 2025 vs 2032
 Figure 65. South Korea Marina Cranes Sales Value (US$ Million), 2021–2032
 Figure 66. South Korea Marina Cranes Sales Value by Type (%), 2025 vs 2032
 Figure 67. South Korea Marina Cranes Sales Value by Application (%), 2025 vs 2032
 Figure 68. Southeast Asia Marina Cranes Sales Value (US$ Million), 2021–2032
 Figure 69. Southeast Asia Marina Cranes Sales Value by Type (%), 2025 vs 2032
 Figure 70. Southeast Asia Marina Cranes Sales Value by Application (%), 2025 vs 2032
 Figure 71. India Marina Cranes Sales Value (US$ Million), 2021–2032
 Figure 72. India Marina Cranes Sales Value by Type (%), 2025 vs 2032
 Figure 73. India Marina Cranes Sales Value by Application (%), 2025 vs 2032
 Figure 74. Marina Cranes Industrial Chain
 Figure 75. Marina Cranes Manufacturing Cost Structure
 Figure 76. Channels of Distribution (Direct Sales, and Distribution)
 Figure 77. Bottom-up and Top-down Approaches for This Report
 Figure 78. Data Triangulation
 Figure 79. Key Executives Interviewed
SELECT A FORMAT
Added to Cart
Electronic

$3950

Single User License
Electronic

$5925

Multi User License
Electronic

$7900

Enterprise License
Add to Cart
Buy Now (15% Discount)

OUR CUSTOMER

Bioinformatics Barcelona