1 Market Overview
1.1 Quayside Crane Product Introduction
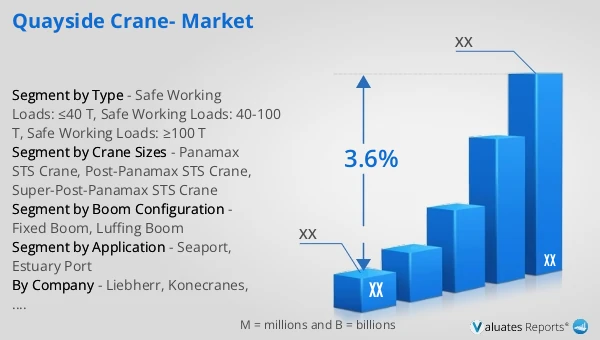
1.2 Global Quayside Crane Market Size Forecast
1.2.1 Global Quayside Crane Sales Value (2021–2032)
1.2.2 Global Quayside Crane Sales Volume (2021–2032)
1.2.3 Global Quayside Crane Sales Price (2021–2032)
1.3 Quayside Crane Market Trends & Drivers
1.3.1 Quayside Crane Industry Trends
1.3.2 Quayside Crane Market Drivers & Opportunities
1.3.3 Quayside Crane Market Challenges
1.3.4 Quayside Crane Market Restraints
1.3.5 Impact of U.S. Tariffs
1.4 Assumptions and Limitations
1.5 Study Objectives
1.6 Years Considered
2 Competitive Analysis by Company
2.1 Global Quayside Crane Players Revenue Ranking (2025)
2.2 Global Quayside Crane Revenue by Company (2021–2026)
2.3 Global Quayside Crane Sales Volume Ranking of Players (2025)
2.4 Global Quayside Crane Sales Volume by Company (2021–2026)
2.5 Global Quayside Crane Average Price by Company (2021–2026)
2.6 Key Manufacturers Quayside Crane Manufacturing Base and Headquarters
2.7 Key Manufacturers Quayside Crane Product Offerings
2.8 Key Manufacturers Start of Mass Production of Quayside Crane
2.9 Quayside Crane Market Competitive Analysis
2.9.1 Quayside Crane Market Concentration Rate (2021–2026)
2.9.2 Global 5 and 10 Largest Manufacturers by Quayside Crane Revenue in 2025
2.9.3 Global Companies by Tier (Tier 1, Tier 2, Tier 3), based on Quayside Crane revenue, 2025
2.10 Mergers & Acquisitions and Expansion
3 Segmentation Quayside Crane Market Classification
3.1 Introduction by Type
3.1.1 Safe Working Loads: ≤40 T
3.1.2 Safe Working Loads: 40-100 T
3.1.3 Safe Working Loads: ≥100 T
3.1.4 Global Quayside Crane Sales Value by Type
3.1.4.1 Global Quayside Crane Sales Value by Type (2021 vs 2025 vs 2032)
3.1.4.2 Global Quayside Crane Sales Value, by Type (2021–2032)
3.1.4.3 Global Quayside Crane Sales Value, by Type (%), 2021–2032
3.1.5 Global Quayside Crane Sales Volume by Type
3.1.5.1 Global Quayside Crane Sales Volume by Type (2021 vs 2025 vs 2032)
3.1.5.2 Global Quayside Crane Sales Volume, by Type (2021–2032)
3.1.5.3 Global Quayside Crane Sales Volume, by Type (%), 2021–2032
3.1.6 Global Quayside Crane Average Price by Type (2021–2032)
3.2 Introduction by Boom Configuration
3.2.1 Fixed Boom
3.2.2 Luffing Boom
3.2.3 Global Quayside Crane Sales Value by Boom Configuration
3.2.3.1 Global Quayside Crane Sales Value by Boom Configuration (2021 vs 2025 vs 2032)
3.2.3.2 Global Quayside Crane Sales Value, by Boom Configuration (2021–2032)
3.2.3.3 Global Quayside Crane Sales Value, by Boom Configuration (%), 2021–2032
3.2.4 Global Quayside Crane Sales Volume by Boom Configuration
3.2.4.1 Global Quayside Crane Sales Volume by Boom Configuration (2021 vs 2025 vs 2032)
3.2.4.2 Global Quayside Crane Sales Volume, by Boom Configuration (2021–2032)
3.2.4.3 Global Quayside Crane Sales Volume, by Boom Configuration (%), 2021–2032
3.2.5 Global Quayside Crane Average Price by Boom Configuration (2021–2032)
3.3 Introduction by Crane Sizes
3.3.1 Panamax STS Crane
3.3.2 Post-Panamax STS Crane
3.3.3 Super-Post-Panamax STS Crane
3.3.4 Global Quayside Crane Sales Value by Crane Sizes
3.3.4.1 Global Quayside Crane Sales Value by Crane Sizes (2021 vs 2025 vs 2032)
3.3.4.2 Global Quayside Crane Sales Value, by Crane Sizes (2021–2032)
3.3.4.3 Global Quayside Crane Sales Value, by Crane Sizes (%), 2021–2032
3.3.5 Global Quayside Crane Sales Volume by Crane Sizes
3.3.5.1 Global Quayside Crane Sales Volume by Crane Sizes (2021 vs 2025 vs 2032)
3.3.5.2 Global Quayside Crane Sales Volume, by Crane Sizes (2021–2032)
3.3.5.3 Global Quayside Crane Sales Volume, by Crane Sizes (%), 2021–2032
3.3.6 Global Quayside Crane Average Price by Crane Sizes (2021–2032)
4 Segmentation by Application
4.1 Introduction by Application
4.1.1 Seaport
4.1.2 Estuary Port
4.2 Global Quayside Crane Sales Value by Application
4.2.1 Global Quayside Crane Sales Value by Application (2021 vs 2025 vs 2032)
4.2.2 Global Quayside Crane Sales Value, by Application (2021–2032)
4.2.3 Global Quayside Crane Sales Value, by Application (%), 2021–2032
4.3 Global Quayside Crane Sales Volume by Application
4.3.1 Global Quayside Crane Sales Volume by Application (2021 vs 2025 vs 2032)
4.3.2 Global Quayside Crane Sales Volume, by Application (2021–2032)
4.3.3 Global Quayside Crane Sales Volume, by Application (%), 2021–2032
4.4 Global Quayside Crane Average Price by Application (2021–2032)
5 Segmentation by Region
5.1 Global Quayside Crane Sales Value by Region
5.1.1 Global Quayside Crane Sales Value by Region: 2021 vs 2025 vs 2032
5.1.2 Global Quayside Crane Sales Value by Region (2021–2026)
5.1.3 Global Quayside Crane Sales Value by Region (2027–2032)
5.1.4 Global Quayside Crane Sales Value by Region (%), 2021–2032
5.2 Global Quayside Crane Sales Volume by Region
5.2.1 Global Quayside Crane Sales Volume by Region: 2021 vs 2025 vs 2032
5.2.2 Global Quayside Crane Sales Volume by Region (2021–2026)
5.2.3 Global Quayside Crane Sales Volume by Region (2027–2032)
5.2.4 Global Quayside Crane Sales Volume by Region (%), 2021–2032
5.3 Global Quayside Crane Average Price by Region (2021–2032)
5.4 North America
5.4.1 North America Quayside Crane Sales Value, 2021–2032
5.4.2 North America Quayside Crane Sales Value by Country (%), 2025 vs 2032
5.5 Europe
5.5.1 Europe Quayside Crane Sales Value, 2021–2032
5.5.2 Europe Quayside Crane Sales Value by Country (%), 2025 vs 2032
5.6 Asia Pacific
5.6.1 Asia Pacific Quayside Crane Sales Value, 2021–2032
5.6.2 Asia Pacific Quayside Crane Sales Value by Region (%), 2025 vs 2032
5.7 South America
5.7.1 South America Quayside Crane Sales Value, 2021–2032
5.7.2 South America Quayside Crane Sales Value by Country (%), 2025 vs 2032
5.8 Middle East & Africa
5.8.1 Middle East & Africa Quayside Crane Sales Value, 2021–2032
5.8.2 Middle East & Africa Quayside Crane Sales Value by Country (%), 2025 vs 2032
6 Segmentation by Key Countries/Regions
6.1 Key Countries/Regions Quayside Crane Sales Value Growth Trends, 2021 vs 2025 vs 2032
6.2 Key Countries/Regions Quayside Crane Sales Value and Sales Volume
6.2.1 Key Countries/Regions Quayside Crane Sales Value, 2021–2032
6.2.2 Key Countries/Regions Quayside Crane Sales Volume, 2021–2032
6.3 United States
6.3.1 United States Quayside Crane Sales Value, 2021–2032
6.3.2 United States Quayside Crane Sales Value by Type (%), 2025 vs 2032
6.3.3 United States Quayside Crane Sales Value by Application, 2025 vs 2032
6.4 Europe
6.4.1 Europe Quayside Crane Sales Value, 2021–2032
6.4.2 Europe Quayside Crane Sales Value by Type (%), 2025 vs 2032
6.4.3 Europe Quayside Crane Sales Value by Application, 2025 vs 2032
6.5 China
6.5.1 China Quayside Crane Sales Value, 2021–2032
6.5.2 China Quayside Crane Sales Value by Type (%), 2025 vs 2032
6.5.3 China Quayside Crane Sales Value by Application, 2025 vs 2032
6.6 Japan
6.6.1 Japan Quayside Crane Sales Value, 2021–2032
6.6.2 Japan Quayside Crane Sales Value by Type (%), 2025 vs 2032
6.6.3 Japan Quayside Crane Sales Value by Application, 2025 vs 2032
6.7 South Korea
6.7.1 South Korea Quayside Crane Sales Value, 2021–2032
6.7.2 South Korea Quayside Crane Sales Value by Type (%), 2025 vs 2032
6.7.3 South Korea Quayside Crane Sales Value by Application, 2025 vs 2032
6.8 Southeast Asia
6.8.1 Southeast Asia Quayside Crane Sales Value, 2021–2032
6.8.2 Southeast Asia Quayside Crane Sales Value by Type (%), 2025 vs 2032
6.8.3 Southeast Asia Quayside Crane Sales Value by Application, 2025 vs 2032
6.9 India
6.9.1 India Quayside Crane Sales Value, 2021–2032
6.9.2 India Quayside Crane Sales Value by Type (%), 2025 vs 2032
6.9.3 India Quayside Crane Sales Value by Application, 2025 vs 2032
7 Company Profiles
7.1 Liebherr
7.1.1 Liebherr Company Information
7.1.2 Liebherr Introduction and Business Overview
7.1.3 Liebherr Quayside Crane Sales, Revenue, Price and Gross Margin (2021–2026)
7.1.4 Liebherr Quayside Crane Product Offerings
7.1.5 Liebherr Recent Developments
7.2 Konecranes
7.2.1 Konecranes Company Information
7.2.2 Konecranes Introduction and Business Overview
7.2.3 Konecranes Quayside Crane Sales, Revenue, Price and Gross Margin (2021–2026)
7.2.4 Konecranes Quayside Crane Product Offerings
7.2.5 Konecranes Recent Developments
7.3 SANY
7.3.1 SANY Company Information
7.3.2 SANY Introduction and Business Overview
7.3.3 SANY Quayside Crane Sales, Revenue, Price and Gross Margin (2021–2026)
7.3.4 SANY Quayside Crane Product Offerings
7.3.5 SANY Recent Developments
7.4 Kalmar
7.4.1 Kalmar Company Information
7.4.2 Kalmar Introduction and Business Overview
7.4.3 Kalmar Quayside Crane Sales, Revenue, Price and Gross Margin (2021–2026)
7.4.4 Kalmar Quayside Crane Product Offerings
7.4.5 Kalmar Recent Developments
7.5 PACECO Corp
7.5.1 PACECO Corp Company Information
7.5.2 PACECO Corp Introduction and Business Overview
7.5.3 PACECO Corp Quayside Crane Sales, Revenue, Price and Gross Margin (2021–2026)
7.5.4 PACECO Corp Quayside Crane Product Offerings
7.5.5 PACECO Corp Recent Developments
7.6 HD Hyundai Samho
7.6.1 HD Hyundai Samho Company Information
7.6.2 HD Hyundai Samho Introduction and Business Overview
7.6.3 HD Hyundai Samho Quayside Crane Sales, Revenue, Price and Gross Margin (2021–2026)
7.6.4 HD Hyundai Samho Quayside Crane Product Offerings
7.6.5 HD Hyundai Samho Recent Developments
7.7 Mitsui E&S
7.7.1 Mitsui E&S Company Information
7.7.2 Mitsui E&S Introduction and Business Overview
7.7.3 Mitsui E&S Quayside Crane Sales, Revenue, Price and Gross Margin (2021–2026)
7.7.4 Mitsui E&S Quayside Crane Product Offerings
7.7.5 Mitsui E&S Recent Developments
7.8 Anupam Industries
7.8.1 Anupam Industries Company Information
7.8.2 Anupam Industries Introduction and Business Overview
7.8.3 Anupam Industries Quayside Crane Sales, Revenue, Price and Gross Margin (2021–2026)
7.8.4 Anupam Industries Quayside Crane Product Offerings
7.8.5 Anupam Industries Recent Developments
7.9 Wison Offshore & Marine
7.9.1 Wison Offshore & Marine Company Information
7.9.2 Wison Offshore & Marine Introduction and Business Overview
7.9.3 Wison Offshore & Marine Quayside Crane Sales, Revenue, Price and Gross Margin (2021–2026)
7.9.4 Wison Offshore & Marine Quayside Crane Product Offerings
7.9.5 Wison Offshore & Marine Recent Developments
7.10 DHHI
7.10.1 DHHI Company Information
7.10.2 DHHI Introduction and Business Overview
7.10.3 DHHI Quayside Crane Sales, Revenue, Price and Gross Margin (2021–2026)
7.10.4 DHHI Quayside Crane Product Offerings
7.10.5 DHHI Recent Developments
7.11 Weihua Group
7.11.1 Weihua Group Company Information
7.11.2 Weihua Group Introduction and Business Overview
7.11.3 Weihua Group Quayside Crane Sales, Revenue, Price and Gross Margin (2021–2026)
7.11.4 Weihua Group Quayside Crane Product Offerings
7.11.5 Weihua Group Recent Developments
7.12 Rainbow
7.12.1 Rainbow Company Information
7.12.2 Rainbow Introduction and Business Overview
7.12.3 Rainbow Quayside Crane Sales, Revenue, Price and Gross Margin (2021–2026)
7.12.4 Rainbow Quayside Crane Product Offerings
7.12.5 Rainbow Recent Developments
7.13 GENMA Solutions
7.13.1 GENMA Solutions Company Information
7.13.2 GENMA Solutions Introduction and Business Overview
7.13.3 GENMA Solutions Quayside Crane Sales, Revenue, Price and Gross Margin (2021–2026)
7.13.4 GENMA Solutions Quayside Crane Product Offerings
7.13.5 GENMA Solutions Recent Developments
7.14 ARDELT Kranbau
7.14.1 ARDELT Kranbau Company Information
7.14.2 ARDELT Kranbau Introduction and Business Overview
7.14.3 ARDELT Kranbau Quayside Crane Sales, Revenue, Price and Gross Margin (2021–2026)
7.14.4 ARDELT Kranbau Quayside Crane Product Offerings
7.14.5 ARDELT Kranbau Recent Developments
7.15 KOCKS / Kocks-Ardelt
7.15.1 KOCKS / Kocks-Ardelt Company Information
7.15.2 KOCKS / Kocks-Ardelt Introduction and Business Overview
7.15.3 KOCKS / Kocks-Ardelt Quayside Crane Sales, Revenue, Price and Gross Margin (2021–2026)
7.15.4 KOCKS / Kocks-Ardelt Quayside Crane Product Offerings
7.15.5 KOCKS / Kocks-Ardelt Recent Developments
7.16 Wuxin
7.16.1 Wuxin Company Information
7.16.2 Wuxin Introduction and Business Overview
7.16.3 Wuxin Quayside Crane Sales, Revenue, Price and Gross Margin (2021–2026)
7.16.4 Wuxin Quayside Crane Product Offerings
7.16.5 Wuxin Recent Developments
8 Industry Chain Analysis
8.1 Quayside Crane Industrial Chain
8.2 Quayside Crane Upstream Analysis
8.2.1 Key Raw Materials
8.2.2 Key Suppliers of Raw Materials
8.2.3 Manufacturing Cost Structure
8.3 Midstream Analysis
8.4 Downstream Analysis (Customer Analysis)
8.5 Sales Model and Sales Channelss
8.5.1 Quayside Crane Sales Model
8.5.2 Sales Channels
8.5.3 Quayside Crane Distributors
9 Research Findings and Conclusion
10 Appendix
10.1 Research Methodology
10.1.1 Methodology/Research Approach
10.1.1.1 Research Programs/Design
10.1.1.2 Market Size Estimation
10.1.1.3 Market Breakdown and Data Triangulation
10.1.2 Data Source
10.1.2.1 Secondary Sources
10.1.2.2 Primary Sources
10.2 Author Details
10.3 Disclaimer