Payment Processing Solutions Market
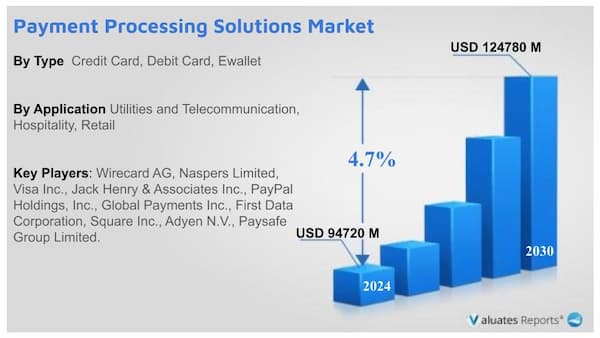
The global Payment Processing Solutions market is projected to grow from US$ 94720 million in 2024 to US$ 124780 million by 2030, at a Compound Annual Growth Rate (CAGR) of 4.7% during the forecast period.
A recently published report, titled “Global Payment Processing Solutions Market Size, Status and Forecast 2022” gives an overview of the overall Payment Processing Solutions market. This section sheds light on key impact-rendering drivers and constraints that are impacting the growth. It permits users to understand the different shortcomings and how they may hamper the development afterward. This segment is considered to be one of the most crucial segments of the report as it helps readers comprehend the impact of various macro and microeconomic factors on development. The role of various sectors, including small-scale and large-scale, in the expansion has also been discussed in the report. Additionally, the industry experts have put forth the current trends and prospects, which are likely to aid the growth in the upcoming years.
Impact of Covid-19 Outbreak
This section of the report has explored the overall status of the Covid scenario and has offered valuable insights into the changes in supply chain disruption, fluctuations in demand, etc. The analysts have also focused on the key measures that the companies are opting to withstand the harsh scenario.
Payment Processing Solutions Market Trends
The adoption of mobile payment applications and the rising penetration of smartphones is projected to boost the growth of the payment processing solution market. Customers can use smartphone applications to pay in a variety of ways. These applications have allowed customers to finish invoicing transactions more rapidly.
During the projected period, the desire for speedier transactions is expected to drive the growth of the payment processing solutions market. As a result of online buying, customers' expectations for payment immediacy have shifted. Customers expect firms to provide faster transaction services across the board.
The expansion of the payment processing solutions market is predicted to be fueled by rising eCommerce sales and faster internet speeds. The retail industry has changed away from old business models as a result of current payment technologies, greater smartphone transactions, and the growing use of online card payments. Retailers are increasingly focusing their efforts both online and offline on developing innovative mobile payment solutions, risk management, and customer service.
The payment processing solution market size is predicted to grow as a result of favorable government efforts. Payment services are essential for a country's economic growth. Payment processing technology will progressively give customers and organizations a number of personalized, easy, and varied transaction options as a result of digitization and ongoing technical improvements. Governments recognize that the usage of digital payments is fast-growing, and they want to make sure that everyone has the capacity to pay for products and services in this manner.
Payment Processing Solutions Market Segment Analysis
The Payment Processing Solutions Market is Segmented Type (Credit Card, Debit Card, Ewallet), Application (Hospitality, Retail, Utilities, and Telecommunication, Others). The report covers the global opportunity analysis and industry forecast from 2021 to 2026.
Based on the region, North America is expected to hold the largest payment processing solution market share during the forecast period. Market expansion is being fueled by the increased usage of digital payment solutions in North American countries. Furthermore, the region's increased acceptance of mobile wallets is likely to boost the payment processing market size. The Asia-Pacific region, on the other hand, is predicted to experience the fastest development due to the increased usage of smartphones and internet services.
The e-wallet segment is expected to grow the fastest throughout the forecast period, based on payment methods.
The Hospitality end-user sector is likely to have the biggest payment processing solution market share, while the retail end-user segment is expected to grow at the fastest rate.
Major Players in the Payment Processing Solutions Market
The Payment Processing Solutions is moderately fragmented with large companies dominating the market.
The top companies in the payment processing solution market include:
- Visa Inc.
Visa Inc., headquartered in Foster City, California, is an American international financial services firm. It supports electronic funds transfers all around the world, with Visa-branded credit cards, debit cards, and prepaid cards being the most frequent methods.
- PayPal Holdings, Inc.
PayPal Holdings, Inc. is an American firm that operates an online payments system in the majority of nations that allow for online money transfers and serves as an electronic alternative to traditional paper methods like cheques and money orders.
Other top companies analyzed in the report include:
- Wirecard AG
- Naspers Limited
- Jack Henry & Associates Inc.
- Global Payments Inc.
- First Data Corporation
- Square Inc.
- Adyen N.V.
- Paysafe Group Limited
Payment Processing Solutions Market by Type
- Credit Card
- Debit Card
- Ewallet
Payment Processing Solutions Market by Application
- Hospitality
- Retail
- Utilities and Telecommunication
- Others
Payment Processing Solutions Market by Country-Level Analysis
- North America
- United States
- Canada
- Europe
- Germany
- France
- U.K.
- Italy
- Russia
- Nordic
- Rest of Europe
- Asia-Pacific
- China
- Japan
- South Korea
- Southeast Asia
- India
- Australia
- Rest of Asia-Pacific
- Latin America
- Mexico
- Brazil
- Middle East & Africa
- Turkey
- Saudi Arabia
- UAE
- Rest of Middle East & Africa
Scope of the Payment Processing Solutions Market Report
|
Report Metric |
Details |
|
Report Name |
Payment Processing Solutions Market |
|
The market size in 2020 |
$33810 Million |
|
The revenue forecast in 2027 |
$52060 Million |
|
Growth Rate |
CAGR of 5.9% from 2021 to 2027 |
|
Base year considered |
2020 |
|
Forecast period |
2021-2027 |
|
Forecast units |
Value (USD) |
|
Segments covered |
Type, End-User, Offerings, and Region |
|
Market by Type |
Credit Card, Debit Card, Ewallet |
|
Market by Applications/Enduser |
Hospitality, Retail, Utilities and Telecommunication, Others |
|
Report coverage |
Revenue & volume forecast, company share, competitive landscape, growth factors, and trends |
|
Geographic regions covered |
North America, Europe, Asia Pacific, Latin America, Middle East & Africa |
Frequently Asked Questions About This Report
1. What will be the global payment processing solutions market size from 2020 to 2027?
Ans. The global Payment Processing Solutions market size is projected to reach US$ 52060 million by 2027, from US$ 33810 million in 2020, at a Compound Annual Growth Rate (CAGR) of 5.9% during 2021-2027.
2. Which region dominated in the global payment processing solutions market?
Ans. North America dominates the market and is expected to grow at the highest CAGR during the forecast period.
3. What are the upcoming trends or opportunities in the payment processing solutions market?
Ans. The high penetration of smartphones and the adoption of mobile payment applications are expected to drive the growth of the payment processing solution market size. Smartphone applications provide customers with alternative billing options. Customers have been able to complete billing transactions more quickly due to these applications.
4. Which market payment method segment dominates the payment processing solutions market share?
Ans. The e-wallet segment is anticipated to witness the fastest growth over the forecast period
5. Which market end-user segment dominates the payment processing solutions market share?
Ans. The hospitality segment is expected to hold the largest payment processing solution market share, and the retail end-use segment is anticipated to witness the fastest growth.
6. Who are the top companies hold the market share in the payment processing solutions market?
Ans. Some top companies operating in the payment processing solutions market are Wirecard AG, Naspers Limited, Visa Inc., Jack Henry & Associates Inc., PayPal Holdings, Inc., Global Payments Inc., First Data Corporation, Square Inc., Adyen N.V.
1 Report Overview
1.1 Study Scope
1.2 Market Analysis by Type
1.2.1 Global Payment Processing Solutions Market Size Growth Rate by Type, 2019 VS 2023 VS 2030
1.2.2 Credit Card
1.2.3 Debit Card
1.2.4 Ewallet
1.3 Market by Application
1.3.1 Global Payment Processing Solutions Market Size Growth Rate by Application, 2019 VS 2023 VS 2030
1.3.2 Hospitality
1.3.3 Retail
1.3.4 Utilities and Telecommunication
1.3.5 Others
1.4 Assumptions and Limitations
1.5 Study Objectives
1.6 Years Considered
2 Global Growth Trends
2.1 Global Payment Processing Solutions Market Perspective (2019-2030)
2.2 Global Payment Processing Solutions Growth Trends by Region
2.2.1 Payment Processing Solutions Market Size by Region: 2019 VS 2023 VS 2030
2.2.2 Payment Processing Solutions Historic Market Size by Region (2019-2024)
2.2.3 Payment Processing Solutions Forecasted Market Size by Region (2025-2030)
2.3 Payment Processing Solutions Market Dynamics
2.3.1 Payment Processing Solutions Industry Trends
2.3.2 Payment Processing Solutions Market Drivers
2.3.3 Payment Processing Solutions Market Challenges
2.3.4 Payment Processing Solutions Market Restraints
3 Competition Landscape by Key Players
3.1 Global Revenue Payment Processing Solutions by Players
3.1.1 Global Payment Processing Solutions Revenue by Players (2019-2024)
3.1.2 Global Payment Processing Solutions Revenue Market Share by Players (2019-2024)
3.2 Global Payment Processing Solutions Market Share by Company Type (Tier 1, Tier 2, and Tier 3)
3.3 Global Key Players of Payment Processing Solutions, Ranking by Revenue, 2022 VS 2023 VS 2024
3.4 Global Payment Processing Solutions Market Concentration Ratio
3.4.1 Global Payment Processing Solutions Market Concentration Ratio (CR5 and HHI)
3.4.2 Global Top 10 and Top 5 Companies by Payment Processing Solutions Revenue in 2023
3.5 Global Key Players of Payment Processing Solutions Head office and Area Served
3.6 Global Key Players of Payment Processing Solutions, Product and Application
3.7 Global Key Players of Payment Processing Solutions, Date of Enter into This Industry
3.8 Mergers & Acquisitions, Expansion Plans
4 Payment Processing Solutions Breakdown Data by Type
4.1 Global Payment Processing Solutions Historic Market Size by Type (2019-2024)
4.2 Global Payment Processing Solutions Forecasted Market Size by Type (2025-2030)
5 Payment Processing Solutions Breakdown Data by Application
5.1 Global Payment Processing Solutions Historic Market Size by Application (2019-2024)
5.2 Global Payment Processing Solutions Forecasted Market Size by Application (2025-2030)
6 North America
6.1 North America Payment Processing Solutions Market Size (2019-2030)
6.2 North America Payment Processing Solutions Market Size by Type
6.2.1 North America Payment Processing Solutions Market Size by Type (2019-2024)
6.2.2 North America Payment Processing Solutions Market Size by Type (2025-2030)
6.2.3 North America Payment Processing Solutions Market Share by Type (2019-2030)
6.3 North America Payment Processing Solutions Market Size by Application
6.3.1 North America Payment Processing Solutions Market Size by Application (2019-2024)
6.3.2 North America Payment Processing Solutions Market Size by Application (2025-2030)
6.3.3 North America Payment Processing Solutions Market Share by Application (2019-2030)
6.4 North America Payment Processing Solutions Market Size by Country
6.4.1 North America Payment Processing Solutions Market Size by Country: 2019 VS 2023 VS 2030
6.4.2 North America Payment Processing Solutions Market Size by Country (2019-2024)
6.4.3 North America Payment Processing Solutions Market Size by Country (2025-2030)
6.4.4 U.S.
6.4.5 Canada
7 Europe
7.1 Europe Payment Processing Solutions Market Size (2019-2030)
7.2 Europe Payment Processing Solutions Market Size by Type
7.2.1 Europe Payment Processing Solutions Market Size by Type (2019-2024)
7.2.2 Europe Payment Processing Solutions Market Size by Type (2025-2030)
7.2.3 Europe Payment Processing Solutions Market Share by Type (2019-2030)
7.3 Europe Payment Processing Solutions Market Size by Application
7.3.1 Europe Payment Processing Solutions Market Size by Application (2019-2024)
7.3.2 Europe Payment Processing Solutions Market Size by Application (2025-2030)
7.3.3 Europe Payment Processing Solutions Market Share by Application (2019-2030)
7.4 Europe Payment Processing Solutions Market Size by Country
7.4.1 Europe Payment Processing Solutions Market Size by Country: 2019 VS 2023 VS 2030
7.4.2 Europe Payment Processing Solutions Market Size by Country (2019-2024)
7.4.3 Europe Payment Processing Solutions Market Size by Country (2025-2030)
7.4.3 Germany
7.4.4 France
7.4.5 U.K.
7.4.6 Italy
7.4.7 Russia
7.4.8 Nordic Countries
8 China
8.1 China Payment Processing Solutions Market Size (2019-2030)
8.2 China Payment Processing Solutions Market Size by Type
8.2.1 China Payment Processing Solutions Market Size by Type (2019-2024)
8.2.2 China Payment Processing Solutions Market Size by Type (2025-2030)
8.2.3 China Payment Processing Solutions Market Share by Type (2019-2030)
8.3 China Payment Processing Solutions Market Size by Application
8.3.1 China Payment Processing Solutions Market Size by Application (2019-2024)
8.3.2 China Payment Processing Solutions Market Size by Application (2025-2030)
8.3.3 China Payment Processing Solutions Market Share by Application (2019-2030)
9 Asia (excluding China)
9.1 Asia Payment Processing Solutions Market Size (2019-2030)
9.2 Asia Payment Processing Solutions Market Size by Type
9.2.1 Asia Payment Processing Solutions Market Size by Type (2019-2024)
9.2.2 Asia Payment Processing Solutions Market Size by Type (2025-2030)
9.2.3 Asia Payment Processing Solutions Market Share by Type (2019-2030)
9.3 Asia Payment Processing Solutions Market Size by Application
9.3.1 Asia Payment Processing Solutions Market Size by Application (2019-2024)
9.3.2 Asia Payment Processing Solutions Market Size by Application (2025-2030)
9.3.3 Asia Payment Processing Solutions Market Share by Application (2019-2030)
9.4 Asia Payment Processing Solutions Market Size by Region
9.4.1 Asia Payment Processing Solutions Market Size by Region: 2019 VS 2023 VS 2030
9.4.2 Asia Payment Processing Solutions Market Size by Region (2019-2024)
9.4.3 Asia Payment Processing Solutions Market Size by Region (2025-2030)
9.4.4 Japan
9.4.5 South Korea
9.4.6 China Taiwan
9.4.7 Southeast Asia
9.4.8 India
9.4.9 Australia
10 Middle East, Africa, and Latin America
10.1 Middle East, Africa, and Latin America Payment Processing Solutions Market Size (2019-2030)
10.2 Middle East, Africa, and Latin America Payment Processing Solutions Market Size by Type
10.2.1 Middle East, Africa, and Latin America Payment Processing Solutions Market Size by Type (2019-2024)
10.2.2 Middle East, Africa, and Latin America Payment Processing Solutions Market Size by Type (2025-2030)
10.2.3 Middle East, Africa, and Latin America Payment Processing Solutions Market Share by Type (2019-2030)
10.3 Middle East, Africa, and Latin America Payment Processing Solutions Market Size by Application
10.3.1 Middle East, Africa, and Latin America Payment Processing Solutions Market Size by Application (2019-2024)
10.3.2 Middle East, Africa, and Latin America Payment Processing Solutions Market Size by Application (2025-2030)
10.3.3 Middle East, Africa, and Latin America Payment Processing Solutions Market Share by Application (2019-2030)
10.4 Middle East, Africa, and Latin America Payment Processing Solutions Market Size by Country
10.4.1 Middle East, Africa, and Latin America Payment Processing Solutions Market Size by Country: 2019 VS 2023 VS 2030
10.4.2 Middle East, Africa, and Latin America Payment Processing Solutions Market Size by Country (2019-2024)
10.4.3 Middle East, Africa, and Latin America Payment Processing Solutions Market Size by Country (2025-2030)
10.4.4 Brazil
10.4.5 Mexico
10.4.6 Turkey
10.4.7 Saudi Arabia
10.4.8 Israel
10.4.9 GCC Countries
11 Key Players Profiles
11.1 Wirecard AG
11.1.1 Wirecard AG Company Details
11.1.2 Wirecard AG Business Overview
11.1.3 Wirecard AG Payment Processing Solutions Introduction
11.1.4 Wirecard AG Revenue in Payment Processing Solutions Business (2019-2024)
11.1.5 Wirecard AG Recent Developments
11.2 Naspers Limited
11.2.1 Naspers Limited Company Details
11.2.2 Naspers Limited Business Overview
11.2.3 Naspers Limited Payment Processing Solutions Introduction
11.2.4 Naspers Limited Revenue in Payment Processing Solutions Business (2019-2024)
11.2.5 Naspers Limited Recent Developments
11.3 Visa Inc.
11.3.1 Visa Inc. Company Details
11.3.2 Visa Inc. Business Overview
11.3.3 Visa Inc. Payment Processing Solutions Introduction
11.3.4 Visa Inc. Revenue in Payment Processing Solutions Business (2019-2024)
11.3.5 Visa Inc. Recent Developments
11.4 Jack Henry & Associates Inc.
11.4.1 Jack Henry & Associates Inc. Company Details
11.4.2 Jack Henry & Associates Inc. Business Overview
11.4.3 Jack Henry & Associates Inc. Payment Processing Solutions Introduction
11.4.4 Jack Henry & Associates Inc. Revenue in Payment Processing Solutions Business (2019-2024)
11.4.5 Jack Henry & Associates Inc. Recent Developments
11.5 PayPal Holdings, Inc.
11.5.1 PayPal Holdings, Inc. Company Details
11.5.2 PayPal Holdings, Inc. Business Overview
11.5.3 PayPal Holdings, Inc. Payment Processing Solutions Introduction
11.5.4 PayPal Holdings, Inc. Revenue in Payment Processing Solutions Business (2019-2024)
11.5.5 PayPal Holdings, Inc. Recent Developments
11.6 Global Payments Inc.
11.6.1 Global Payments Inc. Company Details
11.6.2 Global Payments Inc. Business Overview
11.6.3 Global Payments Inc. Payment Processing Solutions Introduction
11.6.4 Global Payments Inc. Revenue in Payment Processing Solutions Business (2019-2024)
11.6.5 Global Payments Inc. Recent Developments
11.7 First Data Corporation
11.7.1 First Data Corporation Company Details
11.7.2 First Data Corporation Business Overview
11.7.3 First Data Corporation Payment Processing Solutions Introduction
11.7.4 First Data Corporation Revenue in Payment Processing Solutions Business (2019-2024)
11.7.5 First Data Corporation Recent Developments
11.8 Square Inc.
11.8.1 Square Inc. Company Details
11.8.2 Square Inc. Business Overview
11.8.3 Square Inc. Payment Processing Solutions Introduction
11.8.4 Square Inc. Revenue in Payment Processing Solutions Business (2019-2024)
11.8.5 Square Inc. Recent Developments
11.9 Adyen N.V.
11.9.1 Adyen N.V. Company Details
11.9.2 Adyen N.V. Business Overview
11.9.3 Adyen N.V. Payment Processing Solutions Introduction
11.9.4 Adyen N.V. Revenue in Payment Processing Solutions Business (2019-2024)
11.9.5 Adyen N.V. Recent Developments
11.10 Paysafe Group Limited.
11.10.1 Paysafe Group Limited. Company Details
11.10.2 Paysafe Group Limited. Business Overview
11.10.3 Paysafe Group Limited. Payment Processing Solutions Introduction
11.10.4 Paysafe Group Limited. Revenue in Payment Processing Solutions Business (2019-2024)
11.10.5 Paysafe Group Limited. Recent Developments
12 Analyst's Viewpoints/Conclusions
13 Appendix
13.1 Research Methodology
13.1.1 Methodology/Research Approach
13.1.2 Data Source
13.2 Disclaimer
13.3 Author Details
List of Tables
Table 1. Global Payment Processing Solutions Market Size Growth Rate by Type (US$ Million), 2019 VS 2023 VS 2030
Table 2. Key Players of Credit Card
Table 3. Key Players of Debit Card
Table 4. Key Players of Ewallet
Table 5. Global Payment Processing Solutions Market Size Growth Rate by Application (US$ Million), 2019 VS 2023 VS 2030
Table 6. Global Payment Processing Solutions Market Size Growth Rate (CAGR) by Region (US$ Million): 2019 VS 2023 VS 2030
Table 7. Global Payment Processing Solutions Market Size by Region (2019-2024) & (US$ Million)
Table 8. Global Payment Processing Solutions Market Share by Region (2019-2024)
Table 9. Global Payment Processing Solutions Forecasted Market Size by Region (2025-2030) & (US$ Million)
Table 10. Global Payment Processing Solutions Market Share by Region (2025-2030)
Table 11. Payment Processing Solutions Market Trends
Table 12. Payment Processing Solutions Market Drivers
Table 13. Payment Processing Solutions Market Challenges
Table 14. Payment Processing Solutions Market Restraints
Table 15. Global Payment Processing Solutions Revenue by Players (2019-2024) & (US$ Million)
Table 16. Global Payment Processing Solutions Revenue Share by Players (2019-2024)
Table 17. Global Top Payment Processing Solutions by Company Type (Tier 1, Tier 2, and Tier 3) & (based on the Revenue in Payment Processing Solutions as of 2023)
Table 18. Global Payment Processing Solutions Industry Ranking 2022 VS 2023 VS 2024
Table 19. Global 5 Largest Players Market Share by Payment Processing Solutions Revenue (CR5 and HHI) & (2019-2024)
Table 20. Global Key Players of Payment Processing Solutions, Headquarters and Area Served
Table 21. Global Key Players of Payment Processing Solutions, Product and Application
Table 22. Global Key Players of Payment Processing Solutions, Product and Application
Table 23. Mergers & Acquisitions, Expansion Plans
Table 24. Global Payment Processing Solutions Market Size by Type (2019-2024) & (US$ Million)
Table 25. Global Payment Processing Solutions Revenue Market Share by Type (2019-2024)
Table 26. Global Payment Processing Solutions Forecasted Market Size by Type (2025-2030) & (US$ Million)
Table 27. Global Payment Processing Solutions Revenue Market Share by Type (2025-2030)
Table 28. Global Payment Processing Solutions Market Size by Application (2019-2024) & (US$ Million)
Table 29. Global Payment Processing Solutions Revenue Share by Application (2019-2024)
Table 30. Global Payment Processing Solutions Forecasted Market Size by Application (2025-2030) & (US$ Million)
Table 31. Global Payment Processing Solutions Revenue Share by Application (2025-2030)
Table 32. North America Payment Processing Solutions Market Size by Type (2019-2024) & (US$ Million)
Table 33. North America Payment Processing Solutions Market Size by Type (2025-2030) & (US$ Million)
Table 34. North America Payment Processing Solutions Market Size by Application (2019-2024) & (US$ Million)
Table 35. North America Payment Processing Solutions Market Size by Application (2025-2030) & (US$ Million)
Table 36. North America Payment Processing Solutions Growth Rate (CAGR) by Country (US$ Million): 2019 VS 2023 VS 2030
Table 37. North America Payment Processing Solutions Market Size by Country (2019-2024) & (US$ Million)
Table 38. North America Payment Processing Solutions Market Size by Country (2025-2030) & (US$ Million)
Table 39. Europe Payment Processing Solutions Market Size by Type (2019-2024) & (US$ Million)
Table 40. Europe Payment Processing Solutions Market Size by Type (2025-2030) & (US$ Million)
Table 41. Europe Payment Processing Solutions Market Size by Application (2019-2024) & (US$ Million)
Table 42. Europe Payment Processing Solutions Market Size by Application (2025-2030) & (US$ Million)
Table 43. Europe Payment Processing Solutions Growth Rate (CAGR) by Country (US$ Million): 2019 VS 2023 VS 2030
Table 44. Europe Payment Processing Solutions Market Size by Country (2019-2024) & (US$ Million)
Table 45. Europe Payment Processing Solutions Market Size by Country (2025-2030) & (US$ Million)
Table 46. China Payment Processing Solutions Market Size by Type (2019-2024) & (US$ Million)
Table 47. China Payment Processing Solutions Market Size by Type (2025-2030) & (US$ Million)
Table 48. China Payment Processing Solutions Market Size by Application (2019-2024) & (US$ Million)
Table 49. China Payment Processing Solutions Market Size by Application (2025-2030) & (US$ Million)
Table 50. Asia Payment Processing Solutions Market Size by Type (2019-2024) & (US$ Million)
Table 51. Asia Payment Processing Solutions Market Size by Type (2025-2030) & (US$ Million)
Table 52. Asia Payment Processing Solutions Market Size by Application (2019-2024) & (US$ Million)
Table 53. Asia Payment Processing Solutions Market Size by Application (2025-2030) & (US$ Million)
Table 54. Asia Payment Processing Solutions Growth Rate (CAGR) by Region (US$ Million): 2019 VS 2023 VS 2030
Table 55. Asia Payment Processing Solutions Market Size by Region (2019-2024) & (US$ Million)
Table 56. Asia Payment Processing Solutions Market Size by Region (2025-2030) & (US$ Million)
Table 57. Middle East, Africa, and Latin America Payment Processing Solutions Market Size by Type (2019-2024) & (US$ Million)
Table 58. Middle East, Africa, and Latin America Payment Processing Solutions Market Size by Type (2025-2030) & (US$ Million)
Table 59. Middle East, Africa, and Latin America Payment Processing Solutions Market Size by Application (2019-2024) & (US$ Million)
Table 60. Middle East, Africa, and Latin America Payment Processing Solutions Market Size by Application (2025-2030) & (US$ Million)
Table 61. Middle East, Africa, and Latin America Payment Processing Solutions Growth Rate (CAGR) by Country (US$ Million): 2019 VS 2023 VS 2030
Table 62. Middle East, Africa, and Latin America Payment Processing Solutions Market Size by Country (2019-2024) & (US$ Million)
Table 63. Middle East, Africa, and Latin America Payment Processing Solutions Market Size by Country (2025-2030) & (US$ Million)
Table 64. Wirecard AG Company Details
Table 65. Wirecard AG Business Overview
Table 66. Wirecard AG Payment Processing Solutions Product
Table 67. Wirecard AG Revenue in Payment Processing Solutions Business (2019-2024) & (US$ Million)
Table 68. Wirecard AG Recent Developments
Table 69. Naspers Limited Company Details
Table 70. Naspers Limited Business Overview
Table 71. Naspers Limited Payment Processing Solutions Product
Table 72. Naspers Limited Revenue in Payment Processing Solutions Business (2019-2024) & (US$ Million)
Table 73. Naspers Limited Recent Developments
Table 74. Visa Inc. Company Details
Table 75. Visa Inc. Business Overview
Table 76. Visa Inc. Payment Processing Solutions Product
Table 77. Visa Inc. Revenue in Payment Processing Solutions Business (2019-2024) & (US$ Million)
Table 78. Visa Inc. Recent Developments
Table 79. Jack Henry & Associates Inc. Company Details
Table 80. Jack Henry & Associates Inc. Business Overview
Table 81. Jack Henry & Associates Inc. Payment Processing Solutions Product
Table 82. Jack Henry & Associates Inc. Revenue in Payment Processing Solutions Business (2019-2024) & (US$ Million)
Table 83. Jack Henry & Associates Inc. Recent Developments
Table 84. PayPal Holdings, Inc. Company Details
Table 85. PayPal Holdings, Inc. Business Overview
Table 86. PayPal Holdings, Inc. Payment Processing Solutions Product
Table 87. PayPal Holdings, Inc. Revenue in Payment Processing Solutions Business (2019-2024) & (US$ Million)
Table 88. PayPal Holdings, Inc. Recent Developments
Table 89. Global Payments Inc. Company Details
Table 90. Global Payments Inc. Business Overview
Table 91. Global Payments Inc. Payment Processing Solutions Product
Table 92. Global Payments Inc. Revenue in Payment Processing Solutions Business (2019-2024) & (US$ Million)
Table 93. Global Payments Inc. Recent Developments
Table 94. First Data Corporation Company Details
Table 95. First Data Corporation Business Overview
Table 96. First Data Corporation Payment Processing Solutions Product
Table 97. First Data Corporation Revenue in Payment Processing Solutions Business (2019-2024) & (US$ Million)
Table 98. First Data Corporation Recent Developments
Table 99. Square Inc. Company Details
Table 100. Square Inc. Business Overview
Table 101. Square Inc. Payment Processing Solutions Product
Table 102. Square Inc. Revenue in Payment Processing Solutions Business (2019-2024) & (US$ Million)
Table 103. Square Inc. Recent Developments
Table 104. Adyen N.V. Company Details
Table 105. Adyen N.V. Business Overview
Table 106. Adyen N.V. Payment Processing Solutions Product
Table 107. Adyen N.V. Revenue in Payment Processing Solutions Business (2019-2024) & (US$ Million)
Table 108. Adyen N.V. Recent Developments
Table 109. Paysafe Group Limited. Company Details
Table 110. Paysafe Group Limited. Business Overview
Table 111. Paysafe Group Limited. Payment Processing Solutions Product
Table 112. Paysafe Group Limited. Revenue in Payment Processing Solutions Business (2019-2024) & (US$ Million)
Table 113. Paysafe Group Limited. Recent Developments
Table 114. Research Programs/Design for This Report
Table 115. Key Data Information from Secondary Sources
Table 116. Key Data Information from Primary Sources
List of Figures
Figure 1. Global Payment Processing Solutions Market Size Growth Rate by Type, 2019 VS 2023 VS 2030 (US$ Million)
Figure 2. Global Payment Processing Solutions Market Share by Type: 2023 VS 2030
Figure 3. Credit Card Features
Figure 4. Debit Card Features
Figure 5. Ewallet Features
Figure 6. Global Payment Processing Solutions Market Size Growth Rate by Application, 2019 VS 2023 VS 2030 (US$ Million)
Figure 7. Global Payment Processing Solutions Market Share by Application: 2023 VS 2030
Figure 8. Hospitality Case Studies
Figure 9. Retail Case Studies
Figure 10. Utilities and Telecommunication Case Studies
Figure 11. Others Case Studies
Figure 12. Payment Processing Solutions Report Years Considered
Figure 13. Global Payment Processing Solutions Market Size (US$ Million), Year-over-Year: 2019-2030
Figure 14. Global Payment Processing Solutions Market Size, (US$ Million), 2019 VS 2023 VS 2030
Figure 15. Global Payment Processing Solutions Market Share by Region: 2023 VS 2030
Figure 16. Global Payment Processing Solutions Market Share by Players in 2023
Figure 17. Global Top Payment Processing Solutions Players by Company Type (Tier 1, Tier 2, and Tier 3) & (based on the Revenue in Payment Processing Solutions as of 2023)
Figure 18. The Top 10 and 5 Players Market Share by Payment Processing Solutions Revenue in 2023
Figure 19. North America Payment Processing Solutions Market Size YoY Growth (2019-2030) & (US$ Million)
Figure 20. North America Payment Processing Solutions Market Share by Type (2019-2030)
Figure 21. North America Payment Processing Solutions Market Share by Application (2019-2030)
Figure 22. North America Payment Processing Solutions Market Share by Country (2019-2030)
Figure 23. United States Payment Processing Solutions Market Size YoY Growth (2019-2030) & (US$ Million)
Figure 24. Canada Payment Processing Solutions Market Size YoY Growth (2019-2030) & (US$ Million)
Figure 25. Europe Payment Processing Solutions Market Size YoY (2019-2030) & (US$ Million)
Figure 26. Europe Payment Processing Solutions Market Share by Type (2019-2030)
Figure 27. Europe Payment Processing Solutions Market Share by Application (2019-2030)
Figure 28. Europe Payment Processing Solutions Market Share by Country (2019-2030)
Figure 29. Germany Payment Processing Solutions Market Size YoY Growth (2019-2030) & (US$ Million)
Figure 30. France Payment Processing Solutions Market Size YoY Growth (2019-2030) & (US$ Million)
Figure 31. U.K. Payment Processing Solutions Market Size YoY Growth (2019-2030) & (US$ Million)
Figure 32. Italy Payment Processing Solutions Market Size YoY Growth (2019-2030) & (US$ Million)
Figure 33. Russia Payment Processing Solutions Market Size YoY Growth (2019-2030) & (US$ Million)
Figure 34. Nordic Countries Payment Processing Solutions Market Size YoY Growth (2019-2030) & (US$ Million)
Figure 35. China Payment Processing Solutions Market Size YoY (2019-2030) & (US$ Million)
Figure 36. China Payment Processing Solutions Market Share by Type (2019-2030)
Figure 37. China Payment Processing Solutions Market Share by Application (2019-2030)
Figure 38. Asia Payment Processing Solutions Market Size YoY (2019-2030) & (US$ Million)
Figure 39. Asia Payment Processing Solutions Market Share by Type (2019-2030)
Figure 40. Asia Payment Processing Solutions Market Share by Application (2019-2030)
Figure 41. Asia Payment Processing Solutions Market Share by Region (2019-2030)
Figure 42. Japan Payment Processing Solutions Market Size YoY Growth (2019-2030) & (US$ Million)
Figure 43. South Korea Payment Processing Solutions Market Size YoY Growth (2019-2030) & (US$ Million)
Figure 44. China Taiwan Payment Processing Solutions Market Size YoY Growth (2019-2030) & (US$ Million)
Figure 45. Southeast Asia Payment Processing Solutions Market Size YoY Growth (2019-2030) & (US$ Million)
Figure 46. India Payment Processing Solutions Market Size YoY Growth (2019-2030) & (US$ Million)
Figure 47. Australia Payment Processing Solutions Market Size YoY Growth (2019-2030) & (US$ Million)
Figure 48. Middle East, Africa, and Latin America Payment Processing Solutions Market Size YoY (2019-2030) & (US$ Million)
Figure 49. Middle East, Africa, and Latin America Payment Processing Solutions Market Share by Type (2019-2030)
Figure 50. Middle East, Africa, and Latin America Payment Processing Solutions Market Share by Application (2019-2030)
Figure 51. Middle East, Africa, and Latin America Payment Processing Solutions Market Share by Country (2019-2030)
Figure 52. Brazil Payment Processing Solutions Market Size YoY Growth (2019-2030) & (US$ Million)
Figure 53. Mexico Payment Processing Solutions Market Size YoY Growth (2019-2030) & (US$ Million)
Figure 54. Turkey Payment Processing Solutions Market Size YoY Growth (2019-2030) & (US$ Million)
Figure 55. Saudi Arabia Payment Processing Solutions Market Size YoY Growth (2019-2030) & (US$ Million)
Figure 56. Israel Payment Processing Solutions Market Size YoY Growth (2019-2030) & (US$ Million)
Figure 57. GCC Countries Payment Processing Solutions Market Size YoY Growth (2019-2030) & (US$ Million)
Figure 58. Wirecard AG Revenue Growth Rate in Payment Processing Solutions Business (2019-2024)
Figure 59. Naspers Limited Revenue Growth Rate in Payment Processing Solutions Business (2019-2024)
Figure 60. Visa Inc. Revenue Growth Rate in Payment Processing Solutions Business (2019-2024)
Figure 61. Jack Henry & Associates Inc. Revenue Growth Rate in Payment Processing Solutions Business (2019-2024)
Figure 62. PayPal Holdings, Inc. Revenue Growth Rate in Payment Processing Solutions Business (2019-2024)
Figure 63. Global Payments Inc. Revenue Growth Rate in Payment Processing Solutions Business (2019-2024)
Figure 64. First Data Corporation Revenue Growth Rate in Payment Processing Solutions Business (2019-2024)
Figure 65. Square Inc. Revenue Growth Rate in Payment Processing Solutions Business (2019-2024)
Figure 66. Adyen N.V. Revenue Growth Rate in Payment Processing Solutions Business (2019-2024)
Figure 67. Paysafe Group Limited. Revenue Growth Rate in Payment Processing Solutions Business (2019-2024)
Figure 68. Bottom-up and Top-down Approaches for This Report
Figure 69. Data Triangulation
Figure 70. Key Executives Interviewed

