0
U.S. (TOLL FREE)
+1 (315) 215-3225
Automative

0
U.S. (TOLL FREE)
+1 (315) 215-3225
Tokenization - Global Market Share and Ranking, Overall Sales and Demand Forecast 2024-2030
Published Date: January 2021
|
Report Code: QYRE-Auto-26Y3935
Home | Market Reports | Computers & Electronics| Software
Global Tokenization Market Size Status and Forecast 2021 2027
BUY CHAPTERS

Tokenization - Global Market Share and Ranking, Overall Sales and Demand Forecast 2024-2030

Code: QYRE-Auto-26Y3935
Report
January 2021
Pages:113
QYResearch
Buy Now with 15% Discount
DESCRIPTION
TABLE OF CONTENT
TABLES & FIGURES

Tokenization Market Report

Tokenization market is projected to reach US$ 2709.9 million in 2029, increasing from US$ 1140.7 million in 2022, with the CAGR of 13.0% during the period of 2023 to 2029. Key drivers of the market include the increasing need to stay compliant with regulations, ensuring seamless customer experience, and rising concerns regarding cyberattacks, frauds, and data breaches. Tokenization is the process of turning a meaningful piece of data into a random string of characters called tokens. The data can be an account number or a payment card number etc. Tokens are used as a reference for storing the original sensitive data but cannot be used to guess the sensitive information as it is not based on a mathematical process. 
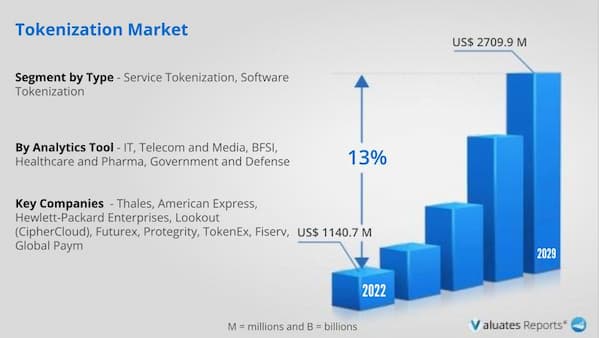
Tokenization Market Report

As online payments increase and more people shift towards contactless payment, financial crimes are rising leading to an increase in demand for the tokenization market across the globe. Moreover, Covid-19 has accelerated the growth of the market as more people are now aligning themselves with cloud-based tokenization solutions and services in order to protect their sensitive data against fraud and data breaches.

Tokenization Market Trends 

Rising concerns of cyberattacks and financial frauds are fuelling the market growth

People and businesses are now moving towards contactless payments. As more payments are made online, there is a growing risk of fraud and cyberattacks which compromise the status of people’s personal information in the virtual world. This has led to an increase in demand for cloud-based tokenization solutions and services for data security leading to an increase in the growth of the tokenization market globally.

The tokenization market will further fuel the growth of the market in the coming years

The tokenization market size is going to grow further as the demand for the asset tokenization market rises. Asset tokenization is the process of issuing a token within a blockchain. This token includes anything which has an exchange value such as gold, oil, cattle, etc. Blockchain technology provides immense benefits with respect to fraud prevention and cost-efficiency ratio. Though the asset tokenization market size is still in the early stages, there are still lucrative opportunities for the growth of the tokenization market during the forecast period.

Real estate investments hold potential for providing lucrative opportunities for the growth of the market

Tokenization and the token market provide exciting possibilities for the growth of real estate investments. Tokenization with respect to real estate involves fractional ownership interest of real estate assets with a blockchain technology-based token. Although the real estate sector is in its early stages still it will create lucrative opportunities for the growth of the tokenization market during the forecast period.

The presence of key tokenization companies will further propel the growth of the market

The presence of various tokenization companies with asset tokenization platforms will further propel the growth of the tokenization market during the forecast period. Companies such as Hp Enterprises, CipherCloud, FutureX, Visa, etc are the key market players in the tokenization sector. Microsoft is also offering blockchain as a service through the tokenization framework for entry to blockchain technology for many enterprises. The presence of key players in the sector will increase the demand for the tokenization market across the globe. 

Tokenization Market Share Analysis

Based on region, North America is expected to hold the largest tokenization market share due to various factors such as an increase in eCommerce payments, online gaming, shopping, a fully regulated market, a rise in online streaming, more usage of smartphones, and increasing cyberattack cases. North America is the largest market, with a share about 58%, followed by Europe and Asia-Pacific with the share about 23% and 12%.

Based on application the BFSI sector is expected to hold the largest tokenization market share during the forecast period as BFSI is the prime target for cybercriminals as the sector deals with money. Thus BFSI companies are always on the lookout for more advanced payment security solutions and services for protecting their employees, clients, assets, office, branches, and operations, etc.

Based on type the services and solution segment is expected to hold the largest tokenization market share as small and medium enterprises increase their adoption of tokenization as a service for saving their time, money, and resources. 

Global tokenization includes Thales, American Express, Visa (CyberSource), etc. Global top 5 companies hold a share about 40%. 

Global Tokenization Market Scope

Report Metric Details
Report Name Global Tokenization Market
Base Year 2022
Forecasted years 2023-2029
By Company
  • Thales
  • American Express
  • Hewlett-Packard Enterprises
  • Lookout (CipherCloud)
  • Futurex
  • Protegrity
  • TokenEx
  • Fiserv
  • Global Payments
  • Visa (CyberSource)
  • Others
Segment by Type
Segment by Application
  • BFSI
  • IT, Telecom and Media
  • Healthcare and Pharma
  • Government and Defense
  • Others
By Region
  • North America (United States, Canada)
  • Europe (Germany, France, UK, Italy, Russia) Rest of Europe
  • Nordic Countries
  • Asia-Pacific (China, Japan, South Korea)
  • Southeast Asia (India, Australia)
  • Rest of Asia
  • Latin America (Mexico, Brazil)
  • Rest of Latin America
  • Middle East & Africa (Turkey, Saudi Arabia, UAE, Rest of MEA)
Forecast units USD million in value
Report coverage Revenue and volume forecast, company share, competitive landscape, growth factors and trends


Frequently Asked Questions About This Report

1. How Big is the Tokenization Market?

Ans.  Tokenization market is projected to reach US$ 2709.9 million in 2029, increasing from US$ 1140.7 million in 2022, with the CAGR of 13.0% during the period of 2023 to 2029.

2. What is the Tokenization Market Growth?

Ans. The global Tokenization market is expected to grow at a compound annual growth rate of 13.0% from 2022 to 2028.

3. Who are the major key players of the Tokenization Market?

Ans. Global tokenization includes Thales, American Express, Visa (CyberSource), etc. Global top 5 companies hold a share about 40%.

4. Is chapterwise Report available for the Tokenization Market?

Ans. Yes, ChapterWise report available for the Tokenization market.


1 Market Overview
 
1.1 Tokenization Product Introduction
1.2 Global Tokenization Market Size Forecast
1.3 Tokenization Market Trends & Drivers
1.3.1 Tokenization Industry Trends
1.3.2 Tokenization Market Drivers & Opportunity
1.3.3 Tokenization Market Challenges
1.3.4 Tokenization Market Restraints
1.4 Assumptions and Limitations
1.5 Study Objectives
1.6 Years Considered
 
2 Competitive Analysis by Company
 
2.1 Global Tokenization Players Revenue Ranking (2023)
2.2 Global Tokenization Revenue by Company (2019-2024)
2.3 Key Companies Tokenization Manufacturing Base Distribution and Headquarters
2.4 Key Companies Tokenization Product Offered
2.5 Key Companies Time to Begin Mass Production of Tokenization
2.6 Tokenization Market Competitive Analysis
2.6.1 Tokenization Market Concentration Rate (2019-2024)
2.6.2 Global 5 and 10 Largest Companies by Tokenization Revenue in 2023
2.6.3 Global Top Companies by Company Type (Tier 1, Tier 2, and Tier 3) & (based on the Revenue in Tokenization as of 2023)
2.7 Mergers & Acquisitions, Expansion
 
3 Segmentation by Type
 
3.1 Introduction by Type
3.1.1 Service Tokenization
3.1.2 Software Tokenization
3.2 Global Tokenization Sales Value by Type
3.2.1 Global Tokenization Sales Value by Type (2019 VS 2023 VS 2030)
3.2.2 Global Tokenization Sales Value, by Type (2019-2030)
3.2.3 Global Tokenization Sales Value, by Type (%) (2019-2030)
 
4 Segmentation by Application
 
4.1 Introduction by Application
4.1.1 BFSI
4.1.2 IT, Telecom and Media
4.1.3 Healthcare and Pharma
4.1.4 Government and Defense
4.1.5 Others
4.2 Global Tokenization Sales Value by Application
4.2.1 Global Tokenization Sales Value by Application (2019 VS 2023 VS 2030)
4.2.2 Global Tokenization Sales Value, by Application (2019-2030)
4.2.3 Global Tokenization Sales Value, by Application (%) (2019-2030)
 
5 Segmentation by Region
 
5.1 Global Tokenization Sales Value by Region
5.1.1 Global Tokenization Sales Value by Region: 2019 VS 2023 VS 2030
5.1.2 Global Tokenization Sales Value by Region (2019-2024)
5.1.3 Global Tokenization Sales Value by Region (2025-2030)
5.1.4 Global Tokenization Sales Value by Region (%), (2019-2030)
5.2 North America
5.2.1 North America Tokenization Sales Value, 2019-2030
5.2.2 North America Tokenization Sales Value by Country (%), 2023 VS 2030
5.3 Europe
5.3.1 Europe Tokenization Sales Value, 2019-2030
5.3.2 Europe Tokenization Sales Value by Country (%), 2023 VS 2030
5.4 Asia Pacific
5.4.1 Asia Pacific Tokenization Sales Value, 2019-2030
5.4.2 Asia Pacific Tokenization Sales Value by Country (%), 2023 VS 2030
5.5 South America
5.5.1 South America Tokenization Sales Value, 2019-2030
5.5.2 South America Tokenization Sales Value by Country (%), 2023 VS 2030
5.6 Middle East & Africa
5.6.1 Middle East & Africa Tokenization Sales Value, 2019-2030
5.6.2 Middle East & Africa Tokenization Sales Value by Country (%), 2023 VS 2030
 
6 Segmentation by Key Countries/Regions
 
6.1 Key Countries/Regions Tokenization Sales Value Growth Trends, 2019 VS 2023 VS 2030
6.2 Key Countries/Regions Tokenization Sales Value
6.3 United States
6.3.1 United States Tokenization Sales Value, 2019-2030
6.3.2 United States Tokenization Sales Value by Type (%), 2023 VS 2030
6.3.3 United States Tokenization Sales Value by Application, 2023 VS 2030
6.4 Europe
6.4.1 Europe Tokenization Sales Value, 2019-2030
6.4.2 Europe Tokenization Sales Value by Type (%), 2023 VS 2030
6.4.3 Europe Tokenization Sales Value by Application, 2023 VS 2030
6.5 China
6.5.1 China Tokenization Sales Value, 2019-2030
6.5.2 China Tokenization Sales Value by Type (%), 2023 VS 2030
6.5.3 China Tokenization Sales Value by Application, 2023 VS 2030
6.6 Japan
6.6.1 Japan Tokenization Sales Value, 2019-2030
6.6.2 Japan Tokenization Sales Value by Type (%), 2023 VS 2030
6.6.3 Japan Tokenization Sales Value by Application, 2023 VS 2030
6.7 South Korea
6.7.1 South Korea Tokenization Sales Value, 2019-2030
6.7.2 South Korea Tokenization Sales Value by Type (%), 2023 VS 2030
6.7.3 South Korea Tokenization Sales Value by Application, 2023 VS 2030
6.8 Southeast Asia
6.8.1 Southeast Asia Tokenization Sales Value, 2019-2030
6.8.2 Southeast Asia Tokenization Sales Value by Type (%), 2023 VS 2030
6.8.3 Southeast Asia Tokenization Sales Value by Application, 2023 VS 2030
6.9 India
6.9.1 India Tokenization Sales Value, 2019-2030
6.9.2 India Tokenization Sales Value by Type (%), 2023 VS 2030
6.9.3 India Tokenization Sales Value by Application, 2023 VS 2030
 
7 Company Profiles
 
7.1 Thales
7.1.1 Thales Profile
7.1.2 Thales Main Business
7.1.3 Thales Tokenization Products, Services and Solutions
7.1.4 Thales Tokenization Revenue (US$ Million) & (2019-2024)
7.1.5 Thales Recent Developments
7.2 American Express
7.2.1 American Express Profile
7.2.2 American Express Main Business
7.2.3 American Express Tokenization Products, Services and Solutions
7.2.4 American Express Tokenization Revenue (US$ Million) & (2019-2024)
7.2.5 American Express Recent Developments
7.3 Hewlett-Packard Enterprises
7.3.1 Hewlett-Packard Enterprises Profile
7.3.2 Hewlett-Packard Enterprises Main Business
7.3.3 Hewlett-Packard Enterprises Tokenization Products, Services and Solutions
7.3.4 Hewlett-Packard Enterprises Tokenization Revenue (US$ Million) & (2019-2024)
7.3.5 Lookout (CipherCloud) Recent Developments
7.4 Lookout (CipherCloud)
7.4.1 Lookout (CipherCloud) Profile
7.4.2 Lookout (CipherCloud) Main Business
7.4.3 Lookout (CipherCloud) Tokenization Products, Services and Solutions
7.4.4 Lookout (CipherCloud) Tokenization Revenue (US$ Million) & (2019-2024)
7.4.5 Lookout (CipherCloud) Recent Developments
7.5 Futurex
7.5.1 Futurex Profile
7.5.2 Futurex Main Business
7.5.3 Futurex Tokenization Products, Services and Solutions
7.5.4 Futurex Tokenization Revenue (US$ Million) & (2019-2024)
7.5.5 Futurex Recent Developments
7.6 Protegrity
7.6.1 Protegrity Profile
7.6.2 Protegrity Main Business
7.6.3 Protegrity Tokenization Products, Services and Solutions
7.6.4 Protegrity Tokenization Revenue (US$ Million) & (2019-2024)
7.6.5 Protegrity Recent Developments
7.7 TokenEx
7.7.1 TokenEx Profile
7.7.2 TokenEx Main Business
7.7.3 TokenEx Tokenization Products, Services and Solutions
7.7.4 TokenEx Tokenization Revenue (US$ Million) & (2019-2024)
7.7.5 TokenEx Recent Developments
7.8 Fiserv
7.8.1 Fiserv Profile
7.8.2 Fiserv Main Business
7.8.3 Fiserv Tokenization Products, Services and Solutions
7.8.4 Fiserv Tokenization Revenue (US$ Million) & (2019-2024)
7.8.5 Fiserv Recent Developments
7.9 Global Payments
7.9.1 Global Payments Profile
7.9.2 Global Payments Main Business
7.9.3 Global Payments Tokenization Products, Services and Solutions
7.9.4 Global Payments Tokenization Revenue (US$ Million) & (2019-2024)
7.9.5 Global Payments Recent Developments
7.10 Visa (CyberSource)
7.10.1 Visa (CyberSource) Profile
7.10.2 Visa (CyberSource) Main Business
7.10.3 Visa (CyberSource) Tokenization Products, Services and Solutions
7.10.4 Visa (CyberSource) Tokenization Revenue (US$ Million) & (2019-2024)
7.10.5 Visa (CyberSource) Recent Developments
 
8 Industry Chain Analysis
 
8.1 Tokenization Industrial Chain
8.2 Tokenization Upstream Analysis
8.2.1 Key Raw Materials
8.2.2 Raw Materials Key Suppliers
8.2.3 Manufacturing Cost Structure
8.3 Midstream Analysis
8.4 Downstream Analysis (Customers Analysis)
8.5 Sales Model and Sales Channels
8.5.1 Tokenization Sales Model
8.5.2 Sales Channel
8.5.3 Tokenization Distributors
 
9 Research Findings and Conclusion
 
10 Appendix
 
10.1 Research Methodology
10.1.1 Methodology/Research Approach
10.1.2 Data Source
10.2 Author Details
10.3 Disclaimer
List of Tables
 
Table 1. Tokenization Market Trends
Table 2. Tokenization Market Drivers & Opportunity
Table 3. Tokenization Market Challenges
Table 4. Tokenization Market Restraints
Table 5. Global Tokenization Revenue by Company (2019-2024) & (US$ Million)
Table 6. Global Tokenization Revenue Market Share by Company (2019-2024)
Table 7. Key Companies Tokenization Manufacturing Base Distribution and Headquarters
Table 8. Key Companies Tokenization Product Type
Table 9. Key Companies Time to Begin Mass Production of Tokenization
Table 10. Global Tokenization Companies Market Concentration Ratio (CR5 and HHI)
Table 11. Global Top Companies Market Share by Company Type (Tier 1, Tier 2, and Tier 3) & (based on the Revenue in Tokenization as of 2023)
Table 12. Mergers & Acquisitions, Expansion Plans
Table 13. Global Tokenization Sales Value by Type: 2019 VS 2023 VS 2030 (US$ Million)
Table 14. Global Tokenization Sales Value by Type (2019-2024) & (US$ Million)
Table 15. Global Tokenization Sales Value by Type (2025-2030) & (US$ Million)
Table 16. Global Tokenization Sales Market Share in Value by Type (2019-2024) & (%)
Table 17. Global Tokenization Sales Market Share in Value by Type (2025-2030) & (%)
Table 18. Global Tokenization Sales Value by Application: 2019 VS 2023 VS 2030 (US$ Million)
Table 19. Global Tokenization Sales Value by Application (2019-2024) & (US$ Million)
Table 20. Global Tokenization Sales Value by Application (2025-2030) & (US$ Million)
Table 21. Global Tokenization Sales Market Share in Value by Application (2019-2024) & (%)
Table 22. Global Tokenization Sales Market Share in Value by Application (2025-2030) & (%)
Table 23. Global Tokenization Sales Value by Region: 2019 VS 2023 VS 2030 (US$ Million)
Table 24. Global Tokenization Sales Value by Region (2019-2024) & (US$ Million)
Table 25. Global Tokenization Sales Value by Region (2025-2030) & (US$ Million)
Table 26. Global Tokenization Sales Value by Region (2019-2024) & (%)
Table 27. Global Tokenization Sales Value by Region (2025-2030) & (%)
Table 28. Key Countries/Regions Tokenization Sales Value Growth Trends, (US$ Million): 2019 VS 2023 VS 2030
Table 29. Key Countries/Regions Tokenization Sales Value, (2019-2024) & (US$ Million)
Table 30. Key Countries/Regions Tokenization Sales Value, (2025-2030) & (US$ Million)
Table 31. Thales Basic Information List
Table 32. Thales Description and Business Overview
Table 33. Thales Tokenization Products, Services and Solutions
Table 34. Revenue (US$ Million) in Tokenization Business of Thales (2019-2024)
Table 35. Thales Recent Developments
Table 36. American Express Basic Information List
Table 37. American Express Description and Business Overview
Table 38. American Express Tokenization Products, Services and Solutions
Table 39. Revenue (US$ Million) in Tokenization Business of American Express (2019-2024)
Table 40. American Express Recent Developments
Table 41. Hewlett-Packard Enterprises Basic Information List
Table 42. Hewlett-Packard Enterprises Description and Business Overview
Table 43. Hewlett-Packard Enterprises Tokenization Products, Services and Solutions
Table 44. Revenue (US$ Million) in Tokenization Business of Hewlett-Packard Enterprises (2019-2024)
Table 45. Hewlett-Packard Enterprises Recent Developments
Table 46. Lookout (CipherCloud) Basic Information List
Table 47. Lookout (CipherCloud) Description and Business Overview
Table 48. Lookout (CipherCloud) Tokenization Products, Services and Solutions
Table 49. Revenue (US$ Million) in Tokenization Business of Lookout (CipherCloud) (2019-2024)
Table 50. Lookout (CipherCloud) Recent Developments
Table 51. Futurex Basic Information List
Table 52. Futurex Description and Business Overview
Table 53. Futurex Tokenization Products, Services and Solutions
Table 54. Revenue (US$ Million) in Tokenization Business of Futurex (2019-2024)
Table 55. Futurex Recent Developments
Table 56. Protegrity Basic Information List
Table 57. Protegrity Description and Business Overview
Table 58. Protegrity Tokenization Products, Services and Solutions
Table 59. Revenue (US$ Million) in Tokenization Business of Protegrity (2019-2024)
Table 60. Protegrity Recent Developments
Table 61. TokenEx Basic Information List
Table 62. TokenEx Description and Business Overview
Table 63. TokenEx Tokenization Products, Services and Solutions
Table 64. Revenue (US$ Million) in Tokenization Business of TokenEx (2019-2024)
Table 65. TokenEx Recent Developments
Table 66. Fiserv Basic Information List
Table 67. Fiserv Description and Business Overview
Table 68. Fiserv Tokenization Products, Services and Solutions
Table 69. Revenue (US$ Million) in Tokenization Business of Fiserv (2019-2024)
Table 70. Fiserv Recent Developments
Table 71. Global Payments Basic Information List
Table 72. Global Payments Description and Business Overview
Table 73. Global Payments Tokenization Products, Services and Solutions
Table 74. Revenue (US$ Million) in Tokenization Business of Global Payments (2019-2024)
Table 75. Global Payments Recent Developments
Table 76. Visa (CyberSource) Basic Information List
Table 77. Visa (CyberSource) Description and Business Overview
Table 78. Visa (CyberSource) Tokenization Products, Services and Solutions
Table 79. Revenue (US$ Million) in Tokenization Business of Visa (CyberSource) (2019-2024)
Table 80. Visa (CyberSource) Recent Developments
Table 81. Key Raw Materials Lists
Table 82. Raw Materials Key Suppliers Lists
Table 83. Tokenization Downstream Customers
Table 84. Tokenization Distributors List
Table 85. Research Programs/Design for This Report
Table 86. Key Data Information from Secondary Sources
Table 87. Key Data Information from Primary Sources
Table 88. Business Unit and Senior & Team Lead Analysts
 
List of Figures
 
Figure 1. Tokenization Product Picture
Figure 2. Global Tokenization Sales Value, 2019 VS 2023 VS 2030 (US$ Million)
Figure 3. Global Tokenization Sales Value (2019-2030) & (US$ Million)
Figure 4. Tokenization Report Years Considered
Figure 5. Global Tokenization Players Revenue Ranking (2023) & (US$ Million)
Figure 6. The 5 and 10 Largest Manufacturers in the World: Market Share by Tokenization Revenue in 2023
Figure 7. Tokenization Market Share by Company Type (Tier 1, Tier 2, and Tier 3): 2019 VS 2023
Figure 8. Service Tokenization Picture
Figure 9. Software Tokenization Picture
Figure 10. Global Tokenization Sales Value by Type (2019 VS 2023 VS 2030) & (US$ Million)
Figure 11. Global Tokenization Sales Value Market Share by Type, 2023 & 2030
Figure 12. Product Picture of BFSI
Figure 13. Product Picture of IT, Telecom and Media
Figure 14. Product Picture of Healthcare and Pharma
Figure 15. Product Picture of Government and Defense
Figure 16. Product Picture of Others
Figure 17. Global Tokenization Sales Value by Application (2019 VS 2023 VS 2030) & (US$ Million)
Figure 18. Global Tokenization Sales Value Market Share by Application, 2023 & 2030
Figure 19. North America Tokenization Sales Value (2019-2030) & (US$ Million)
Figure 20. North America Tokenization Sales Value by Country (%), 2023 VS 2030
Figure 21. Europe Tokenization Sales Value (2019-2030) & (US$ Million)
Figure 22. Europe Tokenization Sales Value by Country (%), 2023 VS 2030
Figure 23. Asia Pacific Tokenization Sales Value (2019-2030) & (US$ Million)
Figure 24. Asia Pacific Tokenization Sales Value by Country (%), 2023 VS 2030
Figure 25. South America Tokenization Sales Value (2019-2030) & (US$ Million)
Figure 26. South America Tokenization Sales Value by Country (%), 2023 VS 2030
Figure 27. Middle East & Africa Tokenization Sales Value (2019-2030) & (US$ Million)
Figure 28. Middle East & Africa Tokenization Sales Value by Country (%), 2023 VS 2030
Figure 29. Key Countries/Regions Tokenization Sales Value (%), (2019-2030)
Figure 30. United States Tokenization Sales Value, (2019-2030) & (US$ Million)
Figure 31. United States Tokenization Sales Value by Type (%), 2023 VS 2030
Figure 32. United States Tokenization Sales Value by Application (%), 2023 VS 2030
Figure 33. Europe Tokenization Sales Value, (2019-2030) & (US$ Million)
Figure 34. Europe Tokenization Sales Value by Type (%), 2023 VS 2030
Figure 35. Europe Tokenization Sales Value by Application (%), 2023 VS 2030
Figure 36. China Tokenization Sales Value, (2019-2030) & (US$ Million)
Figure 37. China Tokenization Sales Value by Type (%), 2023 VS 2030
Figure 38. China Tokenization Sales Value by Application (%), 2023 VS 2030
Figure 39. Japan Tokenization Sales Value, (2019-2030) & (US$ Million)
Figure 40. Japan Tokenization Sales Value by Type (%), 2023 VS 2030
Figure 41. Japan Tokenization Sales Value by Application (%), 2023 VS 2030
Figure 42. South Korea Tokenization Sales Value, (2019-2030) & (US$ Million)
Figure 43. South Korea Tokenization Sales Value by Type (%), 2023 VS 2030
Figure 44. South Korea Tokenization Sales Value by Application (%), 2023 VS 2030
Figure 45. Southeast Asia Tokenization Sales Value, (2019-2030) & (US$ Million)
Figure 46. Southeast Asia Tokenization Sales Value by Type (%), 2023 VS 2030
Figure 47. Southeast Asia Tokenization Sales Value by Application (%), 2023 VS 2030
Figure 48. India Tokenization Sales Value, (2019-2030) & (US$ Million)
Figure 49. India Tokenization Sales Value by Type (%), 2023 VS 2030
Figure 50. India Tokenization Sales Value by Application (%), 2023 VS 2030
Figure 51. Tokenization Industrial Chain
Figure 52. Tokenization Manufacturing Cost Structure
Figure 53. Channels of Distribution (Direct Sales, and Distribution)
Figure 54. Bottom-up and Top-down Approaches for This Report
Figure 55. Data Triangulation
SELECT A FORMAT
Added to Cart
Electronic (PDF)

$3950

This license allows only one user to access the PDF.
Electronic (PDF)

$7900

This license allows users/teams in a same Enterprise to use this report, various departments within an enterpise can use this report
Add to Cart
Buy Now (15% Discount)

OUR CUSTOMER

SIS Group of Schools

RELATED REPORTS

Raster Image Processor (RIP) - Global Market Share and Ranking, Overall Sales and Demand Forecast 2024-2030

120 Pages
Type: Report
Code: QYRE-Auto-31I14106
Tue Nov 12 00:00:00 UTC 2024

Add to Cart

AI Vulnerability Scanning - Global Market Share and Ranking, Overall Sales and Demand Forecast 2024-2030

120 Pages
Type: Report
Code: QYRE-Auto-12L15782
Mon Nov 11 00:00:00 UTC 2024

Add to Cart

Artificial Intelligence for Retail - Global Market Share and Ranking, Overall Sales and Demand Forecast 2024-2030

120 Pages
Type: Report
Code: QYRE-Auto-28S15368
Mon Nov 11 00:00:00 UTC 2024

Add to Cart

Medical Remote Monitoring System - Global Market Share and Ranking, Overall Sales and Demand Forecast 2024-2030

120 Pages
Type: Report
Code: QYRE-Auto-39Y14060
Fri Nov 08 00:00:00 UTC 2024

Add to Cart