
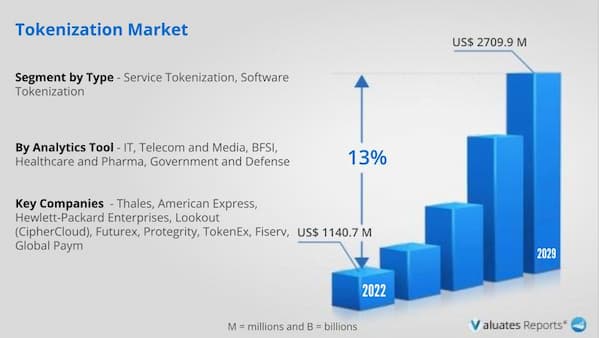
Tokenization market is projected to reach US$ 2709.9 million in 2029, increasing from US$ 1140.7 million in 2022, with the CAGR of 13.0% during the period of 2023 to 2029. Key drivers of the market include the increasing need to stay compliant with regulations, ensuring seamless customer experience, and rising concerns regarding cyberattacks, frauds, and data breaches. Tokenization is the process of turning a meaningful piece of data into a random string of characters called tokens. The data can be an account number or a payment card number etc. Tokens are used as a reference for storing the original sensitive data but cannot be used to guess the sensitive information as it is not based on a mathematical process.
As online payments increase and more people shift towards contactless payment, financial crimes are rising leading to an increase in demand for the tokenization market across the globe. Moreover, Covid-19 has accelerated the growth of the market as more people are now aligning themselves with cloud-based tokenization solutions and services in order to protect their sensitive data against fraud and data breaches.
Rising concerns of cyberattacks and financial frauds are fuelling the market growth
People and businesses are now moving towards contactless payments. As more payments are made online, there is a growing risk of fraud and cyberattacks which compromise the status of people’s personal information in the virtual world. This has led to an increase in demand for cloud-based tokenization solutions and services for data security leading to an increase in the growth of the tokenization market globally.
The tokenization market will further fuel the growth of the market in the coming years
The tokenization market size is going to grow further as the demand for the asset tokenization market rises. Asset tokenization is the process of issuing a token within a blockchain. This token includes anything which has an exchange value such as gold, oil, cattle, etc. Blockchain technology provides immense benefits with respect to fraud prevention and cost-efficiency ratio. Though the asset tokenization market size is still in the early stages, there are still lucrative opportunities for the growth of the tokenization market during the forecast period.
Real estate investments hold potential for providing lucrative opportunities for the growth of the market
Tokenization and the token market provide exciting possibilities for the growth of real estate investments. Tokenization with respect to real estate involves fractional ownership interest of real estate assets with a blockchain technology-based token. Although the real estate sector is in its early stages still it will create lucrative opportunities for the growth of the tokenization market during the forecast period.
The presence of key tokenization companies will further propel the growth of the market
The presence of various tokenization companies with asset tokenization platforms will further propel the growth of the tokenization market during the forecast period. Companies such as Hp Enterprises, CipherCloud, FutureX, Visa, etc are the key market players in the tokenization sector. Microsoft is also offering blockchain as a service through the tokenization framework for entry to blockchain technology for many enterprises. The presence of key players in the sector will increase the demand for the tokenization market across the globe.
Based on region, North America is expected to hold the largest tokenization market share due to various factors such as an increase in eCommerce payments, online gaming, shopping, a fully regulated market, a rise in online streaming, more usage of smartphones, and increasing cyberattack cases. North America is the largest market, with a share about 58%, followed by Europe and Asia-Pacific with the share about 23% and 12%.
Based on application the BFSI sector is expected to hold the largest tokenization market share during the forecast period as BFSI is the prime target for cybercriminals as the sector deals with money. Thus BFSI companies are always on the lookout for more advanced payment security solutions and services for protecting their employees, clients, assets, office, branches, and operations, etc.
Based on type the services and solution segment is expected to hold the largest tokenization market share as small and medium enterprises increase their adoption of tokenization as a service for saving their time, money, and resources.
Global tokenization includes Thales, American Express, Visa (CyberSource), etc. Global top 5 companies hold a share about 40%.
| Report Metric | Details |
| Report Name | Global Tokenization Market |
| Base Year | 2022 |
| Forecasted years | 2023-2029 |
| By Company |
|
| Segment by Type |
|
| Segment by Application |
|
| By Region |
|
| Forecast units | USD million in value |
| Report coverage | Revenue and volume forecast, company share, competitive landscape, growth factors and trends |
Ans. Tokenization market is projected to reach US$ 2709.9 million in 2029, increasing from US$ 1140.7 million in 2022, with the CAGR of 13.0% during the period of 2023 to 2029.
Ans. The global Tokenization market is expected to grow at a compound annual growth rate of 13.0% from 2022 to 2028.
Ans. Global tokenization includes Thales, American Express, Visa (CyberSource), etc. Global top 5 companies hold a share about 40%.
Ans. Yes, ChapterWise report available for the Tokenization market.
$3950
$7900
HAVE A QUERY?
OUR CUSTOMER

SIMILAR REPORTS