
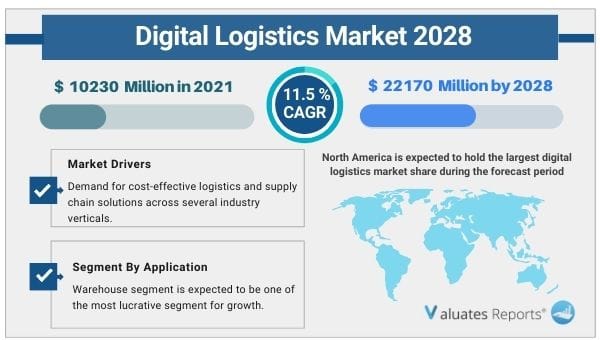
The global Digital Logistics market size is projected to reach US$ 22170 million by 2028, from US$ 10230 million in 2021, at a CAGR of 11.5% during 2022-2028. Key drivers of the digital logistics market include demand for cost-effective logistics and supply chain solutions across several industry verticals. In addition to it the growing digitalization trend and rising demand for fleet and warehouse management systems are also driving the growth of the market. Other factors contributing to the growth of the digital logistics market are the evolving data analytics technologies and tools leading to rapid adoption by logistics companies, growing penetration of the eCommerce industry, enhancement of delivery capabilities through the usage of drones, and digital trucks for carrying out shipments. Moreover digital logistics allows growing collaboration between diverse internal and external stakeholders for reducing the data silo effect which further creates lucrative opportunities for the growth of the market.
Surging ecommerce activity is leading logistics companies to handle tiny individual requests more swiftly and accurately.Consumers now demand accurate orders, same day or same hour delivery and free returns.Moreover users can track location, availability and movement of assets through digital logistics systems.They also enable consumers to keep track of asset in real time. Thus with consumers getting used to digital services they want the same flexibility and quality of service in other industries as well. Hence there has been a growing digital transformation in the logistics industry with companies providing multiservice online platforms for catering to the needs of both personal and business consumers further facilitating the growth of the digital logistics market during the forecast period. Moreover, the rising global middle class and increasing internet penetration are also contributing to the growth of the market.
Due to growing globalization of supply chains and freight logistics there is an increasing need to effectively manage the increasing logistics and supply costs. Various freight businesses can effectively manage a wide range of expenses by using detailed digital logistics solutions such as warehouse management, fleet management, labor and transportation management. Thus globalized supply chain and freight logistics is creating increasing demand for warehouse and fleet management systems etc ultimately surging the growth of the digital logistics market during the forecast period.
Increased Usage of advanced technology for data driven information and data silo
Major industry players are using advanced analytics tools, software for supply chain optimization, reducing maintenance costs, and increasing utilization. There is also an increasing usage of tools by companies for control tower solutions with real-time visibility leading to incremental benefits by reducing downtime and recovery costs. Further, with new delivery options offering efficient delivery of shipments such as digital trucks, drones etc the market is expected to witness a huge growth in the coming years. Moreover digital logistics allows collaboration between internal and external stakeholders and reduces multiple maintenance of data in separate systems called data silo effect by providing a single interface that provides a wholesome of the supply chain increases, cross department, cross trading partner visibility and coordination thereby increasing agility and reaction time. Thus wide scale adoption due to increasing advanced technology and data silo effect benefit will spur the demand for the digital logistics market during the forecast period.
Huge customer and social benefits
Digital transformation has the capability to bring in a new revolution in the logistics space by providing a host of benefits. These include reduced CO2 emissions, exponential growth of cross border trade ,simplification of trade processes by online platforms and discounts to customers due to rising utilization levels. Thus a growing number of benefits will provide exponential growth for the digital logistics market especially from initiatives such as shared warehouse agreements. Moreover, the rise of digitally enhanced cross-border platforms will provide lucrative opportunities for the logistics industry to earn profits. And with growing advancements in sensors and IoT technologies, various logistics vendors will be attracted to invest heavily in digital solutions of the industry, leading to the growth of the Digital Logistics market.
Based on region, North America is expected to hold the largest digital logistics market share during the forecast period due to significant presence of IT corporations in the US and Canada, rising investments in cutting edge digital logistics systems and services, developed economy and rapid technical breakthroughs.
Based on application, the warehouse segment is expected to be one of the most lucrative segment for growth in the digital logistics market share during the forecast period as the warehouse segment is widely used for tracking the arriving and outgoing of merchandise in the warehouse and orders are synced with inbound and outbound logistics data in the WMS.
| Report Metric | Details |
| Report Name | Digital Logistics Market |
| The market size in 2021 | USD 10230 Million |
| The revenue forecast in 2028 | USD 22170 Million |
| Growth Rate | Compound Annual Growth Rate (CAGR) of 11.5% from 2022 to 2028 |
| Market size available for years | 2022-2028 |
| Forecast units | Value (USD) |
| Segments covered | Type, Application and Region |
| Report coverage | Revenue & volume forecast, company share, competitive landscape, growth factors, and trends |
| Geographic regions covered | North America, Europe, Asia Pacific, Latin America, Middle East & Africa |
Ans. Digital Logistics market size is projected to reach US$ 22170 million by 2028, from US$ 10230 million in 2021.
Ans. The global Digital Logistics market is expected to grow at a compound annual growth rate of 11.5% from 2022 to 2028.
Ans. Some of the major companies are Advantech Corportion, Digilogistics, Hexaware Technologies, IBM, JDA Software, Oracle, Samsung Co, SAP Ag, Tech MahindrA, UTI Worldwide Inc.
List of Tables
Table 1. Global Digital Logistics Market Size Growth Rate by Type (US$ Million), 2017 VS 2021 VS 2028
Table 2. Key Players of Consulting Services
Table 3. Key Players of System Integration Services
Table 4. Key Players of Others Services
Table 5. Global Digital Logistics Market Size Growth Rate by Application (US$ Million), 2017 VS 2021 VS 2028
Table 6. Global Digital Logistics Market Size by Region (US$ Million): 2017 VS 2021 VS 2028
Table 7. Global Digital Logistics Market Size by Region (2017-2022) & (US$ Million)
Table 8. Global Digital Logistics Market Share by Region (2017-2022)
Table 9. Global Digital Logistics Forecasted Market Size by Region (2023-2028) & (US$ Million)
Table 10. Global Digital Logistics Market Share by Region (2023-2028)
Table 11. Digital Logistics Market Trends
Table 12. Digital Logistics Market Drivers
Table 13. Digital Logistics Market Challenges
Table 14. Digital Logistics Market Restraints
Table 15. Global Digital Logistics Revenue by Players (2017-2022) & (US$ Million)
Table 16. Global Digital Logistics Revenue Share by Players (2017-2022)
Table 17. Global Top Digital Logistics by Company Type (Tier 1, Tier 2, and Tier 3) & (based on the Revenue in Digital Logistics as of 2021)
Table 18. Ranking of Global Top Digital Logistics Companies by Revenue (US$ Million) in 2021
Table 19. Global 5 Largest Players Market Share by Digital Logistics Revenue (CR5 and HHI) & (2017-2022)
Table 20. Key Players Headquarters and Area Served
Table 21. Key Players Digital Logistics Product Solution and Service
Table 22. Date of Enter into Digital Logistics Market
Table 23. Mergers & Acquisitions, Expansion Plans
Table 24. Global Digital Logistics Market Size by Type (2017-2022) & (US$ Million)
Table 25. Global Digital Logistics Revenue Market Share by Type (2017-2022)
Table 26. Global Digital Logistics Forecasted Market Size by Type (2023-2028) & (US$ Million)
Table 27. Global Digital Logistics Revenue Market Share by Type (2023-2028)
Table 28. Global Digital Logistics Market Size by Application (2017-2022) & (US$ Million)
Table 29. Global Digital Logistics Revenue Share by Application (2017-2022)
Table 30. Global Digital Logistics Forecasted Market Size by Application (2023-2028) & (US$ Million)
Table 31. Global Digital Logistics Revenue Share by Application (2023-2028)
Table 32. North America Digital Logistics Market Size by Type (2017-2022) & (US$ Million)
Table 33. North America Digital Logistics Market Size by Type (2023-2028) & (US$ Million)
Table 34. North America Digital Logistics Market Size by Application (2017-2022) & (US$ Million)
Table 35. North America Digital Logistics Market Size by Application (2023-2028) & (US$ Million)
Table 36. North America Digital Logistics Market Size by Country (2017-2022) & (US$ Million)
Table 37. North America Digital Logistics Market Size by Country (2023-2028) & (US$ Million)
Table 38. Europe Digital Logistics Market Size by Type (2017-2022) & (US$ Million)
Table 39. Europe Digital Logistics Market Size by Type (2023-2028) & (US$ Million)
Table 40. Europe Digital Logistics Market Size by Application (2017-2022) & (US$ Million)
Table 41. Europe Digital Logistics Market Size by Application (2023-2028) & (US$ Million)
Table 42. Europe Digital Logistics Market Size by Country (2017-2022) & (US$ Million)
Table 43. Europe Digital Logistics Market Size by Country (2023-2028) & (US$ Million)
Table 44. Asia Pacific Digital Logistics Market Size by Type (2017-2022) & (US$ Million)
Table 45. Asia Pacific Digital Logistics Market Size by Type (2023-2028) & (US$ Million)
Table 46. Asia Pacific Digital Logistics Market Size by Application (2017-2022) & (US$ Million)
Table 47. Asia Pacific Digital Logistics Market Size by Application (2023-2028) & (US$ Million)
Table 48. Asia Pacific Digital Logistics Market Size by Region (2017-2022) & (US$ Million)
Table 49. Asia Pacific Digital Logistics Market Size by Region (2023-2028) & (US$ Million)
Table 50. Latin America Digital Logistics Market Size by Type (2017-2022) & (US$ Million)
Table 51. Latin America Digital Logistics Market Size by Type (2023-2028) & (US$ Million)
Table 52. Latin America Digital Logistics Market Size by Application (2017-2022) & (US$ Million)
Table 53. Latin America Digital Logistics Market Size by Application (2023-2028) & (US$ Million)
Table 54. Latin America Digital Logistics Market Size by Country (2017-2022) & (US$ Million)
Table 55. Latin America Digital Logistics Market Size by Country (2023-2028) & (US$ Million)
Table 56. Middle East and Africa Digital Logistics Market Size by Type (2017-2022) & (US$ Million)
Table 57. Middle East and Africa Digital Logistics Market Size by Type (2023-2028) & (US$ Million)
Table 58. Middle East and Africa Digital Logistics Market Size by Application (2017-2022) & (US$ Million)
Table 59. Middle East and Africa Digital Logistics Market Size by Application (2023-2028) & (US$ Million)
Table 60. Middle East and Africa Digital Logistics Market Size by Country (2017-2022) & (US$ Million)
Table 61. Middle East and Africa Digital Logistics Market Size by Country (2023-2028) & (US$ Million)
Table 62. Advantech Corportion Company Details
Table 63. Advantech Corportion Business Overview
Table 64. Advantech Corportion Digital Logistics Product
Table 65. Advantech Corportion Revenue in Digital Logistics Business (2017-2022) & (US$ Million)
Table 66. Advantech Corportion Recent Developments
Table 67. Digilogistics Company Details
Table 68. Digilogistics Business Overview
Table 69. Digilogistics Digital Logistics Product
Table 70. Digilogistics Revenue in Digital Logistics Business (2017-2022) & (US$ Million)
Table 71. Digilogistics Recent Developments
Table 72. Hexaware Technologies Company Details
Table 73. Hexaware Technologies Business Overview
Table 74. Hexaware Technologies Digital Logistics Product
Table 75. Hexaware Technologies Revenue in Digital Logistics Business (2017-2022) & (US$ Million)
Table 76. Hexaware Technologies Recent Developments
Table 77. IBM Company Details
Table 78. IBM Business Overview
Table 79. IBM Digital Logistics Product
Table 80. IBM Revenue in Digital Logistics Business (2017-2022) & (US$ Million)
Table 81. IBM Recent Developments
Table 82. JDA Software Company Details
Table 83. JDA Software Business Overview
Table 84. JDA Software Digital Logistics Product
Table 85. JDA Software Revenue in Digital Logistics Business (2017-2022) & (US$ Million)
Table 86. JDA Software Recent Developments
Table 87. Oracle Company Details
Table 88. Oracle Business Overview
Table 89. Oracle Digital Logistics Product
Table 90. Oracle Revenue in Digital Logistics Business (2017-2022) & (US$ Million)
Table 91. Oracle Recent Developments
Table 92. Samsung Co Company Details
Table 93. Samsung Co Business Overview
Table 94. Samsung Co Digital Logistics Product
Table 95. Samsung Co Revenue in Digital Logistics Business (2017-2022) & (US$ Million)
Table 96. Samsung Co Recent Developments
Table 97. SAP Ag Company Details
Table 98. SAP Ag Business Overview
Table 99. SAP Ag Digital Logistics Product
Table 100. SAP Ag Revenue in Digital Logistics Business (2017-2022) & (US$ Million)
Table 101. SAP Ag Recent Developments
Table 102. Tech MahindrA Company Details
Table 103. Tech MahindrA Business Overview
Table 104. Tech MahindrA Digital Logistics Product
Table 105. Tech MahindrA Revenue in Digital Logistics Business (2017-2022) & (US$ Million)
Table 106. Tech MahindrA Recent Developments
Table 107. UTI Worldwide Inc Company Details
Table 108. UTI Worldwide Inc Business Overview
Table 109. UTI Worldwide Inc Digital Logistics Product
Table 110. UTI Worldwide Inc Revenue in Digital Logistics Business (2017-2022) & (US$ Million)
Table 111. UTI Worldwide Inc Recent Developments
Table 112. Research Programs/Design for This Report
Table 113. Key Data Information from Secondary Sources
Table 114. Key Data Information from Primary Sources
List of Figures
Figure 1. Global Digital Logistics Market Share by Type: 2021 VS 2028
Figure 2. Consulting Services Features
Figure 3. System Integration Services Features
Figure 4. Others Services Features
Figure 5. Global Digital Logistics Market Share by Application: 2021 VS 2028
Figure 6. Warehouse Management Case Studies
Figure 7. Labor Management Case Studies
Figure 8. Transportation management Case Studies
Figure 9. Digital Logistics Report Years Considered
Figure 10. Global Digital Logistics Market Size (US$ Million), Year-over-Year: 2017-2028
Figure 11. Global Digital Logistics Market Size, (US$ Million), 2017 VS 2021 VS 2028
Figure 12. Global Digital Logistics Market Share by Region: 2021 VS 2028
Figure 13. Global Digital Logistics Market Share by Players in 2021
Figure 14. Global Top Digital Logistics Players by Company Type (Tier 1, Tier 2, and Tier 3) & (based on the Revenue in Digital Logistics as of 2021)
Figure 15. The Top 10 and 5 Players Market Share by Digital Logistics Revenue in 2021
Figure 16. North America Digital Logistics Market Size YoY (2017-2028) & (US$ Million)
Figure 17. North America Digital Logistics Market Size Market Share by Type (2017-2028)
Figure 18. North America Digital Logistics Market Size Market Share by Application (2017-2028)
Figure 19. North America Digital Logistics Market Size Share by Country (2017-2028)
Figure 20. United States Digital Logistics Market Size YoY Growth (2017-2028) & (US$ Million)
Figure 21. Canada Digital Logistics Market Size YoY Growth (2017-2028) & (US$ Million)
Figure 22. Europe Digital Logistics Market Size YoY (2017-2028) & (US$ Million)
Figure 23. Europe Digital Logistics Market Size Market Share by Type (2017-2028)
Figure 24. Europe Digital Logistics Market Size Market Share by Application (2017-2028)
Figure 25. Europe Digital Logistics Market Size Share by Country (2017-2028)
Figure 26. Germany Digital Logistics Market Size YoY Growth (2017-2028) & (US$ Million)
Figure 27. France Digital Logistics Market Size YoY Growth (2017-2028) & (US$ Million)
Figure 28. U.K. Digital Logistics Market Size YoY Growth (2017-2028) & (US$ Million)
Figure 29. Italy Digital Logistics Market Size YoY Growth (2017-2028) & (US$ Million)
Figure 30. Russia Digital Logistics Market Size YoY Growth (2017-2028) & (US$ Million)
Figure 31. Nordic Countries Digital Logistics Market Size YoY Growth (2017-2028) & (US$ Million)
Figure 32. Asia-Pacific Digital Logistics Market Size YoY (2017-2028) & (US$ Million)
Figure 33. Asia Pacific Digital Logistics Market Size Market Share by Type (2017-2028)
Figure 34. Asia Pacific Digital Logistics Market Size Market Share by Application (2017-2028)
Figure 35. Asia Pacific Digital Logistics Market Size Share by Region (2017-2028)
Figure 36. China Digital Logistics Market Size YoY Growth (2017-2028) & (US$ Million)
Figure 37. Japan Digital Logistics Market Size YoY Growth (2017-2028) & (US$ Million)
Figure 38. South Korea Digital Logistics Market Size YoY Growth (2017-2028) & (US$ Million)
Figure 39. Southeast Asia Digital Logistics Market Size YoY Growth (2017-2028) & (US$ Million)
Figure 40. India Digital Logistics Market Size YoY Growth (2017-2028) & (US$ Million)
Figure 41. Australia Digital Logistics Market Size YoY Growth (2017-2028) & (US$ Million)
List of Figures
Figure 42. Latin America Digital Logistics Market Size YoY (2017-2028) & (US$ Million)
Figure 43. Latin America Digital Logistics Market Size Market Share by Type (2017-2028)
Figure 44. Latin America Digital Logistics Market Size Market Share by Application (2017-2028)
Figure 45. Latin America Digital Logistics Market Size Share by Country (2017-2028)
Figure 46. Mexico Digital Logistics Market Size YoY Growth (2017-2028) & (US$ Million)
Figure 47. Brazil Digital Logistics Market Size YoY Growth (2017-2028) & (US$ Million)
Figure 48. Middle East & Africa Digital Logistics Market Size YoY (2017-2028) & (US$ Million)
Figure 49. Middle East and Africa Digital Logistics Market Size Market Share by Type (2017-2028)
Figure 50. Middle East and Africa Digital Logistics Market Size Market Share by Application (2017-2028)
Figure 51. Middle East and Africa Digital Logistics Market Size Share by Country (2017-2028)
Figure 52. Turkey Digital Logistics Market Size YoY Growth (2017-2028) & (US$ Million)
Figure 53. Saudi Arabia Digital Logistics Market Size YoY Growth (2017-2028) & (US$ Million)
Figure 54. UAE Digital Logistics Market Size YoY Growth (2017-2028) & (US$ Million)
Figure 55. Advantech Corportion Revenue Growth Rate in Digital Logistics Business (2017-2022)
Figure 56. Digilogistics Revenue Growth Rate in Digital Logistics Business (2017-2022)
Figure 57. Hexaware Technologies Revenue Growth Rate in Digital Logistics Business (2017-2022)
Figure 58. IBM Revenue Growth Rate in Digital Logistics Business (2017-2022)
Figure 59. JDA Software Revenue Growth Rate in Digital Logistics Business (2017-2022)
Figure 60. Oracle Revenue Growth Rate in Digital Logistics Business (2017-2022)
Figure 61. Samsung Co Revenue Growth Rate in Digital Logistics Business (2017-2022)
Figure 62. SAP Ag Revenue Growth Rate in Digital Logistics Business (2017-2022)
Figure 63. Tech MahindrA Revenue Growth Rate in Digital Logistics Business (2017-2022)
Figure 64. UTI Worldwide Inc Revenue Growth Rate in Digital Logistics Business (2017-2022)
Figure 65. Bottom-up and Top-down Approaches for This Report
Figure 66. Data Triangulation
Figure 67. Key Executives Interviewed
$4900
$9800
HAVE A QUERY?
OUR CUSTOMER
SIMILAR REPORTS